HAL Id: hal-03033492
https://hal.archives-ouvertes.fr/hal-03033492
Submitted on 1 Dec 2020
HAL is a multi-disciplinary open access
archive for the deposit and dissemination of
sci-entific research documents, whether they are
pub-lished or not. The documents may come from
teaching and research institutions in France or
abroad, or from public or private research centers.
L’archive ouverte pluridisciplinaire HAL, est
destinée au dépôt et à la diffusion de documents
scientifiques de niveau recherche, publiés ou non,
émanant des établissements d’enseignement et de
recherche français ou étrangers, des laboratoires
publics ou privés.
DropLeaf: a precision farming smartphone application
for measuring pesticide spraying methods
Bruno Brandoli, Gabriel Spadon, Travis Esau, Patrick Hennessy, Andre
Carvalho, Jose Rodrigues-Jr, Sihem Amer-Yahia
To cite this version:
Bruno Brandoli, Gabriel Spadon, Travis Esau, Patrick Hennessy, Andre Carvalho, et al.. DropLeaf:
a precision farming smartphone application for measuring pesticide spraying methods. Journal of
Computers and Electronics in Agriculture, Elsevier, 2020. �hal-03033492�
DropLeaf: a precision farming smartphone application for measuring
pesticide spraying methods
Bruno Brandolia,∗, Gabriel Spadonb,∗, Travis Esaud, Patrick Hennessyd, Andre C. P. L. Carvalhob, Jose F. Rodrigues-Jrc,b,∗, Sihem Amer-Yahiac
aDalhousie University – Halifax, Nova Scotia, Canada bUniversity of Sao Paulo – Sao Carlos, SP, Brazil cCNRS, Univ. Grenoble Alpes – Grenoble-Alpes, France
dDalhousie University – Truro, Nova Scotia, Canada
Abstract
Pesticide application has been heavily used in the cultivation of major crops, contributing to the increase of crop production over the past decades. However, their appropriate use and calibration of machines rely upon evaluation methodologies that can precisely estimate how well the pesticides’ spraying covered the crops. A few strategies have been proposed in former works, yet their elevated costs and low portability do not permit their wide adoption. This work introduces and experimentally assesses a novel tool that functions over a smartphone-based mobile application, named DropLeaf - Spraying Meter. Tests performed using DropLeaf demonstrated that, notwithstanding its versatility, it can estimate the pesticide spraying with high precision. Our methodology is based on image analysis, and the assessment of spraying deposition measures is performed successfully over real and synthetic water-sensitive papers. The proposed tool can be extensively used by farmers and agronomists furnished with regular smartphones, improving the utilization of pesticides with well-being, ecological, and monetary advantages. DropLeaf can be easily used for spray drift assessment of different methods, including emerging UAV (Unmanned Aerial Vehicle) sprayers.
Keywords: deposition analysis, spray coverage characterization, water sensitive papers and cards, UAVs spray, precision farming
1. Introduction
The total world population is estimated to be 7 billion individuals, with a projection of expanding to 9.2 billion by 2050. This expansion will request almost 70% more nourishment because of changes in dietary (more dairy and grains) in underdeveloped countries (Food and Organization,2009). To adapt to such circumstances, it is obligatory to expand the efficiency of the existing cultivation areas, which might be accomplished by a more reliable food chain and the utilization of pesticides (Cooper and Dobson,
2007;Kesterson et al.,2015;Wang et al.,2019b). Pesticides are chemical compounds used for decimating weed plants (herbi-cides), parasitic (fungi(herbi-cides), or insects (insecticides) (Bon et al.,2014). The utilization of pesticides is spread around the world, representing a 40-billion-dollar yearly budget (Popp et al.,2013) with huge amounts of synthetic compounds (approximately 2 kg per hectare (Liu et al.,2015)) being sprayed over a wide range of harvests to augment the production of food. Current pieces of evidence point that farming is to confront heavier stress from pests, prompting to a higher interest for pesticides (Popp et al.,2013). To minimize the risk of crop losses because of herbivorous insects and mites, most of the world’s commercial food production systems are subject to several applications of pesticides before being cropped (Cooper and Dobson,2007;Berenstein and Edan,
2018). In this situation, it is significant that the right measure of pesticide be sprayed on the harvest fields. Excessive amounts of chemicals may leave residues in the produced food alongside ecological tainting (Gonzalez-Rodriguez et al.,2008;Farha et al.,
2018;Witton et al.,2018). On the other hand, insufficient doses, and there may be areas of the harvest field that are not protected, lessening productivity (Dougoud et al.,2019). For instance,Boina et al.(2012) investigated that spray droplet size is key in the efficacy of pesticides against Asian citrus psyllid. Meanwhile, irregular spray coverage might cause pest and/or weed resistance, or behavioral avoidance (Renton et al.,2014;Martini et al.,2012). Many fertilizers are often applied as liquid solutions sprayed into plant leaves and soil (Marcal and Cunha,2008); to assess their pulverization, it is important to quantify the spray coverage, the relative zone secured by the pesticide droplets – usually composed of the water carrier, active ingredients, and adjutant. In today’s precision agriculture, several papers investigate the spray drift from agricultural pesticide sprayers and their consequential economic and environmental effects (Preftakes et al.,2019).
The issue of estimating the spray coverage refers to calculating how much pesticide was showered on each piece of the harvest field. The standard way to do that is to disseminate oil- or water-sensitive papers along with the soil and underplant leaves. Then, such cards are covered with a bromoethyl dye that turns blue within the presence of liquid (Giles and Downey,2003). The issue,
∗Corresponding authors: [email protected] (B. Brandoli), [email protected] (G. Spadon), and [email protected] (J. F. Rodrigues-Jr)
at that point, progresses towards surveying each card by tallying the number of droplets per unitary area, by drawing their size distribution, and by evaluating the level of the card area that was covered; these measures enable one to gauge the volume of showered pesticide per unitary area of the harvest. If done manually, this procedure is inefficient and may miss some areas. This is when automatic solutions become essential, including the Swath Kit (Mierzejewski,1991), a pioneer computer-based procedure that utilizes image processing to asses the water-sensitive cards; the USDA-ARS system (W.C. and A.J.,2005), a camera-based framework that uses 1-cm2 samples from the cards to form a pool of sensor information; the DropletScan (R.E.,2003), a flatbed scanner defined over a proprietary equipment; the DepositScan framework, made of a workstation and a handheld card scanner (Zhu et al.,2011); and the AgroScan System1, a batch-based outsource Windows-based software that analyzes the collected cards. Every
one of these frameworks, though, are inconvenient to convey all through the field, requiring the collection, scanning, and post-processing of the cards, a tedious and labor-intensive procedure.
An option to image capturing systems is to address the characterization of spray application by using wired or remote sen-sors (Crowe et al.,2005;Giles and Crowe,2007). However, those are costly and necessitate constant maintenance. Very recently,
Wang et al.(2019a) implemented a novel droplet deposit sensing system based on a sensor to store the deposition. Then, algo-rithm Q-LearningWatkins and Dayan(1992) is used to accurately determine the droplet parameters from UAVs (Unmanned Aerial Vehicles). In 2019,Wang et al.(2019b) implemented a new capacitor sensor system for measuring the spray deposit of herbicide application. Moreover, several non-imaging spray methods have been developed for spray analysis by means of non-intrusive char-acterization, such as phase doppler particle analyzers (PDPA) (Nuyttens et al.,2009), piezoelectric sensors (Gargari et al.,2019), laser diffraction analyzers (e.g., Malvern analyzers (Stainier et al.,2006)), and optical array probes (Teske et al.,2002). They were all designed to assess the quality of spray coverage, including the droplets’ size and volume.
Alternatively, a number of image-based approaches have been introduced to assess the efficiency of the spraying deposition quality. Such means profit from the advanced innovations found in smartphones (Xia et al.,2015), which convey computing assets powerful enough to enable a wide scope of uses. In the form of a smartphone application, an image-based system is conceivable as a promptly-accessible tool, portable up to the harvest field, to help ranchers and agronomists estimate the spray coverage, consequently, in decisions concerning where and how to pulverize. This is the present investigation point, wherein we present DropLeaf - Spraying Meter2, a wireless application ready to gauge the measure of pesticide showered on water-sensitive papers.
DropLeaf enables precision agriculture, with the potential to improve the evaluation of pesticide showering. It utilizes the phone’s camera to register pictures of the spray cards and, nearly immediately, it creates evaluations of the spray coverage using methods based on image processing.
In this context, SnapCard was the first pesticide spray coverage tool developed for running over a smartphone (Nansen et al.,
2015;Ferguson et al.,2016). Nevertheless, it presents two drawbacks: i) it calculates the coverage area of the water-sensitive paper only, and ii) it does not allow the user to load a photo from the phone’s gallery. Dropcard with DropScope is a similar and commercial smartphone application that relies on an external water-card reader; currently, it works under restricted card sizes. Table1compares our proposed solution to the other smartphone applications developed for measuring spraying coverage. It is worth saying that the smartphone application named Gotas (Chaim et al.,1999) is not covered since it was discontinued; it is no longer distributed.
Smartphone Application Cost and Platform Advantages Limitations
DropLeaf
Machado et al.(2018)
Website
free, Android
- elaborated user interface
- it calculates several statistical measures - it works with any card size - it exports the card measurements
- it runs over Android only
- the user must load the card previously cropped using an external photo editor SnapCard
Nansen et al.(2015)
Website
free, Android and IOs
- elaborated user interface
- it runs over both Android and IOs platforms - it saves the card measurements
- it calculates the coverage area over the water-sensitive paper only - it does not allow the users to load card photos from the gallery
DropCard with DropScope
Website commercial, Android
- it calculates several statistical measures - it saves additional information based on reports
- it demands additional hardware to read the cards - the segmentation of bigger drops fails
- it does not load from the photo gallery, hampering the reproduction of previous analyses - it just reads regular size cards (7.6 cm × 2.6 cm)
- it runs over Android only
Table 1: Comparison of different smartphone applications developed for pesticide spraying assessment using water-sensitive paper.
The remainder of the paper is structured as follows. Section 2describes the steps of the proposed approach to measure the quality of pest control spraying. In addition, it describes the techniques implemented in the mobile application. In Section3, we show the results achieved by our application in comparison to related works. Section4discusses the use of fractal theory in the task of evaluating spray coverage, and Section5reviews relevant aspects related to our results. Conclusions come in Section6.
1http://www.agrotec.etc.br/produtos/agroscan/
2. Methodology
In this section, we introduce our methodology, named DropLeaf, to estimate the pesticide spray coverage. The goal is to quantify the coverage area of water-sensitive papers or spray cards, so to help to estimate how adequate was the pesticide pulverization, as discussed in Section1. DropLeaf builds upon image processing strategies developed on a portable application that is practical on commodity mobile phones. The tool draws three standard measures (W.C. and A.J.,2005) from the drops observed on the spray cards, producing a numerical summary that allows assessing the spraying:
• Coverage Area (CA): given in percentage of covered area per area unit in cm2;
• Volumetric Median Diameter (VMD): given by the 50th percentile DV0.5of the diameter distribution; • Relative Span (RS): given by RS = DV0.9−DV0.1
DV0.5 , where DV0.1 is the 10th percentile and DV0.9is the 90th percentile of the diameter distribution.
These three measures drive the estimation of the amount of the field covered with pesticide and how well the pesticide was scattered; finer diameters and higher coverage areas indicate a better scattering.
So as to figure out those measures, it is important to gauge the diameter (in micrometers) of each drop observed on a given card. Manually, this is an arduous task that might take hours per card. To mitigate that, DropLeaf utilizes an intricate image processing method that saves time and provides higher accuracy when contrasted to manual examination and previous systems.
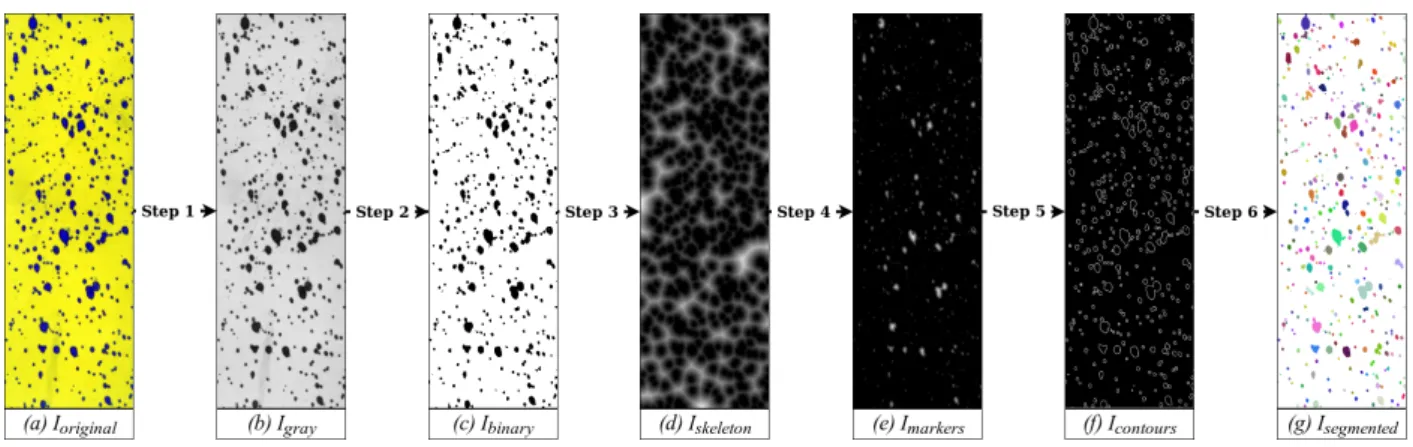
Figure 1shows the image processing of DropLeaf, which comprises of six steps carried over a given spray card: (i) color space conversion; (ii) binary noise removal; (iii) morphological operation of skeletonization; (iv) thresholding; (v) identification of droplets via the marker-based watershed algorithm; and (vi) visualization. We clarify each step indicating why it was necessary and how it identifies with the subsequent step. To illustrate the processing steps, we use a running sample whose picture is exhibited in Figure1(a).
Fig. 1: The image processing course of DropLeaf. It begins by loading an image of a water-sensitive paper. We then perform a color-space transformation to obtain a grayscale version of the image – Step 1. Subsequently, the grayscale image is binarized to isolate the drops and to remove noise – Step 2. Next, we apply the morphological operation of skeletonization – Step 3, after which we apply a thresholding operation so to emphasize the drops’ markers – Step 4. Finally, we use the markers to find the contours of the drops using the marker-based watershed algorithm – Step 5, providing the tool with a well-defined set of droplets – visualized after Step 6.
2.1. Grayscale transformation
After the acquisition of an image via the cellphone camera Ioriginal(x, y) = (Rxy, Gxy, Bxy) ∈ [0, 1]3, Step 1 converts it to a grayscale image Igray(x, y) ∈ [0, 1]. This is necessary to ease the discrimination of the card surface from the drops that fell on it. We use the continuous domain of [0,1] so that our formalism can express any color depth; specifically, we use 32 bits for RGB and 8 bits for grayscale. Color information is not needed as it would make the computation heavier and more complex. This first step then transforms the image into a grayscale representation, see Figure1(b), according to:
Igray(x, y)= 0.299 ∗ Rxy+ 0.587 ∗ Gxy+ 0.114 ∗ Bxy (1)
2.2. Binarization
Here, the grayscale image Igraypasses through a threshold-based binarization process – Step 2, a usual step for image segmenta-tion. Since the grayscale is composed of a single color channel, we achieve binarization by choosing a threshold value. Gray values Igray(x, y) below the threshold become black and white otherwise. Since spray cards are designed to stress the contrast between
the card and the drops, the threshold value is set as a constant value – we use value 0.35 corresponding to value 90 in the 8-bit domain [0, 255]. This is a choice that removes noise, and that favors faster processing if compared to more elaborated binarization processes like those based on clustering or on gray-levels distribution. Figure1(c) depicts the result, an image Ibinary(x, y) ∈ {0, 1} given by: Ibinary(x, y)= 0, if Igray(x, y) < 0.35 1, otherwise (2) 2.3. Skeletonization
At this point, we need to identify marks that will spot each drop individually – Step 3. We use the morphology operation of distance transform considering the Euclidean norm and a scale factor of 3 (Gonzalez and Woods,2007). This algorithm will set the intensity of the white pixels proportional to the distance to their closest black pixel, that is, to the closest drop boundary. The result is a skeleton that emphasizes the inner regions of the drops. Formally, we produce an image Iskeletonaccording to:
Iskeleton(x, y)= min( q
(x − x0)2+ (y − y0)2), ∀ (x0, y0) ∈ I
binary, (x0, y0)= 0 (3)
We normalize the distances computed during the skeletonization using min-max, after which all the pixels’ intensities lie within the range [0,1] – see Figure1(d).
2.4. Thresholding
Next, we refine the skeleton image to mark the positions of the drops properly. We use a filter based on a threshold value – we empirically defined the value of 0.17, but the user can interactively redefine it according to the number and structure of drops. After that, only the strongest most central pixels of each drop will remain in the image, as illustrated in Figure1(e)
Imarkers(x, y)= 0, if Iskeleton(x, y) < 0.17 (x, y), otherwise (4)
2.5. Marker-based watershed segmentation
In the last step – Step 4, with drops properly marked on the image, we proceed to the drop identification considering the previously identified contours. To this end, we used the marker-based watershed segmentation. Watershed (Vincent and Soille,
1991) is a technique that considers an image as a topographic relief in which the gray level of the pixels corresponds to their altitude. The transform proceeds by simulating the flooding of a landscape starting at the local minima. This process forms basins that are gradually fulfilled with water. Eventually, the water from different basins meet, indicating the presence of ridges (boundaries); this is an indication that a segment was found and delimited. The process ends when the water reaches the highest level in the color-encoding space. The problem with the classical watershed is that it might over-segment the image in the case of an excessive number of minima. For better precision, we use the marker-controlled variation of the algorithm proposed by (Gaetano et al.,2012). This variation is meant for images in which the shapes are previously marked. Given the markers, the marker-based watershed proceeds by considering as minima only the pixels within the markers’ boundaries. Watershed is an iterative algorithm computationally represented by a function watershed(Image i, Image[] markers). We use such a function to produce a set of segments (drops) over the gray-level image Igraywhile considering the set of markers identified in the image Imarkers, as follows:
contours[]= watershed(Igray, f indContours(Imarkers)) (5)
where Image[] f indContours(Image i) is a function that, given an image, returns a set of sub-images corresponding to the markers; watershed is a function that, given an input image and a set of markers corresponding to subsets of pixels, produces a set of segments stored in an array of contours, which we illustrate in Figure1(f).
We use the product of watershed to produce our final output Isegmented by drawing the segments over the original image, as illustrated in Figure1(g). Notice that the last image, Isegmented, is meant only for visualization. The statistical analysis over the drops’ shapes is computed over the set of segments.
2.6. Diameter processing
After the segmentation, we have a set of segments, each corresponding to a drop of pesticide. The final step is to compute the measures presented at the beginning of this section: coverage area (CA), volumetric median diameter (VMD), and relative span (RS). Since we have the segments computationally represented by an array of binary matrices, we can calculate the area and the
diameters of each drop by counting each matrix’s pixels. After counting, it is necessary to convert the diameter given in pixels into a diameter given in micrometers (µm), which, for the i-th drop, goes as follows:
diameterµm(dropi)= widthpx(dropi) ∗
widthcardµm widthcard px
(6)
where, widthpx(dropi) is the width in pixels of the i-th drop; widthcardpx is the width of the card in pixels; and width card
µm is the width of the card in micrometers. Notice that we used width, but we could have used height as well; what matters is that the fraction provides a conversion ratio given in px/µm, which is not sensitive to the axis; horizontal or vertical, the ratio is the same for a non-distorted image.
Notice that we obtain widthpx(dropi) and widthcardpx via image processing, after the segmentation method; meanwhile, widthcardµm is a constant provided by the user, corresponding to the real-world width of the card. Also, notice that we are considering that the diameter corresponds to the horizontal axis (the width) of the drop; it is possible, however, that the diameter corresponds to the vertical axis, in which case the formulation is straightly similar. Choosing between the horizontal and the vertical axes might be tricky in case the drop is elliptical, rather than circular. We solved this issue by extracting the diameter from the area of the drop. We use the formula of the circle area acircle= π ∗ radius2= π ∗ (diameter2 )2. With simple algebra, we conclude that given the area in pixels of the i-th drop, its diameter in pixels is given by the following equation:
diameterpx(dropi)= 2 ∗ r
areapx(dropi)
π (7)
Rewriting Equation6by means of Equation7, we get:
diameterµm(dropi)= 2 ∗ r areapx(dropi) π ∗ widthcardµm widthcardpx (8)
Once the diameter is converted into micrometers, it becomes trivial to compute all the measures that support the spray card analysis, as described at the beginning of Section2.
2.7. Implementation
The use of mobile devices to perform automatic tasks has increased fast (Xia et al.,2015). The reasons are the recent advances in hardware, such as sensors, processors, memories, and cameras. Thereby, smartphones have become platforms for applications of image processing and computer vision (Giovanni Maria et al.,2015;Machado et al.,2016).
Mobile devices are adequate to perform real-time tasks in situ, far from the laboratory. In this context, besides the methodology, this work’s contribution is the development of a mobile application to measure the quality of pesticide spraying on water-sensitive cards. For implementation, we used methods from the OpenCV library3, and Java was the programming language. The application
is fully functional, as depicted in Figure2, and available in the Google Play platform athttps://play.google.com/store/ apps/details?id=upvision.dropleaf.
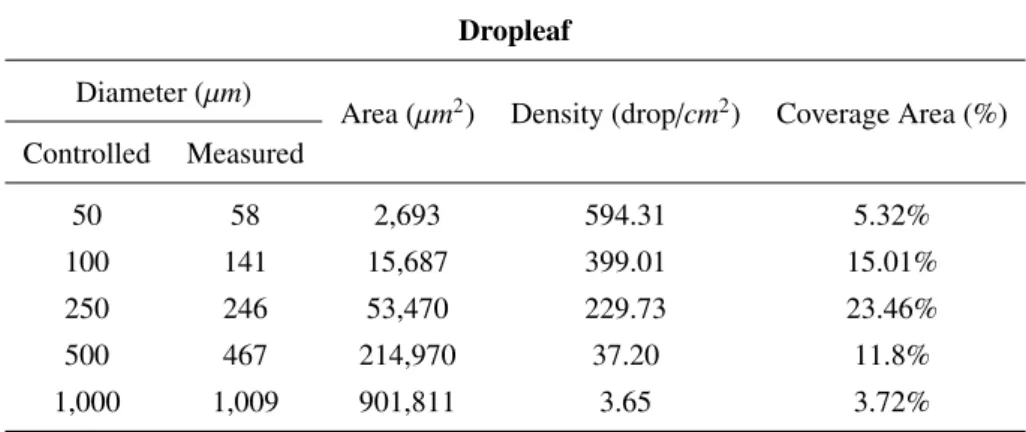
Dropleaf Diameter (µm)
Area (µm2) Density (drop/cm2) Coverage Area (%) Controlled Measured 50 58 2,693 594.31 5.32% 100 141 15,687 399.01 15.01% 250 246 53,470 229.73 23.46% 500 467 214,970 37.20 11.8% 1,000 1,009 901,811 3.65 3.72%
Table 2: DropLeaf drop identification over the control card by enterprise Hoechst.
Fig. 2: Screenshots of our fully-functional app. From left to right: home screen; photo capture of the water-sensitive-card; segmentation process; segmentation result; and computed metrics. Freely available for download onGooglePlay.
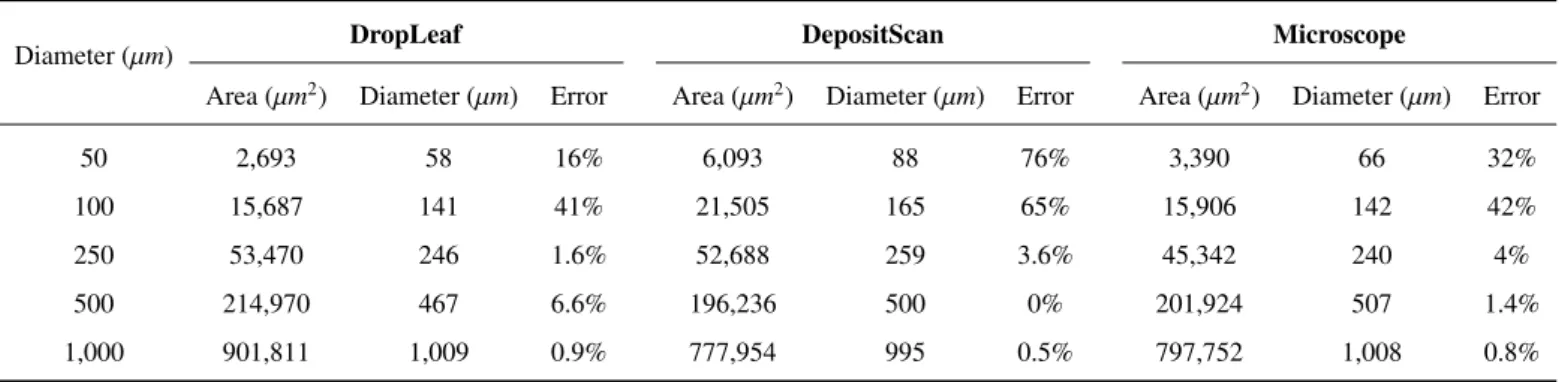
Diameter (µm) DropLeaf DepositScan Microscope
Area (µm2) Diameter (µm) Error Area (µm2) Diameter (µm) Error Area (µm2) Diameter (µm) Error
50 2,693 58 16% 6,093 88 76% 3,390 66 32%
100 15,687 141 41% 21,505 165 65% 15,906 142 42%
250 53,470 246 1.6% 52,688 259 3.6% 45,342 240 4%
500 214,970 467 6.6% 196,236 500 0% 201,924 507 1.4%
1,000 901,811 1,009 0.9% 777,954 995 0.5% 797,752 1,008 0.8% Table 3: DropLeaf compared to tool DepositScan and a stereoscopic microscope with respect to the control card.
3. Experimental results
In this section, we evaluate our methodology in measuring the spray coverage deposition. The goal is to correctly measure the spray drops in terms of density (percentage of coverage per cm2) and drop diameter. The first set of experiments was conducted over a control card used by enterprise Hoechst, demonstrating the accuracy in controlled conditions. The second set of experiments was conducted over a real water-sensitive card used on soy crops, demonstrating that the application works even during in situ conditions.
(a) (b) (c) (d) (e) (f)
Fig. 4: Drop identification over cards used in a real crop. We categorized the cards as: sparse – images (a) and (b); medium – images (c) and (d); and dense – images (e) and (f). The ones on the left are the original cards, and at the right are the segmented cards.
Dropleaf
Sample Drops Area (µm2) Density Coverage Volumetric Median Relative
(drop/cm2) Density (%) Diameter (µm) Span
sparse (a) 255 250,138 12.90 4.54 452 1.22 sparse (b) 359 261,464 18.16 6.45 425 1.55 medium (c) 448 355,712 22.67 9.99 448 1.83 medium (d) 444 357,005 22.46 9.71 428 2.22 dense (e) 923 364,749 46.71 18.22 246 3.75 dense (f) 1,150 215,090 58.19 15.44 239 3.40
Table 4: Drop assessment over cards used in a real crop.
3.1. Control-card experiments
We use the control card provided by the Agrotechnical Advisory of German enterprise Hoechst. The card holds synthetic drops with sizes 50µm, 100µm, 250µm, 500µm, and 1,000µm, as shown in Figure3. It is used to calibrate equipment and to assess the accuracy of manual and automatic measuring techniques. Since the number and sizes of drops are known, this first experiment works as a controlled validation.
To measure the drops, we used a smartphone to capture the image of the card. In Table2, we present the average diameter of the drops, the area covered by the drops given in cm2, the density given in drops per cm2, the coverage area given in percentage of the card area, and the volumetric median diameter. We do not present the volumetric median and the relative span because, as all the drops are equal, these values become not significant. From the table, we conclude that the methodology’s accuracy is in accordance with the controlled protocol; that is, the known and measured diameters match in most cases. Notice that it is not possible to achieve a perfect identification because of printing imperfections and numerical issues that inevitably arise at the micrometer scale. For example, for 1,000 µm drops, the average diameter was 1,009 µm. This first validation was necessary to test the tool’s ability in telling apart card background and drops.
Still using the control card, Table 3 compares the coverage area and the average diameter measured by DropLeaf, by tool DepositScan, and by a stereoscopic microscope (provided in the work of (Zhu et al.,2011). The results demonstrated that the stereoscopic microscope had the best performance as expected since it is a fine-detail laborious inspection. DropLeaf presented the best results after the microscope, beating the precision of DepositScan for all the drop sizes, but 500 µm; for 1,000 µm drops, the two tools had a similar performance, diverging in less than 1%. In the experiments, one can notice that the bigger the drop, the smaller the error, which ranged from 41% to less than 1%. For bigger drops, the drop identification is next to perfect. When measuring drops as small as 50 µm, a single extra pixel detected by the camera is enough to produce a big error. This problem was also observed in the work of (Zhu et al.,2011).
By analyzing the data, we concluded that the error due to the size scale is predictable. Since it varies with the drop size, it is not linear; nevertheless, it is a pattern that can be corrected with the following general equation:
In the case of our tool, we used a = 0.2192733 and b = 1.227941. These values shall vary from method to method, as we observed for DepositScan and the stereoscopic microscope.
3.2. Card experiments
In the second set of experiments, we used six cards evaluated in the work of (Cunha et al.,2012). Similar to them, we categorized the cards into three groups of two cards, which we classified as sparse, medium, and dense with respect to the density of drops, as seen in Figure4. These experiments tested the methodology’s robustness, its ability to identify drops even when they are irregular and/or they have touching borders. Table4 shows the numerical results, including the number of drops, the coverage area, the density, the coverage area, the volumetric median diameter, and the relative span. It is necessary to interpret the table along with Figure4, which presents the drops as identified by our methodology. In the figure, it is possible to inspect the four first measures visually. It is also possible to see that the right-hand side images (the tool’s results stressed with colored drops) demonstrate that the segmentation matches the expectations of a visual inspection; the drops at the left are perfectly identified on the right. Other features are also noticeable; density, for instance, raises as we visually inspect Figure4(a) through Figure4(f); the corresponding numbers in the table raise similarly. Counting the number of drops requires close attention and much time; for the less dense Figures4(a) and4(b), however, one can verify the accuracy of the counting and segmentation.
The last two measures, VMD and RS, provide parameters to understand the drops’ diameters’ distribution. For example, one can see that being denser, cards (e), and (f) had a smaller median and a larger diameters span. These measures indicate that the spraying is irregular and that it needs adjustment. Meanwhile, cards (a) and (b) are more regular, but not as dense as desired, with many blank spots. Cards (c) and (d), in turn, have more uniform spraying and more regular coverage.
4. Fractal analysis
In this section, we present early experiments related to using fractal theory to express the spraying pattern of droplets on a water-sensitive paper.
Fractal theory
Fractal geometry provides a mathematical model for complex objects found in nature. In contrast to the Euclidean geometry, the fractal dimension assumes that an object might have a non-integer dimensionality. Estimating an object’s fractal dimension is essentially related to its complexity, which can be measured in terms of how it occupies the space. For instance, the fractal dimension has been applied in texture analysis and shape measurement (Machado et al.,2013), among other applications. Although there are different methods for calculating the fractal dimension, the box-counting method is the most frequently used for measurements in various application fields – specifically, the spray-card problem is particularly adherent to the box-counting method. Its procedure is as follows:
D= 2 − lim σ→0
log N(σ)
log(1/σ) (10)
where N(σ) is the least number of boxes of length σ to completely cover the object, scaled down by a ratio of 1/σ. Given a binary image of M × M pixels, where M is a power of 2, first generate a set of box sizes σ for laying grids on the image. Subsequently, each grid becomes a box of size σ × σ, and the number of boxes N(σ) needed to cover the object is counted completely. Finally, the limit is calculated using the linear regression of the curve log 1/σ × log N(σ). The fractal dimension is computed by D= 2 − |α|, where α is the slope of the estimated line.
Spraying pattern analysis
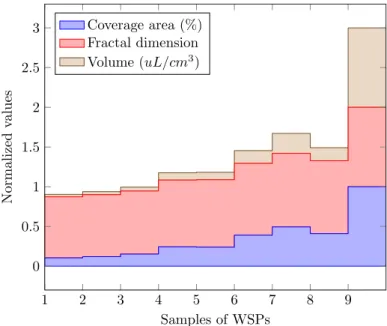
In this experiment, we analyzed images of water-sensitive paper by means of fractal dimension. Our goal was to find pieces of evidence that the space occupation of droplets on a water-sensitive paper has a straight relationship to its fractal dimensionality. In Figure5, we present experiments carried over nine different real samples. In the figure, one can see that the fractal dimension is highly correlated to quantitative spraying measures of coverage area (%) and volume (uL/m3). The conclusion is straight: the higher the fractal dimension’s value, the higher the coverage area, and the volume of sprayed pesticide. This early conclusion allows us to speculate about using the fractal dimension as one quantitative measure to describe droplets’ regularity over the water-sensitive paper.
5. Discussion of Results
This section examines issues as when creating advances for spray card investigation. We confronted such issues during our work; here, we examine them as a further contribution to aid scientists dealing with the same or related aspects.
1 2 3 4 5 6 7 8 9 0 0.5 1 1.5 2 2.5 3 Samples of WSPs Normalized values Coverage area (%) Fractal dimension Volume (uL/cm3)
Fig. 5: The plot of nine samples of water-sensitive paper. One can observe the correlation among measures of coverage area, volume, and fractal dimension. The x-axis corresponds to the number of the sample; the y-axis corresponds to the normalized output of values of the three measures.
5.1. Coverage factor
After our experiments, we observed that when the spraying gets excessively thick, it is not possible to properly detect the drops, regardless of which system is utilized for estimation; data about the number of drops, and their diameter distribution, cannot be cast any longer. This impact was brought up byFox et al.(2003), who claims that an absolute coverage of the card above 20% leads to questionable results; and a coverage near 70% is unfeasible.
This is due to the fact that, with an excessive amount of spraying, the drops fall excessively close, causing overlaps; visually, it is like two or more drops become one. This phenomenon occurs because of the water drops’ intermolecular attractions, which makes them combine, shaping greater drops.
As a result, caution is required, regardless of which procedure of assessment, whenever the absolute coverage region sums up over 20%, a situation when the measurements lose accuracy, and one can depend only on the coverage area for basic decision making. Despite the fact that the diameter is not measurable, the enormous drops that may be observed demonstrate an intemperate measure of pesticide and/or a malfunctioning of the spray device.
5.2. Angle of image capture
We likewise observed that, for all the research done so far, including ours, the image processing technique used to identify the drops works only if the card photo’s capture angle is 90 degrees. That is, the viewing angle of the camera/scanner must be orthogonal to the spray card surface. This is important in light of the fact that the pixels of the picture are converted into real-world dimensions to express the diameter of the drops in µm; that is, the components of the picture must be homogeneous concerning scale. In the event that the capture angle is not proper, the picture becomes misshaped, producing different scales in each region of the picture. For flatbed scanners, this is direct to ensure; notwithstanding, for handheld gadgets (cameras and cell phones), extra care is required. In such cases, one may require a special protocol to capture the image, such as utilizing a tripod. This issue may likewise be solved by methods of image processing, which demand extra research and experimentation.
5.3. Minimum dots per inch (dpi)
Our trials also showed that there must be a minimum amount of data on the spray card pictures to accomplish the ideal accuracy with respect to the drops’ diameters. This minimum is expressed by the dots per inch (dpi) property of the imaging process; dpi is a well-known resolution measure that communicates how many pixels are required to represent one inch in the real-world, as for example, when hardcopy printing. If insufficient pixels are caught per inch of the spray card, it winds up difficult to estimate the tiniest drops’ width. This may impact the diameter distribution analysis concealing issues in the spraying procedure.
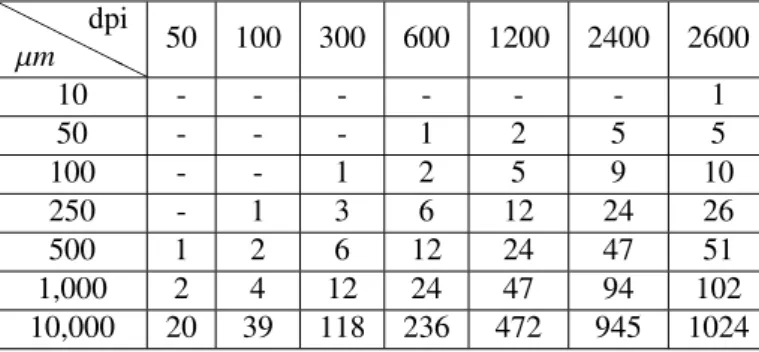
To refine our conclusions, we experimented on the minimum dpi that is fundamental for each drop diameter. In Table5, one can see the minimum number of pixels to express each drop diameter for each dpi value; see that a few cells of the table are vacant (loaded up with a hyphen) showing that the diameter cannot be computationally represented in that dpi resolution. Likewise, see that, in the columns, the number of pixels for one same diameter increments with the resolution. Clearly, the more data, the more accuracy at the expense of more processing power, considerable more storage, and more system transmission demands when
transferring pictures. From the table, it is conceivable to reason that 600 dpi is the minimum resolution for robust analyses, since it can represent diameters as small as 50 µm; meanwhile, a resolution of 1,200 dpi, albeit more robust, might prompt downsides with respect to the administration of image files that are too huge. In any case, even if a resolution is sufficient to represent a given diameter, it is not assured that drops with that diameter will be detected; this comes from the fact that the image detection relies upon different factors, for example, the nature of the focal points, and the image processing algorithm.
Table5 is a guide for developers willing to computationally analyze spray cards, and furthermore for agronomists who are choosing which hardware to purchase in the face of their needs.
H H H H H µm dpi 50 100 300 600 1200 2400 2600 10 - - - 1 50 - - - 1 2 5 5 100 - - 1 2 5 9 10 250 - 1 3 6 12 24 26 500 1 2 6 12 24 47 51 1,000 2 4 12 24 47 94 102 10,000 20 39 118 236 472 945 1024
Table 5: Pixels needed to represent a given length, given a dpi.
6. Conclusions
We presented DropLeaf, a portable application to quantify pesticide spray coverage via image processing of water-sensitive spray cards. We demonstrated that the accuracy of DropLeaf was sufficient to permit the utilization of mobile phones as substitutes for costly and cumbersome equipment. The approach was instantiated in a freely-accessible tool to be utilized in the assessment of real-world crops –https://play.google.com/store/apps/details?id=upvision.dropleaf. We experimented with the tool with two datasets of water-sensitive papers; our investigations exhibited that DropLeaf track drops with high precision, producing standard metrics for quantifying the pesticide coverage. Moreover, our portable application identifies overlapping drops, a significant improvement with respect to former methods because, by providing a finer precision, the tool produces better accuracy and more information. DropLeaf can be used in a range of farming applications, including the evaluation of emerging innovations of agricultural sprayers based on Unmanned Aerial Vehicles.
Acknowledgements
The authors are thankful to Dr. Claudia Carvalho, who kindly provided annotated cards. This work was partially supported by the Coordenac¸˜ao de Aperfeic¸oamento de Pessoal de N´ıvel Superior – Brazil (CAPES) – Finance Code 001, through grant 167967/2017-7; Fundac¸˜ao de Amparo `a Pesquisa do Estado de S˜ao Paulo (FAPESP), through grants 2014/25337-0, 2016/17078-0, 2017/08376-0, 2018/17620-5, 2019/04461-9, 2020/07200-9, and CEPID CeMEAI grant 2013/07375-0); Conselho Nacional de Desenvolvimento Cient´ıfico e Tecnol´ogico (CNPq) through grants 406550/2018-2, 305580/2017-5, and 05580/2017-5.
References References
Berenstein, R., Edan, Y., 2018. Automatic adjustable spraying device for site-specific agricultural application. IEEE Transactions on Automation Science and Engineering 15, 641–650.
Boina, D., Salyani, M., Tiwari, S., Pelz-Stelinski, K., Stelinski, L., November 2012. Spray droplet size affects efficacy of fen-propathrin against asian citrus psyllid. In: Bernards, M. (Ed.), Pesticide Formulations and Delivery Systems: Innovating Legacy Products for New Uses. ASTM International, Tampa, Florida, USA, pp. 1–13.
Bon, H., Huat, J., Parrot, L., Sinzogan, A., Martin, T., Malezieux, E., Vayssieres, J.-F., 2014. Pesticide risks from fruit and vegetable pest management by small farmers in sub-saharan africa. a review. Agronomy for Sustainable Development 34 (4), 723–736. Chaim, A., Maia, A. H. N., Pessoa, M. C. A. A. P. Y., 1999. Estimates of pesticide deposition by droplet size analysis. Pesquisa
Agropecu´aria Brasileira 34, 962–969.
URLhttp://www.scielo.br/scielo.php?script=sci_arttext&pid=S0100-204X1999000600006&nrm=iso
Cooper, J., Dobson, H., 2007. The benefits of pesticides to mankind and the environment. Crop Protection 26 (9), 1337 – 1348. URLhttp://www.sciencedirect.com/science/article/pii/S026121940700097X
Crowe, T. G., Downey, D., Giles, D. K., 2005. Digital device and technique for sensing distribution of spray deposition. Transactions of the ASABE - American Society of Agricultural and Biological Engineers 48 (6), 2085–2093.
URLhttp://elibrary.asabe.org/abstract.asp?aid=20085&t=3
Cunha, M., Carvalho, C., Marcal, A. R., 2012. Assessing the ability of image processing software to analyse spray quality on water-sensitive papers used as artificial targets. Biosystems Engineering 111 (1), 11–23.
URLhttp://www.sciencedirect.com/science/article/pii/S1537511011001772
Dougoud, J., Toepfer, S., Bateman, M., Jenner, W. H., Jun 2019. Efficacy of homemade botanical insecticides based on traditional knowledge. a review. Agronomy for Sustainable Development 39 (4), 37.
URLhttps://doi.org/10.1007/s13593-019-0583-1
Farha, W., Abd El-Aty, A. M., Rahman, M. M., Jeong, J. H., Shin, H.-C., Wang, J., Shin, S. S., Shim, J.-H., 2018. Analyti-cal approach, dissipation pattern and risk assessment of pesticide residue in green leafy vegetables: A comprehensive review. Biomedical Chromatography 32 (1), 4134–4141.
URLhttps://onlinelibrary.wiley.com/doi/abs/10.1002/bmc.4134
Ferguson, J. C., Chechetto, R. G., O’Donnell, C. C., Fritz, B. K., Hoffmann, W. C., Coleman, C. E., Chauhan, B. S., Adkins, S. W., Kruger, G. R., Hewitt, A. J., 2016. Assessing a novel smartphone application - snapcard, compared to five imaging systems to quantify droplet deposition on artificial collectors. Computers and Electronics in Agriculture 128, 193–198.
URLhttp://www.sciencedirect.com/science/article/pii/S016816991630182X
Food, Organization, A., 2009. Feeding the world in 2050. Tech. rep., United Nations, world agricultural summit on food security. Fox, R., Derksen, R., Cooper, J., Krause, C., Ozkan, H., 2003. Visual and image system measurement of spray deposits using water
sensitive paper. Applied Engineering In Agriculture 19 (5), 549–552.
Gaetano, R., Masi, G., Scarpa, G., Poggi, G., 2012. A marker-controlled watershed segmentation: Edge, mark and fill. In: Geo-science and Remote Sensing Symposium (IGARSS), 2012 IEEE International. IEEE, pp. 4315–4318.
Gargari, H. P., Teimourlou, R. F., Valizadeh, M., 2019. Spray droplet characterization using a piezoelectric sensor through classifi-cation based on machine learning. Agriculture Engineering 59 (3), 151–160.
Giles, D., Crowe, T., October 2007. Real-time electronic spray deposition sensor. US Patent 7,280,047. URLhttp://www.google.com.br/patents/US7280047
Giles, D. K., Downey, D., 2003. Quality control verification and mapping for chemical application. Precision Agriculture 4 (1), 103–124.
Giovanni Maria, F., Daniele, R., Valeria, T., Mirko, G., Sebastiano, B., 2015. Representing scenes for real–time context classifica-tion on mobile devices. Pattern Recogniclassifica-tion 48 (4), 1086–1100.
Gonzalez, R. C., Woods, R. E., 2007. Image processing. Digital image processing 2.
Gonzalez-Rodriguez, R. M., Rial-Otero, R., Cancho-Grande, B., Simal-Gandara, J., 2008. Determination of 23 pesticide residues in leafy vegetables using gas chromatography and ion trap mass spectrometry and analyte protectants. Journal of Chromatography A 1196-1197, 100–109.
URLhttp://www.sciencedirect.com/science/article/pii/S0021967308004056
Kesterson, M. A., Luck, J. D., Sama, M. P., 2015. Development and preliminary evaluation of a spray deposition sensing system for improving pesticide application. Sensors 15 (12), 31965–31972.
URLhttp://www.mdpi.com/1424-8220/15/12/29898
Liu, Y., Pan, X., Li, J., 2015. A 1961–2010 record of fertilizer use, pesticide application and cereal yields: a review. Agronomy for Sustainable Development 35 (1), 83–93.
Machado, B. B., Casanova, D., Gonc¸alves, W. N., Bruno, O. M., Feb 2013. Partial differential equations and fractal analysis to plant leaf identification. Journal of Physics: Conference Series 410, 012066.
URLhttps://doi.org/10.1088%2F1742-6596%2F410%2F1%2F012066
Machado, B. B., Orue, J. P. M., Arruda, M. S., Santos, C. V., Sarath, D. S., Goncalves, W. N., Silva, G. G., Pistori, H., Roel, A. R., Rodrigues-Jr, J. F., 2016. Bioleaf: A professional mobile application to measure foliar damage caused by insect herbivory. Computers and Electronics in Agriculture 129, 44–55.
URLhttp://www.sciencedirect.com/science/article/pii/S0168169916307670
Machado, B. B., Spadon, G., Arruda, M. S., Goncalves, W. N., Carvalho, A. C. P. L. F., Rodrigues-Jr, J. F., 2018. A smartphone application to measure the quality of pest control spraying machines via image analysis. In: Proceedings of the 33rd Annual ACM Symposium on Applied Computing. SAC ’18. ACM, New York, NY, USA, pp. 956–963.
URLhttp://doi.acm.org/10.1145/3167132.3167237
Marcal, A. R. S., Cunha, M., 2008. Image processing of artificial targets for automatic evaluation of spray quality. Transactions of the ASABE 51 (3), 811–821.
URLhttp://asae.frymulti.com/toc.asp
Martini, X., Kincy, N., Nansen, C., 2012. Quantitative impact assessment of spray coverage and pest behavior on contact pesticide performance. Pest Management Science 68 (11), 1471–1477.
of Agriculture, Forest Service, tech. Rep. NE-147.
Nansen, C., Ferguson, J. C., Moore, J., Groves, L., Emery, R., Garel, N., Hewitt, A., 2015. Optimizing pesticide spray coverage using a novel web and smartphone tool, snapcard. Agronomy for Sustainable Development 35 (3), 1075–1085.
URLhttp://dx.doi.org/10.1007/s13593-015-0309-y
Nuyttens, D., De Schampheleire, M., Verboven, P., Brusselman, E., Dekeyser, D., 2009. Droplet size and velocity characteristics of agricultural sprays. Transactions of the ASABE 52 (5), 1471–1480.
Popp, J., Peto, K., Nagy, J., 2013. Pesticide productivity and food security. a review. Agronomy for Sustainable Development 33 (1), 243–255.
Preftakes, C. J., Schleier, Jerome J, r., Kruger, G. R., Weaver, D. K., Peterson, R. K. D., 2019. Effect of insecticide formulation and adjuvant combination on agricultural spray drift. PeerJ 7, 7136–7156.
URLhttps://pubmed.ncbi.nlm.nih.gov/31249737
R.E., W., 2003. Assessing the ability of dropletscan to analyze spray droplets from a ground operated sprayer. Applied Engineering In Agriculture 19, 525–530.
Renton, M., Busi, R., Neve, P., Thornby, D., Vila-Aiub, M., 2014. Herbicide resistance modelling: past, present and future. Pest Management Science 70 (9), 1394–1404.
Stainier, C., Destain, M.-F., Schiffers, B., Lebeau, F., 2006. Droplet size spectra and drift effect of two phenmedipham formulations and four adjuvants mixtures. Crop Protection 25 (12), 1238–1243.
URLhttp://www.sciencedirect.com/science/article/pii/S0261219406000627
Teske, M. E., Thistle, H. W., Hewitt, A. J., Kirk, I. W., 2002. Conversion of droplet size distributions from pms optical array probe to malvern laser diffraction. Atomization and Sprays 12 (1-3), 267–281.
Vincent, L., Soille, P., 1991. Watersheds in digital spaces: an efficient algorithm based on immersion simulations. IEEE transactions on pattern analysis and machine intelligence 13 (6), 583–598.
Wang, L., Yue, X., Liu, Y., Wang, J., Wang, H., 2019a. An intelligent vision based sensing approach for spraying droplets deposition detection. Sensors 19 (4).
URLhttps://www.mdpi.com/1424-8220/19/4/933
Wang, P., Yu, W., Ou, M., Gong, C., Jia, W., 2019b. Monitoring of the pesticide droplet deposition with a novel capacitance sensor. Sensors 19 (3).
URLhttps://www.mdpi.com/1424-8220/19/3/537
Watkins, C. J., Dayan, P., 1992. Q-learning. Machine learning 8 (3-4), 279–292.
W.C., H., A.J., H., 2005. Comparison of three imaging systems for water-sensitive papers. Applied Engineering In Agriculture 21, 961–964.
Witton, J. T., Pickering, M. D., Alvarez, T., Reed, M., Weyman, G., Hodson, M. E., Ashauer, R., 2018. Quantifying pesticide deposits and spray patterns at micro-scales on apple (malus domesticus) leaves with a view to arthropod exposure. Pest Manage-ment Science 74 (12), 2884–2893.
URLhttps://onlinelibrary.wiley.com/doi/abs/10.1002/ps.5136
Xia, F., Hsu, C.-H., Liu, X., Liu, H., Ding, F., Zhang, W., 2015. The power of smartphones. Multimedia Systems 21 (1), 87–101. URLhttp://dx.doi.org/10.1007/s00530-013-0337-x
Zhu, H., Salyani, M., Fox, R. D., 2011. A portable scanning system for evaluation of spray deposit distribution. Computer and Electronics in Agriculture 76 (1), 38–43.