Research Article
Cell specific differences between human adipose-derived and
mesenchymal
–stromal cells despite similar
differentiation potentials
Danièle Noël
a,b,1, David Caton
c,1, Stéphane Roche
d, Claire Bony
a,b, Sylvain Lehmann
d,
Louis Casteilla
c, Christian Jorgensen
a,b, Béatrice Cousin
c,⁎
aInserm U844, Montpellier, F-34091 France
bUniversité MONTPELLIER1, UFR de Médecine, Montpellier, F-34000 France c
UMR5241 CNRS UPS, Toulouse, France dCNRS UPR1142, Montpellier, France
A R T I C L E I N F O R M A T I O N A B S T R A C T Article Chronology:
Received 22 October 2007 Revised version received 17 December 2007
Accepted 19 December 2007
Stromal cells from bone marrow and adipose tissue are attractive sources of adult progenitors for cell-based therapy. However, whether those cell populations represent intrinsically different cell types is still largely under debate. The aim of this study was to systematically and quantitatively compare adipose-derived stromal cells (ADSC) and bone marrow-derived multipotent mesenchymal–stromal cells (BM-MSC). The quantitative comparison was realized using Taqman Low Density Array, 2D electrophoresis and differentiation functional assays in vitro. Furthermore, cells engineered to express TGFβ1 were injected into the intra-articular space of mouse knee joints in order to determine whether they were able to form new differentiated tissues in vivo. Our data revealed cell specific differences at transcriptional and proteomic levels between both cell types according to their tissue origin as well as functional differences in their differentiation processes towards adipogenic, osteogenic and chondrogenic programs. Nevertheless, in vitro as well as in vivo ADSC displayed the same ability than MSC to differentiate towards chondrocytes/osteoblasts, comforting the status of both cell sources as promising regenerative cells. In summary, our observations indicate that ADSC and MSC are fundamentally different cell types and differently committed cells.
© 2008 Elsevier Inc. All rights reserved. Keywords: Adipose tissue Bone Marrow Transcript pattern Proteomic pattern Mesenchymal lineage differentiation
Introduction
Adipose tissue appears as a suitable reservoir of regenerative cells as this adult tissue is abundant and easy to sample with no ethic limitation. Recent works from independent groups state that adipose tissue hosts cells able to display various
differentia-tion potentials in vitro and in vivo[1–4]. Such cells can be isolated from the stroma vascular fraction (SVF) obtained after adipose tissue digestion that may be used either freshly prepared or after sub-culture[2,4–7]. In this last case, cultured cells represent a particular cell subpopulation, restricted to the adherent cell fraction of SVF, termed ADSC (adipose-derived stromal cells). E X P E R I M E N T A L C E L L R E S E A R C H X X ( 2 0 0 8 ) X X X – X X X
YEXCR-07699; No. of pages: 10; 4C: 3, 4, 5, 6, 7
⁎ Corresponding author. IFR31, Institut Louis Bugnard, UMR 5241 CNRS UPS, BP 84225, 31432 Toulouse Cedex 4, France. Tel.: +33 5 61 32 34 98; fax: +33 5 62 17 09 05.
E-mail address:[email protected](B. Cousin). 1These authors contributed equally to the work.
0014-4827/$– see front matter © 2008 Elsevier Inc. All rights reserved. doi:10.1016/j.yexcr.2007.12.022
a v a i l a b l e a t w w w. s c i e n c e d i r e c t . c o m
w w w. e l s e v i e r. c o m / l o c a t e / y e x c r
ADSC are often called adipose-derived mesenchymal stem cells (MSC), as MSC represent an archetype of adult stem cells. MSC are classically isolated from bone marrow (BM) aspirates and are identified as a multipotent cell population in the adult organism able to be induced to express adipogenic, osteogenic and chondrogenic markers[8–11]and especially studied in the context of bone/cartilage regeneration in vivo [12–14]. Although stromal cells from BM and adipose tissue seem to be closely related, notable differences were reported[6,15–19], but no systematic and extensive parallel comparison between these cells has yet been performed. According to the large perspective opened by the easy access to an abundant source of regenerative cells, such study seems requested.
The objective of this study was to realize such comparison on the biological characteristics of ADSC and MSC both in vitro and in vivo. Indeed, two dimensional gel electrophoresis and real-time PCR based Taqman Low Density Array (TLDA) cov-ering differentiation, stemness and signalling pathways, were used to establish, respectively, a proteomic and transcriptional profile of both cell populations. In addition, we analysed their phenotype as well as their differentiation potential in vitro. In vivo, cells were injected into the intra-articular space of mouse knee joints to determine their capacity to differentiate in an in vivo cartilaginous environment.
Materials and methods
Cell culture
The SVF was isolated from human adipose tissue as previously described [4]. Human subcutaneous fat was obtained from healthy patients undergoing abdominal dermolipectomy in the department of Plastic Surgery of Toulouse Rangueil Hospital (Toulouse, France). The patients were between 20 and 50 years old and their BMI never over 30. SVF cells were plated overnight in DMEM-F12 (1:1) medium supplemented with 10% FBS, 100μg/ml pantothenic acid, 100μM ascorbic acid, 16 μM biotin, 250 μg/ml amphotericin, 5μg/ml streptomycin and 5 U/ml penicillin (Sigma Aldrich, St. Quentin Fallavier, France). Adherent ADSC growth was pursued until cells reached 75% confluence (passage 0) and used thereafter or at passage 1. Each experiment was reproduced 3 to 5 times with independent ADSC cultures.
MSC cultures were established from four BM aspirates of healthy age-matched donors. Mononuclear cells were plated at the density of 5 × 10⁴cells/cm2 in α-MEM, supplemented with 10% FBS, 1 ng/ml basic fibroblast growth factor, 100 U/ml penicillin and 100 μg/ml streptomycin. At sub-confluence, cells were detached with trypsin and plated at the density of 1000 cells/cm2to be used at passages 2–4.
Cell phenotyping
Isolated cells were analysed by flow cytometry using standard protocols[4]. Cells were incubated with FITC, PE and APC-con-jugated primary antibodies from BD Biosciences (Le Pont de Claix, France). Cells were then analysed on a fluorescence-activated cell sorter (FACS Calibur, BD, Le Pont de Claix, France). Data acquisition and analysis were performed using the Cell Quest software (BD).
Whole cell extract and 2D electrophoresis
Cells were washed twice with PBS containing a cocktail of protease inhibitors (Sigma Aldrich) and lysed with 200μl of lysing buffer (8 M urea, 2 M thiourea, 4% CHAPS, 50 mM dithiothreitol (DTT)). For the first dimension, 30μg of proteins were added to 250μl of rehydratation buffer (9.8 M urea, 4% zwitterionic detergent CHAPS, 50 mM DTT and 0.5% IPG buffer
[3–10]. IPG strips covering a pH range of 3–10 were used. For focalisation, the following voltage/time profile was used: 200 V for 1 h, 1000 V for 1 h, 3000 V for 1 h, a gradient between 3000 V and 8000 V during 2 h and 8000 V for 5 h. For the second dimension, focused strips were equilibrated in 6 M urea, 30% glycerol, 2% SDS, 50 mM Tris pH 8.8, 1% DTT for 30 min and then for an additional 30 min in the same solution except that DTT was replaced by 5% iodoacetamide. After equilibration, pro-teins were separated by an SDS-PAGE method using 12% acryl-amide gel with a ratio of acrylacryl-amide/bisacrylacryl-amide of 37.5/1. Silver staining and protein identification
Gels were stained with a silver nitrate procedure [20] and scanned at 300 dots per inch using the Labscan 3 software (GE Healthcare) after a procedure of calibration using the kaleido-scope LaserSoft Imaging (Kodak, France). Spot detection and quantification were performed with ImageMaster 2D Platinum software (GE Healthcare). The spot detection was performed using 4 as smooth parameter, 10 as minimum area and 75 as cut-off saliency. To take into account experimental variations, gels were normalized to the volume of all spots detected on the 2D gel.
Using ImageMaster Platinium 5, quantification was per-formed by an integration of grey level of each spot and nor-malisation with total spot volume. Three to 5 replicates with independent samples were performed to ensure reproduci-bility of the results. Each gel was matched with others using at least 10 landmarks per pair and a minimal percentage of 70% of matches was obtained between each pair. Reference gel was defined as a MSC gel.
Real-time RT-PCR and analysis of gene expression
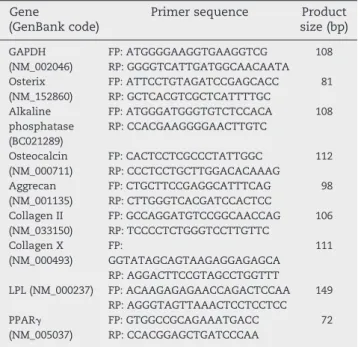
Total RNA was extracted using the RNeasy mini kit (Qiagen S. A., Courtaboeuf, France) and reverse transcribed using Multi-scribe reverse transcriptase (Applied Biosystems, Courtaboeuf, France). The amplification was performed using the primer sets (Table 1) and the TaqMan Universal Master Mix.
TaqMan low density arrays
The 384 wells of each card were preloaded with fluorogenic probes and primers carefully selected from predesigned Taq-Man Low Density Arrays (Applied Biosystems). First strand cDNA was synthesized from 1 μg total RNA using the High Capacity cDNA Archive Kit (Applied Biosystems). cDNAs were loaded on the microfluidic cards for thermal cycling on an ABI Prism 7900 HT Sequence Detection System (Applied Biosys-tems). Expression values for target genes were normalized to the expression of GRCC10. The geNorm and Global Pattern rec-ognition and, the Cluster and TreeView hierarchical clustering
2
E X P E R I M E N T A L C E L L R E S E A R C H X X ( 2 0 0 8 ) X X X – X X XARTICLE IN PRESS
softwares were used. Two filters have been used: one filter aimed at retaining only genes expressed above the median value, and the second filter retained genes for which the difference between the maximum and minimum values was twice the median value.
In vitro adipogenesis assay
For adipogenic differentiation, cells were plated at the density of 4–8×10⁴
cells/cm2. Adipogenic differentiation was induced in DMEM:F12 supplemented with 10% FBS, 1μM dexametha-sone, 0.5 mM isobutyl-methylxanthine and 60μM indometha-cin for 3 days. Medium was changed every 2 days and replaced with DMEM:F12 supplemented with 10% FBS. Adipocytes were characterized by oil red O staining. Differentiation was quantified by real-time RT-PCR using specific primers. In vitro osteogenesis assay
1.5× 10⁴ cells/cm2 were cultured in osteogenic differentiation medium consisting in DMEM (high glucose) with 10% FBS, 0.1μM dexamethasone, 3 mM NaH2PO4 and 50 μg/ml ascorbic acid. Osteoblasts were characterized by Von Kossa staining for se-creted calcified extracellular matrix detection. Osteogenic differ-entiation was quantified by RT-PCR gene expression analysis. In vitro chondrogenesis assay
Chondrogenic differentiation was induced by culture of cells in micropellets at the density of 2.5 × 10⁵cells/500μl in DMEM supplemented with 0.1μM dexamethasone, 0.17 mM ascor-bate-2 phosphate, 1% insulin-transferrin-sodium selenite
supplement and 100 ng/ml of recombinant bone morphoge-netic protein 2 (BMP2) from AbCys (Paris, France). After 3 weeks, the samples were used for RT-PCR gene expression analysis and histological staining with 0.1% Safranin O. Adenoviral infection and in vivo differentiation assays For cell transduction, cells were plated at 106cells in 160 mm dishes and infected with a TGFβ1-expressing adenoviral vector, kindly provided by Bruce Beutler (La Jolla, CA, USA), at the multiplicity of infection of 100 in 15 ml of serum free RPMI medium overnight. An adenovirus expressingβ-galactosidase
Table 1– List of primers used for RT-PCR
Gene
(GenBank code)
Primer sequence Product size (bp) GAPDH (NM_002046) FP: ATGGGGAAGGTGAAGGTCG 108 RP: GGGGTCATTGATGGCAACAATA Osterix (NM_152860) FP: ATTCCTGTAGATCCGAGCACC 81 RP: GCTCACGTCGCTCATTTTGC Alkaline phosphatase (BC021289) FP: ATGGGATGGGTGTCTCCACA 108 RP: CCACGAAGGGGAACTTGTC Osteocalcin (NM_000711) FP: CACTCCTCGCCCTATTGGC 112 RP: CCCTCCTGCTTGGACACAAAG Aggrecan (NM_001135) FP: CTGCTTCCGAGGCATTTCAG 98 RP: CTTGGGTCACGATCCACTCC Collagen II (NM_033150) FP: GCCAGGATGTCCGGCAACCAG 106 RP: TCCCCTCTGGGTCCTTGTTC Collagen X (NM_000493) FP: GGTATAGCAGTAAGAGGAGAGCA 111 RP: AGGACTTCCGTAGCCTGGTTT LPL (NM_000237) FP: ACAAGAGAGAACCAGACTCCAA 149 RP: AGGGTAGTTAAACTCCTCCTCC PPARγ (NM_005037) FP: GTGGCCGCAGAAATGACC 72 RP: CCACGGAGCTGATCCCAA
Analysis of gene expression was performed using the ABI Prism 7900 Sequence Detection System software (Applied Biosystems). Content of cDNA samples was normalized and expression of each specific gene was calculated using the formulae 2− (ΔCt)and was compared to the value obtained for MSC at J0.
Fig. 1 – Immunophenotype of ADSC (left) and MSC (right). Both cell types (ADSC, P0; BM-MSC, P4) were stained with antibodies against the indicated antigens, and analysed by flow cytometry. Representative histograms are shown as red line and the respective isotype controls are shown as black line.
3
E X P E R I M E N T A L C E L L R E S E A R C H X X ( 2 0 0 8 ) X X X – X X X
ARTICLE IN PRESS
enzyme under the control of CMV promoter was also used as a control[21]. The following day, cells were used for injection. CB17-severe combined immunodeficient (SCID)/bg mice were purchased from Harlan (Gannat, France) and cared for accord-ing to the Laboratory Animal Care guidelines. For intra-articular injections, mice were anaesthetized and the cell suspensions (5 × 10⁵cells in 5μl of PBS) were delivered into the joint cavity using a 10μl syringe. No injury was performed in this area prior to the injection. At least five mice were included per group of treatment. Knees were dissected from euthanized mice at day 21 and processed for histology.
Histology and immunohistochemistry
Knee tissues were fixed in 4% formaldehyde solution and decalcified in acid-based DC3 solution (Labonord; Temple-mars, France) for 24 h. The tissues were then embedded in paraffin and sectioned at 5μm. Sections were deparaffinized and hydrated before antigen unmasking in a citrate buffer bath at 97 °C for 40 min. The mAb Ab-2 specific for human mitochondrial protein, the anti-aggrecan and the anti-type II collagen mAb, used at the 1:50 dilution, were from Interchim (Montluçon, France). Sections were stained using the AEC kit (DAKO) and counterstained with haematoxylin.
Statistical analysis
Statistics were performed using the Student's 2-tailed t-test with unequal variances. Transcriptomic and proteomic
sta-tistical analyses were performed by Hierarchical Clustering Explorer 3.0 software[22]with an average linkage hierarchical clustering algorithm, using the centred Pearson correlation coefficient as the similarity metric.
Results and discussion
Phenotypic characterization of ADSC and MSC
After isolation, both MSC and ADSC exhibited fibroblast-like cell morphology. Both cells were positive for known mesenchymal markers such as CD73 and CD90 and negative for the haemato-poietic marker CD45 (Fig. 1). As previously described[4,5,9,23,24]
CD44 and CD105 were also expressed by both cell types, while CD31 was not detected (data not shown). MSC expressed CD106 (VCAM1), an adhesion molecule found on vascular cells that mediates the binding of haematopoietic progenitors on MSC[25], and did not express CD34 usually detected on haematopoietic progenitors[26]and endothelial cells. By contrast, ADSC were CD34 positive and CD106 negative (Fig. 1). Although we show that CD34 and CD106 are differentially expressed at the surface of both cell types as previously reported[24], CD34 was previously reported to be absent on ADSC and CD106 to be expressed in 30% of ADSC[27]. This discrepancy may be due to cell culture since ADSC between passages 2 and 5 were used by Kern et al.[27], and CD34 expression decreases with passages[28].
Altogether, the panel of surface markers tested revealed a close but distinct phenotypic profile between the two
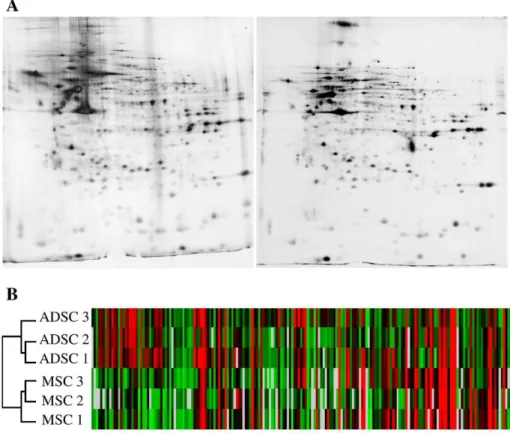
Fig. 2– Differential proteomic analysis of MSC and ADSC. A) 2D gel electrophoresis was performed using whole cell protein extracts from ADSC (left panel) and MSC (right panel). B) Comparison of ADSC and MSC using Hierarchical Clustering Software and Pearson Test. Red: expression above the median; Green: expression below the median; Black: median expression across all samples.
4
E X P E R I M E N T A L C E L L R E S E A R C H X X ( 2 0 0 8 ) X X X – X X XARTICLE IN PRESS
cell types, as already described by other groups[2,3,5,8,17, 24,27].
Proteomic and genomic characterizations of ADSC and MSC Proteomic analysis allowed the detection of several protein spots (Supplementary table 1). However, a number of proteins (23%) were expressed specifically in one or the other cell type (Fig. 2A) and 18% of detected spots were found to be differentially expressed between ADSC and MSC. Using the Pearson statistical test, we found that the correlation factor, that represents a statistical analysis of the general expression profile, was around 0.9 between ADSC and MSC. This indicates a good correlation between detected proteins in whole extracts of both cell types (Supplementary table 2). On the other side, the Hierarchical Clustering method allowed to define two different clusters that discriminate ADSC and MSC (Fig. 2B). Thus, despite a general similar proteomic profile between ADSC and MSC, independent samples of ADSC were more related together rather than to MSC.
To confirm these data, genomic analysis was conducted by using Taqman Low Density Array (TLDA). The gene expression panel used was custom-made and composed of 384 different sets of primers covering differentiation pathways, stemness pathway and signaling pathway (for complete list, see[29]). The primers plotted on the TLDA focused on receptors, growth and transcription factors. Such factors are usually localized in
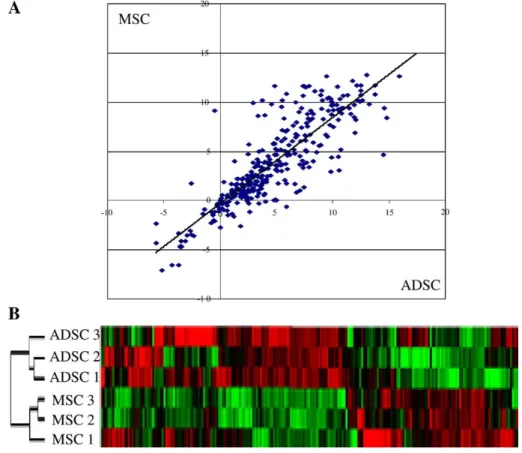
nucleus and/or in membrane compartments that are poorly revealed by 2D electrophoresis approach. On the other side, the protein isolation methods focused on the highly expressed proteins, representing the cellular machinery. Thus, taken together, the proteomic and transcriptomic analyses are most complementary rather than redundant. The expression levels of ADSC transcripts were plotted against the levels of MSC transcripts and a correlation coefficient around 0.7 was found (Fig. 3A and Supplementary table 3). Despite the great similarity between both cells, each sample was clustered with the other samples from the same tissue (Fig. 3B). Most of the genes were highly expressed in ADSC and MSC (13.4% of analyzed genes) and were related to cell adhesion molecules such as collagens, SPARC and fibronectin. Similarly, most of the silent genes were absent in both cell types, representing 8.4% of the analyzed genes (Supplementary table 4). Never-theless, 3.4% of the analyzed genes were found to be specif-ically expressed only by one population. Genes expressed only in ADSC are mostly involved in cellular communication (CCL3, FGF9, IL1R2, KDR) and in transcription control (PAX3, SPI1, ZNF45) (Table 1). The genes expressed uniquely in MSC are involved in WNT signalling and differentiation pathways (WNT11, WNT7B, SOX6) (Table 1). Furthermore, 9.7% of the analyzed genes were differentially expressed between ADSC and MSC (Supplementary tables 4 and 5). Taken together this analysis indicates that the differential expression of 13.2% of genes was able to discriminate both populations without being
Fig. 3– Differential gene expression between MSC and ADSC. A) Correlation analysis between the levels of gene expression in ADSC and BM-MSC performed using Taqman Low density Array. (B) Hierarchical clustering analysis. The dendogramm visualizes the relationship between different ADSC and MSC preparations. Red: expression above the median;
Green: expression below the median; Black: median expression across all samples.
5
E X P E R I M E N T A L C E L L R E S E A R C H X X ( 2 0 0 8 ) X X X – X X X
ARTICLE IN PRESS
able to define specific markers of each cell population. It has to be noted that both in 2D electrophoresis and in TLDA analyses, independent samples of ADSC were more related together rather than to MSC. This did not exclude but lowered the pos-sibility than the variability observed in the current work reflects variation between individuals rather than between tissue depots of origin. Markers specific for chondro/osteogen-esis such as HES-1, DLX-5, TWIST1, osteocalcin, osterix, SOX9, WNT5A, TGFβ1 and VEGF were highly expressed in MSC compared to ADSC. To our knowledge, this is the first study comparing adipose- and bone marrow-derived MSC using 2D electrophoresis. One previous study comparing the proteomic profile of BM-MSC cultured under two different expansion media revealed that culture conditions exerted a prominent impact on the proteome[30]. In addition, there is a substantial body of literature examining ADSC or BM-MSC proteome (for reviews, see[31,32]). However, it is difficult to compare the different results described, or to identify a clear proteomic signature for each cell type. One of the reasons is the different paradigms, protein extraction protocols and analytical approaches were used. We also report specific differences at the transcriptomic level between ADSC and MSC. While com-mon differentiation pathways to ADSC and BM-MSC have been previously identified [33], our report is one of the first to
compare undifferentiated MSC isolated from fat and bone marrow[19,34]. In agreement with the study from Liu et al., our data revealed considerable similarities between the two cell populations with a set of genes that can discriminate both populations[33]. It will be of importance to determine whether the differences observed in our study between MSC from various origins may be ascribable to the cell passages, culture conditions or the tissue sources.
In vitro adipogenic, osteogenic and chondrogenic differentiation of ADSC and MSC
We further investigated whether the differences observed at the transcriptomic and proteomic levels between both cell types could have an impact on the extent of differentiation in vitro. Previous spared functional studies demonstrated that ADSC and MSC display the triple potentials of differentiation[5,8,35] al-though no strict and quantitative comparison was yet provided. When cultured in adipogenic medium, both ADSC and MSC displayed a positive staining of cytoplasmic lipid droplets with Oil Red O (Fig. 4A). As expected, no staining was observed in undifferentiated cells (data not shown). To quantify the differentiation capacities of both cell types, real-time RT-PCR was performed to measure the expression of genes specifically
Fig. 4 – Adipogenic, osteogenic and chondrogenic differentiations of ADSC and MSC. Oil Red O (A; × 450), Von Kossa (C; × 450) and Safranin O (E; × 100) staining of ADSC and MSC in vitro revealing respectively adipogenic, osteogenic and chondrogenic differentiations. Relative expression of adipogenic (B), osteogenic (D) and chondrogenic (F) markers in ADSC versus MSC before (d0, white bars) or after (d21, black bars) induction of differentiation, *p < 0.05 in differentiated vs undifferentiated cells, °p < 0.05 in MSC vs ADSC.
6
E X P E R I M E N T A L C E L L R E S E A R C H X X ( 2 0 0 8 ) X X X – X X XARTICLE IN PRESS
involved in adipocyte differentiation. This analysis revealed similar expression levels for the mRNA coding for PPARγ and LPL in undifferentiated cells (Fig. 4B). These RNA were sig-nificantly increased in differentiated cells indicating that the cells underwent adipogenic differentiation to a similar extent. Induction of osteogenesis in MSC and ADSC cultures resulted in the appearance of mineralised nodular structures (Fig. 4C). To quantify the extent of osteogenic differentiation, the expression of 3 different transcripts was evaluated. Both osterix and osteocalcin transcripts were significantly higher in undiffer-entiated MSC compared to undifferundiffer-entiated ADSC (Fig. 4D).
Osterix and alkaline phosphatase mRNAs were stronger up-regulated in differentiated MSC than in differentiated ADSC, in contrast to osteocalcin (Fig. 4D).
After chondrogenic induction[36], the presence of proteo-glycans was identified in both cell types (Fig. 4E) but not in non induced control cells (data not shown). The analysis of genes restricted to chondrocyte lineage (collagen type II and aggrecan) revealed a similar level of expression in undifferentiated MSC and ADSC (Fig. 4F). At day 21, a significant increase in collagen type II was detected in both cell types. Aggrecan expression was poorly induced in MSC in our culture conditions and, by
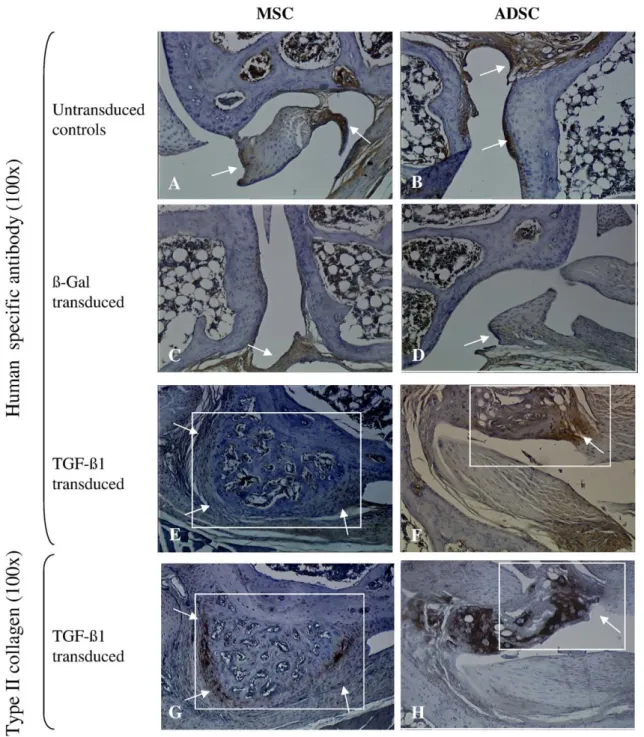
Fig. 5– In vivo differentiation of ADSC and MSC in SCID mice. Knee joints of treated animals were analysed by immunostaining. Untransduced andβgal-transduced MSC (A, C) and ADSC (B, D) formed fibrous tissue (arrows). TGF-β1-transduced
MSC (E, G) and ADSC (F, H) formed chondrophytes/osteophytes (insets) composed of chondrocytes positive for human specific antibody (E, F arrows) and collagen II (G, H arrows) (×100).
7
E X P E R I M E N T A L C E L L R E S E A R C H X X ( 2 0 0 8 ) X X X – X X X
ARTICLE IN PRESS
contrast, was completely down regulated in ADSC. Finally, collagen type X, a marker associated with hypertrophic chondrocyte, reached a similar level in both cultures (Fig. 4F).
We thus confirm that both cells can undergo the three differentiation programs but the in vitro quantitative analysis reveals clear differences. For osteogenesis, osterix and osteo-calcin expressions were always more elevated in MSC compared to ADSC, suggesting that cells isolated from BM could be more prone to osteogenic differentiation than those isolated from fat. This is consistent with a previous report[31]. The micropellet culture technique described in other studies
[37,38]and BMP-2 supplementation resulted in the condensa-tion of ADSC and MSC into three dimensional aggregates positive for safranin O. A similar expression level of collagen type II and aggrecan was found in undifferentiated cells, al-though only collagen type II was increased in micropellets obtained from both cell types. A slight increase in aggrecan expression was observed only in MSC under chondrogenic conditions, suggesting that in vitro chondrogenesis may be less efficient in ADSC compared to MSC, as already reported[18,31]. Altogether our molecular and functional investigations strongly suggest that MSC already exhibits molecular and func-tional signs of lineage commitment towards chondrogenic and osteogenic differentiation. Thus the cell lineage commitment could be due to intrinsic differences ascribable to tissue origin. With one exception[27], most of the previous studies comparing the multilineage capacity of MSC isolated from different tissues reported a higher osteogenic and chondrogenic potential of MSC isolated from BM compared with ADSC[16,31,39]. These data, which were essentially based on qualitative histological evalua-tion, are confirmed here on a quantitative basis.
In vivo chondrogenic differentiation of ADSC and MSC To go further, we investigated the behaviour of ADSC and MSC after engraftment into a physiological niche [40]). Indeed, although some studies on ADSC and MSC have focused on their ability to generate cartilage at ectopic sites (subcutaneous, intramuscular), no study has investigated their differentiation potential in the intra-articular space, where environmental factors may play a regulatory role. Because MSC do not spon-taneously differentiate after ectopic implantation [40], we genetically modified both cell types to express TGF-β1 since TGF-β1 has been shown to induce the differentiation of MSC towards bone/cartilage tissues[41,42].
Injected with untransduced orβgal-transduced cells, none of the naive or βgal expressing cells formed spontaneously cartilage or bone structures (Figs. 5A-D). In joints implanted with TGF-β1-expressing ADSC or MSC (Figs. 5E-H), the for-mation of new structures similar to chondrophytes or osteo-phytes was observed. Importantly, both TGF-β1-transduced ADSC or MSC were detected in histologically proven cartilage region and stained positive for human mitochondrial proteins (Figs. 5 E, F), and collagen II (Figs. 5 G, H), indicating the contribution of both cell types to ectopic cartilage formation. Because the quantification of these structures was difficult to measure, our data suggest that both cell types have a similar ability to form osteo/chondrogenic structures in the cartilage environment. The different behaviour of ADSC in vitro and in vivo concerning the chondrogenic differentiation may be
ascribable to environmental factors present in the knee joint. The variability between in vitro and in vivo observation may also be due to overexpression of TGFβ1 in ADSC, since in vitro the chondrogenic differentiation of adenovirally transduced cells has not been tested.
In conclusion, despite known similarities between ADSC and MSC, our observations revealed cell specific differences at the phenotypic, mRNA, proteomic and functional levels ac-cording to their tissue origin. These two cell types have thus to be considered as different even though they can be induced to differentiate towards the three mesenchymal lineages. From an absolute view, and in the perspective of cell therapy, our results favour the use of MSC for osteogenesis and chondro-genesis because it seems that these cells are pre-committed towards these lineages. Nevertheless, the easiness of fat tissue sampling and a better control of ADSC differentiation could overcome this initial disadvantage. Indeed, our results high-light the crucial need for a better identification of the molec-ular mechanisms involved in the regulation of the stemness and differentiation pathways to specifically optimize the cell specific maintenance/differentiation protocols.
Acknowledgments
Caton D. and Roche S. as well as the study are financially supported by the European Community (Key action LSH 1.2.4-3, Integrated project:“Adult mesenchymal stem cells engineering for connective tissue disorders. From the bench to the bed side”, Contract no: 503161), the Cell and Gene Therapy program from Région Midi-Pyrénées (#03011999), and the Etablissement Fran-çais du Sang.
Appendix A. Supplementary data
Supplementary data associated with this article can be found, in the online version, atdoi:10.1016/j.yexcr.2007.12.022.
R E F E R E N C E S
[1] P.A. Zuk, M. Zhu, P. Ashjian, D.A. De Ugarte, J.I. Huang, H. Mizuno, Z.C. Alfonso, J.K. Fraser, P. Benhaim, M.H. Hedrick, Human adipose tissue is a source of multipotent stem cells, Mol. Biol. Cell 13 (2002) 4279–4295.
[2] S. Gronthos, A.C. Zannettino, S.J. Hay, S. Shi, S.E. Graves, A. Kortesidis, P.J. Simmons, Molecular and cellular
characterisation of highly purified stromal stem cells derived from human bone marrow, J. Cell Sci. 116 (2003) 1827–1835. [3] M. Ryden, A. Dicker, C. Gotherstrom, G. Astrom, C. Tammik, P.
Arner, K. Le Blanc, Functional characterization of human mesenchymal stem cell-derived adipocytes, Biochem. Biophys Res. Commun. 311 (2003) 391–397.
[4] V. Planat-Benard, J.S. Silvestre, B. Cousin, M. Andre, M. Nibbelink, R. Tamarat, M. Clergue, C. Manneville, C. Saillan-Barreau, M. Duriez, A. Tedgui, B. Levy, L. Penicaud, L. Casteilla, Plasticity of human adipose lineage cells toward endothelial cells: physiological and therapeutic perspectives, Circulation 109 (2004) 656–663.
[5] P.A. Zuk, M. Zhu, H. Mizuno, J. Huang, J.W. Futrell, A.J. Katz, P. Benhaim, H.P. Lorenz, M.H. Hedrick, Multilineage cells from
8
E X P E R I M E N T A L C E L L R E S E A R C H X X ( 2 0 0 8 ) X X X – X X XARTICLE IN PRESS
human adipose tissue: implications for cell-based therapies, Tissue Eng. 7 (2001) 211–228.
[6] B. Puissant, C. Barreau, P. Bourin, C. Clavel, J. Corre, C. Bousquet, C. Taureau, B. Cousin, M. Abbal, P. Laharrague, L. Penicaud, L. Casteilla, A. Blancher, Immunomodulatory effect of human adipose tissue-derived adult stem cells:
comparison with bone marrow mesenchymal stem cells, Br. J. Haematol. 129 (2005) 118–129.
[7] J.M. Gimble, S. Zvonic, Z.E. Floyd, M. Kassem, M.E. Nuttall, Playing with bone and fat, J. Cell Biochem. 98 (2006) 251–266. [8] M.F. Pittenger, A.M. Mackay, S.C. Beck, R.K. Jaiswal, R.
Douglas, J.D. Mosca, M.A. Moorman, D.W. Simonetti, S. Craig, D.R. Marshak, Multilineage potential of adult human mesenchymal stem cells, Science 284 (1999) 143–147. [9] J.E. Dennis, P. Charbord, Origin and differentiation of human
and murine stroma, Stem Cells 20 (2002) 205–214. [10] A.I. Caplan, Review: mesenchymal stem cells: cell-based
reconstructive therapy in orthopedics, Tissue Eng. 11 (2005) 1198–1211.
[11] G.Y. Rochefort, B. Delorme, A. Lopez, O. Herault, P. Bonnet, P. Charbord, V. Eder, J. Domenech, Multipotential mesenchymal stem cells are mobilized into peripheral blood by hypoxia, Stem Cells 24 (2006) 2202–2208.
[12] G.R. Erickson, J.M. Gimble, D.M. Franklin, H.E. Rice, H. Awad, F. Guilak, Chondrogenic potential of adipose tissue-derived stromal cells in vitro and in vivo, Biochem. Biophys. Res. Commun. 290 (2002) 763–769.
[13] S. Wakitani, T. Goto, S.J. Pineda, R.G. Young, J.M. Mansour, A.I. Caplan, V.M. Goldberg, Mesenchymal cell-based repair of large, full-thickness defects of articular cartilage, J. Bone Joint Surg. Am. 76 (1994) 579–592.
[14] Y. Lin, E. Luo, X. Chen, L. Liu, J. Qiao, Z. Yan, Z. Li, W. Tang, X. Zheng, W. Tian, Molecular and cellular characterization during chondrogenic differentiation of adipose tissue-derived stromal cells in vitro and cartilage formation in vivo, J. Cell Mol. Med. 9 (2005) 929–939.
[15] G.I. Im, Y.W. Shin, LeeK.B. , Do adipose tissue-derived mesenchymal stem cells have the same osteogenic and chondrogenic potential as bone marrow-derived cells? Osteoarthr. Cartil. 13 (2005) 845–853.
[16] Y. Sakaguchi, I. Sekiya, K. Yagishita, T. Muneta, Comparison of human stem cells derived from various mesenchymal tissues: superiority of synovium as a cell source, Arthritis Rheum. 52 (2005) 2521–2529.
[17] W. Wagner, F. Wein, A. Seckinger, M. Frankhauser, U. Wirkner, U. Krause, J. Blake, C. Schwager, V. Eckstein, W. Ansorge, A.D. Ho, Comparative characteristics of
mesenchymal stem cells from human bone marrow, adipose tissue, and umbilical cord blood, Exp. Hematol. 33 (2005) 1402–1416.
[18] T. Hennig, H. Lorenz, A. Thiel, K. Goetzke, A. Dickhut, F. Geiger, W. Richter, Reduced chondrogenic potential of adipose tissue derived stromal cells correlates with an altered TGFbeta receptor and BMP profile and is overcome by BMP-6, J. Cell Physiol. 211 (2007) 682–691.
[19] B.T. Estes, A.W. Wu, F. Guilak, Potent induction of
chondrocytic differentiation of human adipose-derived adult stem cells by bone morphogenetic protein 6, Arthritis Rheum. 54 (2006) 1222–1232.
[20] A. Shevchenko, M. Wilm, O. Vorm, M. Mann, Mass spectrometric sequencing of proteins silver-stained polyacrylamide gels, Anal. Chem. 68 (1996) 850–858. [21] F. Apparailly, D. Noël, V. Millet, A.H. Baker, G. Lisignoli, C.
Jacquet, M.J. Kaiser, J. Sany, C. Jorgensen, Paradoxical effects of tissue inhibitor of metalloproteinases 1 gene transfer in collagen-induced arthritis, Arthritis Rheum. 44 (2001) 1444–1454. [22] J. Seo, M. Bakay, Y.W. Chen, S. Hilmer, B. Shneiderman, E.P.
Hoffman, Interactively optimizing signal-to-noise ratios in expression profiling: project-specific algorithm selection and
detection p-value weighting in Affymetrix microarrays, Bioinformatics 20 (2004) 2534–2544.
[23] C. Jorgensen, F. Djouad, V. Fritz, F. Apparailly, P. Plence, D. Noel, Mesenchymal stem cells and rheumatoid arthritis, Jt. Bone Spine 70 (2003) 483–485.
[24] D.A. De Ugarte, Z. Alfonso, P.A. Zuk, A. Elbarbary, M. Zhu, P. Ashjian, P. Benhaim, M.H. Hedrick, J.K. Fraser, Differential expression of stem cell mobilization-associated molecules on multilineage cells from adipose tissue and bone marrow, Immunol. Lett. 89 (2003) 267–270.
[25] P.J. Simmons, B. Masinovsky, B.M. Longenecker, R. Berenson, B. Torok-Storb, W.M. Gallatin, Vascular cell adhesion molecule-1 expressed by bone marrow stromal cells mediates the binding of hematopoietic progenitor cells, Blood 80 (1992) 388–395.
[26] G.U. Gangenahalli, V.K. Singh, Y.K. Verma, P. Gupta, R.K. Sharma, R. Chandra, P.M. Luthra, Hematopoietic stem cell antigen CD34: role in adhesion or homing, Stem Cells Dev. 15 (2006) 305–313.
[27] S. Kern, H. Eichler, J. Stoeve, H. Kluter, K. Bieback,
Comparative analysis of mesenchymal stem cells from bone marrow, umbilical cord blood, or adipose tissue, Stem Cells 24 (2006) 1294–1301.
[28] J.B. Mitchell, K. McIntosh, S. Zvonic, S. Garrett, Z.E. Floyd, A. Kloster, Y. Di Halvorsen, R.W. Storms, B. Goh, G. Kilroy, X. Wu, J.M. Gimble, Immunophenotype of human adipose-derived cells: temporal changes in stromal-associated and stem cell-associated markers, Stem Cells 24 (2006) 376–385. [29] F. Djouad, B. Delorme, M. Maurice, C. Bony, F. Apparailly, P.
Louis-Plence, F. Canovas, P. Charbord, D. Noel, C. Jorgensen, Microenvironmental changes during differentiation of mesenchymal stem cells towards chondrocytes, Arthritis Res. Ther. 9 (2007) R33.
[30] W. Wagner, R.E. Feldmann Jr., A. Seckinger, M.H. Maurer, F. Wein, J. Blake, U. Krause, A. Kalenka, H.F. Burgers, R. Saffrich, P. Wuchter, W. Kuschinsky, A.D. Ho, The heterogeneity of human mesenchymal stem cell preparations—evidence from simultaneous analysis of proteomes and transcriptomes, Exp. Hematol. 34 (2006) 536–548.
[31] H.W. Park, J.S. Shin, C.W. Kim, Proteome of mesenchymal stem cells, Proteomics 7 (2007) 2881–2894.
[32] J.M. Gimble, A.J. Katz, B.A. Bunnell, Adipose derived stem cells for regenerative medicine, Circ. Res. 100 (2007) 1249–1260.
[33] T.M. Liu, M. Martina, D.W. Hutmacher, J. Hoi, P. Hui, E.H. Lee, B. Lim, Identification of common pathways mediating differentiation of bone marrow and adipose tissues derived human mesenchymal stem Cells (MSCs) into three mesenchymal lineages, Stem Cells 25 (2007) 750–760. [34] S. Roche, M. Provansal, L. Tiers, C. Jorgensen, S. Lehmann,
Proteomics of primary mesenchymal stem cells, Regen Med. 1 (2006) 511–517.
[35] F. Guilak, H.A. Awad, B. Fermor, H.A. Leddy, J.M. Gimble, Adipose-derived adult stem cells for cartilage tissue engineering, Biorheology 41 (2004) 389–399.
[36] T. Fukumoto, J.W. Sperling, A. Sanyal, J.S. Fitzsimmons, G.G. Reinholz, C.A. Conover, S.W. O'Driscoll, Combined effects of insulin-like growth factor-1 and transforming growth factor-beta1 on periosteal mesenchymal cells during chondrogenesis in vitro, Osteoarthr. Cartil. 11 (2003) 55–64. [37] B. Johnstone, T.M. Hering, A.I. Caplan, V.M. Goldberg, J.U. Yoo,
In vitro chondrogenesis of bone marrow-derived mesenchymal progenitor cells, Exp. Cell Res. 238 (1998) 265–272.
[38] B. Schmitt, J. Ringe, T. Haupl, M. Notter, R. Manz, G.R. Burmester, M. Sittinger, C. Kaps, BMP2 initiates chondrogenic lineage development of adult human mesenchymal stem cells in high-density culture, Differentiation 71 (2003) 567–577.
9
E X P E R I M E N T A L C E L L R E S E A R C H X X ( 2 0 0 8 ) X X X – X X X
ARTICLE IN PRESS
[39] H. Afizah, Z. Yang, J.H. Hui, H.W. Ouyang, E.H. Lee, A comparison between the chondrogenic potential of human bone marrow stem cells (BMSCs) and adipose-derived stem cells (ADSCs) taken from the same donors, Tissue Eng. 13 (2007) 659–666.
[40] D. Noel, D. Gazit, C. Bouquet, F. Apparailly, C. Bony, P. Plence, V. Millet, G. Turgeman, M. Perricaudet, J. Sany, C. Jorgensen, Short-term BMP-2 expression is sufficient for in vivo osteochondral differentiation of mesenchymal stem cells, Stem Cells 22 (2004) 74–85.
[41] H.M. van Beuningen, H.L. Glansbeek, P.M. vdK, W.B. van den Berg, Differential effects of local application of BMP-2 or TGF-beta 1 on both articular cartilage composition and osteophyte formation, Osteoarthr. Cartil 6 (1998) 306–317. [42] A.C. Bakker, F.A. van de Loo, H.M. van Beuningen, P. Sime, P.L.
van Lent, P.M. van der Kraan, C.D. Richards, W.B. van den Berg, Overexpression of active TGF-beta-1 in the murine knee joint: evidence for synovial-layer-dependent
chondro-osteophyte formation, Osteoarthr. Cartil. 9 (2001) 128–136.