Publisher’s version / Version de l'éditeur:
Journal of the Acoustical Society of America, 80, 2, pp. 555-560, 1986-08
READ THESE TERMS AND CONDITIONS CAREFULLY BEFORE USING THIS WEBSITE. https://nrc-publications.canada.ca/eng/copyright
Vous avez des questions? Nous pouvons vous aider. Pour communiquer directement avec un auteur, consultez la première page de la revue dans laquelle son article a été publié afin de trouver ses coordonnées. Si vous n’arrivez pas à les repérer, communiquez avec nous à PublicationsArchive-ArchivesPublications@nrc-cnrc.gc.ca.
Questions? Contact the NRC Publications Archive team at
PublicationsArchive-ArchivesPublications@nrc-cnrc.gc.ca. If you wish to email the authors directly, please see the first page of the publication for their contact information.
NRC Publications Archive
Archives des publications du CNRC
This publication could be one of several versions: author’s original, accepted manuscript or the publisher’s version. / La version de cette publication peut être l’une des suivantes : la version prépublication de l’auteur, la version acceptée du manuscrit ou la version de l’éditeur.
Access and use of this website and the material on it are subject to the Terms and Conditions set forth at
Transfer function technique for impedance and absorption
measurements in an impedance tube using a single microphone
Chu, W. T.
https://publications-cnrc.canada.ca/fra/droits
L’accès à ce site Web et l’utilisation de son contenu sont assujettis aux conditions présentées dans le site
LISEZ CES CONDITIONS ATTENTIVEMENT AVANT D’UTILISER CE SITE WEB.
NRC Publications Record / Notice d'Archives des publications de CNRC:
https://nrc-publications.canada.ca/eng/view/object/?id=461647b9-d07c-45ae-8dc3-a801029c96d6 https://publications-cnrc.canada.ca/fra/voir/objet/?id=461647b9-d07c-45ae-8dc3-a801029c96d6
Ser
,
TH1
Am---
no.
1406
,
National Research
Conseil national
C . 2
Council Canada
de
recherches
Canada
Institute for
lnstitut de
- - - 1
Research in
recherche en
Construction
construction
I
Transfer Function Technique for
Impedance and Absorption
Measurements in an Impedance
Tube
Using a
Single Microphone
by W.T. Chu
ANALYZED
Reprinted from
Journal of the Acoustical Society of America
Vol. 80, No. 2, August 1986
p. 555
-
560
(IRC Paper No. 1406)
Price $2.00
NRCC 26400
En u t i l l s a n t une s&quence p s e u d o a l h t o i r e p6riodique corssae source de b r u i t , on peut appliquer l a technique de fonction de t r a n s f e r t
a
l ' a i d e de deux microphones pour mesurer, au myen d'un s e u l Isicrophone, l'imp8dance e t l ' a b s o r p t i o n dane un tube d'impaance, bliminant a i n s i l a proc&lure (labor& d'gtalonnage e t t o u t e e r r e u r a t t r i b u a b l e l a non-correspondance des phases. Les r g s u l t a t s obtenus g r k e B l a technique prspo%k s e conparent avantageuselpenta
ceux dorm& par l a d t h o d e couranta du taux d'ondes s t a t i o n n a i r e s .ransier funcclun cecnnlque for impedance and absorp~lvrl
. . . & tic m8 tri~easurements
in an impedance tube using a single microphonc
W . T. Chu
National Research Council of Canada, Division of Building Research, Montreal Road, Building M-27, Ottawa, Canada KIA OR6
(Received 11 December 1983; accepted for publication 11 April 1986)
Using a periodic pseudorandom sequence as the noise source, it is possible to implement the two-, microphone transfer function technique for impedance and absorption measurement in an impedance tube with a single microphone, thereby eliminating the elaborate calibrating procedure and any error associated with phase-mismatching. Results obtained by the proposed procedure compared well with thosq obtained by the standard standing-wave-ratio method. PACS numbers: 43.55.Ev, 43.85.Bh
ITRODUCTION
The advent of digital electronics has revolutionized rrlany acoustic measurements. One advanced measuring technique is the two-microphone transfer function method of measuring in-duct acoustic properties using random exci- tation. It was introduced by Seybert and Ross1 and further developed by Chung and B l a ~ e r . ~ Applications of this tech- I nique for measuring acoustic properties of tube or duct sys- tems have been reported by several authom3" The new tech- que is claimed to be about 40 times faster than the ~nventional standing-wave-ratio (SWR) m e t h ~ d . ~ It re- [ires, however, a pair of phase-matched microphones, or rborate calibrating procedures.
Recently, Fahy7 demonstrated the possibility of using a lgle microphone for this technique. Independently, Chug so came up with the same idea for more general applica- )ns, including those involving sound intensity measure- ents. A detailed investigation of the single-microphone rnsfer function technique for impedance and absorption easurements in an impedance tube is reported in this pa-
-
I. REVIEW OF THE TECHNIQUE
In 1977, Seybert and Ross' proposed a two-microphone random excitation method for determining normal acoustic properties in a tube, including the effect of a mean flow. In this method, the auto-spectral densities and the cross-spec- tral density of two microphone signals are used in a set of simultaneous equations to deduce the corresponding spec- tral functions of the incident and reflected waves. The im- pedance can be calculated subsequently from these spectral functions.
In 1980, Chung and Blaser2 derived a concise and closed-form expression relating the complex reflection coef- ficient to the measured transfer function of the acoustic pres- sures at two microphone positions. Their formulation is based on the impulse-response function and on the assump- tion of a stationary random process. Chug derived a similar result using the traditional single-frequency approach. He was able to include the tube-attenuation effect, which was
ignored in the previous analyses. The complex reflection co- efficient R of a specimen located at one end of an impedance tube (Fig. 1) is related to the transfer function H12 by the following equation9:
R ( f ) ={[HI,( f ) - e-"'"'"'
1
x
[&ik + a ) - H ( f )]-l)e2L(ik+a)12
,
(1)where HI, is the acoustic transfer function for the two micro- phone locations, f is the frequency, k is the wavenumber, a is the attenuation constant, s is the microphone separation, and L is the distance of microphone No. 1 from the surface of the specimen. For broadband excitation, HI, is given by the cross-spectral density between the two microphone signals, divided by the auto-spectral density of the No. 1 microphone signal.
The normal absorption coefficient a and the normal specific acoustic impedance Z /pc of the specimen are given by the following equations:
a = 1 - IR
l2
( 2 )and
Z/pc = (1
+
R ) / ( 1 - R ) , (3) wherep is the air density and c is the speed of sound. Assum- ing a = 0, Eq. (1 ) reduces to Chung and Blaser's result2R ( f ) ={[HI,( f ) - e-iks]/[eiks- H , ~ ( f )])eik2L. (4)
S PECTRUlil ANALYZER
"'
Presented in part at the 12th ~nternatidnal Congress on Acoustics, Tor- FIG. 1. Test apparatus and instrumentation for the transfer function tech-onto, 24-31 July 1986. nique of measuring impedance and absorption coefficient.
',
A study by Chung and Blaser on the singular condition,
eiks - H , , = 0, reveals that R becomes indeterminate when
ks = mn- for m = 1,2,3
,...
.
( 5 )Thus, to avoid these points up to a frequency
f,
, the micro-phone spacing s must be chosen such that
Besides the limitation, the choice of s and L is also governed by accuracy considerations. Seybert and Soenarko" have shown analytically that random errors can be minimized by maintaining a high coherence between the two microphone signals, which implies that s should be small. However, a small microphone spacing will reduce the accuracy of the measurements at low frequencies because the magnitude of the transfer function approaches unity when the wavelength of sound is very much greater than s. Experimental evi- dence'' also indicates that high coherence may not be real- ized when a microphone location coincides with a node point in the sound field. This suggests that different microphone positions and spacings have to be used to cover the frequency range being studied, as supported by Fahy's experiment.'
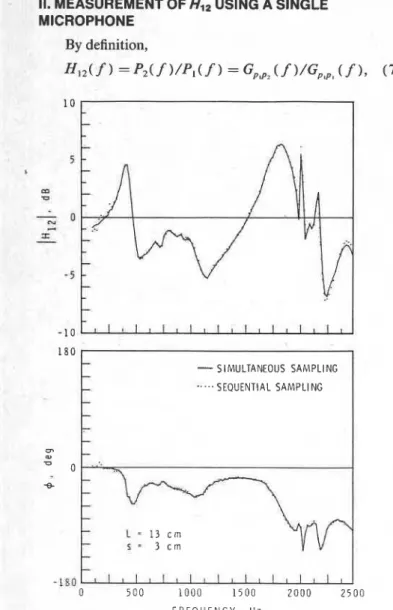
II. MEASUREMENT OF HIZ USING A SINGLE MICROPHONE
By definition,
-
SIMULTANEOUS SAhIPLING-....SEQUENTIAL SAMPLING
F R E Q U E N C Y . H z
FIG. 2. Comparison of the magnitude and phase of the transfer function obtained by two methods in a 10.2-cm-diam plastic tube with a 4.9-cm-thick plastic-foam termination.
556 J. Acoust. Soc. Am., Vol. 80, No. 2, August 1986
where P( f ) is the Fourier transform of the pressure signal
p ( t ) . The condition GPG2 ( f ), which is equal tc
4
[PI* ( f )P2( f )I ,
is the cross-spectral density ofp, andp,and Gp,p, ( f ) denotes the auto-spectral density ofp,. Equa tion ( 7 ) can be written as
If the process is stationary, GP,, and Gsp2 do not have to be
determined simultaneously. A single microphone can be used to measure, sequentially, the pressure at the two loca- tions. Thus any systematic errors related to the phase mis- match and uncertainty regarding effective microphone sepa- ration will be eliminated or minimized. It is necessary, however, to use a deterministic signal to make this approach practical. One of the best signals to use is the periodic pseu- dorandom sequence because it is effectively a multitone sig- nal with an almost flat-amplitude spectrum."
The following experiment was performed to check the feasibility of this proposal. Two 0.64-cm (;-in.) Bruel 8 Kjaer microphones were mounted, flush with the wall, in ar
impedance tube (as can be seen in Fig. 1 ) with L = 13 cn
and s = 3 cm. The tube is a 10.2-cm-diam PVC pipe, ap-
proximately 95 cm long, driven at one end by a small KEI
F R E Q U E N C Y . H z
FIG. 3. Comparison of the magnitude and phase of the reflection coefficient of a 5-cm-thick glass-fiber sample measured in an impedance tube with the new technique for two repeated runs.
loudspeaker. For this tube, the upper frequency limit for plane-wave propagation is about 2 kHz. An HP 3582A dual- channel digital spectrum analyzer, used for computing the spectral functions, has a built-in periodic pseudorandom- sequence generator, and can produce 128 spectral lines for the transfer function computation. A plastic-foam sample, 4.9 cm thick, was used as the test specimen.
First, the two microphone signals were sampled simul-
taneously to establish the reference quantity GPG2 /Gp,,
.
Then the source signal and each of the microphone signals were digitized simultaneously, in pairs taken sequentially, to
give [ G,,, GSP2 ] / [GPGl GSS ]
.
Only one period of the periodicsignal was used, and no averaging was performed. A com- parison of the magnitude and phase ofH,,, obtained by these two different procedures, is presented in Fig. 2. Results indi- cate that the proposed single-microphone technique is feasi- ble.
A more detailed investigation was carried out, subse- quently, in a smaller impedance tube equipped with a tra- versing probe-tube microphone, such that the acoustic prop- erties of any specimen can be measured by the proposed single-microphone technique and the standard SWR meth- od under the same condition for comparison. The tube has a diameter of 5.75 cm and is approximately 107 cm long. It is
driven by a horn driver, mounted on the side, to allow the probe-tube microphone to traverse along the center of the tube. Experience has shown that it is necessary to use a very stable microphone for the proposed single-microphone tech- nique. A 0.64-cm (;-in.) Bruel and Kjaer microphone was found to be satisfactory. Other data acquisition equipment remained the same.
Two different types of acoustical material were used in this investigation: a 5-cm-thick glass-fiber sample and a 4.9- cm-thick plastic-foam sample with a perforated vinyl back- ing. The microphone locations were chosen to be fairly close to the specimen, so that the tube attenuation could be ne- glected. Figure 3 shows a comparison of the magnitude and phase of the reflection coefficient of the 5-cm-thick glass- fiber sample, measured with the new single-microphone technique for two repeated runs, using only one period of the data. Although the result is acceptable, additional averaging could be beneficial.
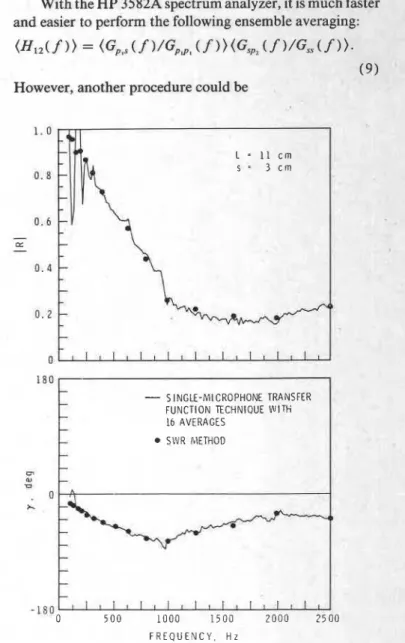
Ill. AVERAGING PROCEDURE
With the HP 3582A spectrum analyzer, it is much faster
and easier to perform the following ensemble averaging:
(H12(f 1) = (Gpns(f )/GpG, ( f ))(Gsp2(f )/Gss(f 1).
( 9 )
However, another procedure could be
-
- A C C O R D I N G TO EQ. 10-
-
... A C C O R D I N G TO EQ. 9-
-
-
-
m m - n 0 -180 0 5 0 0 1 0 0 0 1 5 0 0 2 0 0 0 2 5 0 0 F R E Q U E N C Y . H zFIG. 4. Comparison of the magnitude and phase of the reflection coefficient of a 5-cm-thick glass-fiber sample measured in an impedance tube with the new technique using two different types of ensemble averaging. Eight aver- ages were used.
557 J. Acoust. Soc. Am., Vol. 80, No. 2, August 1986
-
-
S INGLE-MICROPHONE TRANSFER-
FUNCTION TECHNIOUE W I T H-
16 AVERAGES --
S\VR METHOD-
--
A I-
-
-
-
I l l l t l t l r t r l l l ~ l l l l - 1 8 0 0 5 0 0 1 0 0 0 1 5 0 0 2 0 0 0 2 5 0 0 F R E Q U E N C Y , H zFIG. 5. Comparison of the magnitude and phase of the reflection coefficient of a 5-cm-thick glass-fiber sample measured in an impedance tube by two different methods.
P,,
( f
)G EFFECT OPHONEYet, as shown in Fig. 4, the measured reflection coefficients of the glass-fiber sample, using these two ways of averaging, show no significant differences except at the low frequencies. The discrepancy seemed to be caused by other effects, since it was found that repeatability was not significantly improved, -ven with averaging at these low frequencies, when the sepa- ltion of the microphone positions was small. The effect of le microphone separation is discussed in Sec. V. For subse- uent investigations, ensemble averaging, according to Eq. lo), was used.
f. COMPARISON WITH THE SWR METHOD
The reflection coefficients of the two specimens were measured in the small impedance tube, under conditions similar to those of the glass-fiber sample, by both the pro- xed single-microphone technique of the transfer function lethod and an improved version of the standard SWR ,ethod.12 Results are compared in Figs. 5 and 6. Except for le low frequencies, the agreement is fairly good. The pro- xed technique took less than 5 min to provide 128 frequen-
r points, whereas the SWR method required at least 30 min
to give 15 frequency points. Based on the repeatability
check, the SWR method is more precise.
- S INGLE-4IICROPHONE TRANSFER FUNCTION TECHNIQUE iVITH 16 AVERAGES SLdR RIETHOD
-
C Z-
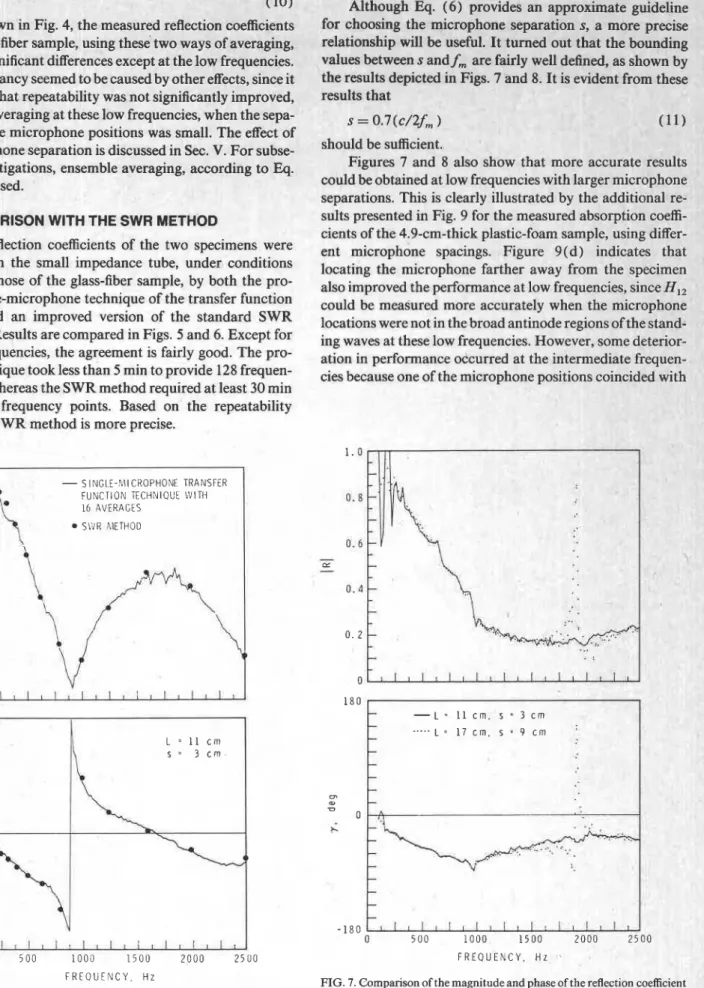
1 8 0Although Eq. ( 6 ) provides an approximate guidelinc
for choosing the microphone separation s, a more precisc relationship will be useful. It turned out that the bounding
values between s and f, are fairly well defined, as shown bj
the results depicted in Figs. 7 and 8. It is evident from thest results that
s = 0.7(c/2fm ) (1 1)
should be sufficient.
Figures 7 and 8 also snow that more accurate result5
could be obtained at low frequencies with larger microphone separations. This is clearly illustrated by the additional re. sults presented in Fig. 9 for the measured absorption coeffi- cients of the 4.9-cm-thick plastic-foam sample, using differ- ent microphone spacings. Figure 9 ( d ) indicates thal locating the microphone farther away from the specimen
also improved the performance at low frequencies, since H12
could be measured more accurately when the microphone locations were not in the broad antinode regions of the stand- ing waves at these low frequencies. However, some deterior- ation in performance occurred at the intermediate frequen- cies because one of the microphone positions coincided with
- 1 8 0 0 5 0 0 1 0 0 0 1 5 0 0 2 0 0 0 2 5 0 0 -150 0 5 00 1 0 0 0 1 5 0 0 2 0 0 0 2 5 0 0 F R E Q U E N C Y . H z
-
- L = 1 1 c m , s = 3 c m-
-.... L = 1 7 c m , s Z 9 c m '-
-
-
-
-
-
A . .:\/
.
. . . . .. . ._ . ...-
' ... * ._
-
-
-
-
-
1 l l I , l l 1 1 I l l 1 1 1 F R E Q U E N C Y , H zFIG. 7. Comparison of the magnitude and phase of the reflection coefficient FIG. 6. Comparison of the magnitude and phase of the reflection coefficient of a 5-cm-thick glass-fiber sample measured in an impedance tube with the of a 4.9-cm-thick plastic-foam sample measured in an impedance tube by new technique using two different microphone separations. Sixteen aver-
two different methods. ages were used.
I
-
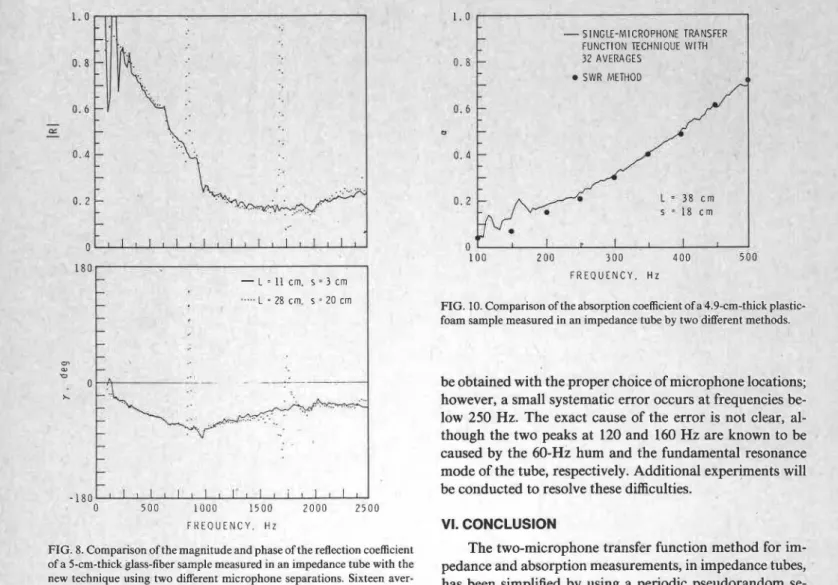
b I N L ~ L ~ - N I I CROPHONE FUNCTION TECHNIQUE 32 AVERAGES SWR METHOD-
41-
TRANSFER ..-
L = 11 cm, s = 3 cm *.... L = 28 cm, s = 20 cm1
F R E Q U E N C Y . H zFIG. 10. Comparison of the absorption coefficient of a 4.9-cm-thick plastic-
foam sample measured in an impedance tube by two different methods.
be obtained with the proper choice of microphone locations; however, a small systematic error occurs at frequencies be- low 250 Hz. The exact cause of the error is not clear, al- though the two peaks at 120 and 160 Hz are known to be caused by the 60-Hz hum and the fundamental resonance mode of the tube, respectively. Additional experiments will be conducted to resolve these difficulties.
VI. CONCLUSION
F R E Q U E N C Y , H z
The two-microphone transfer function method for im- pedance and absorption measurements, in impedance tubes, has been simplified by using a periodic pseudorandom se- quence as the noise source, so that a sequential sampling of the pressure signals at two locations, by a single microphone, can replace the original requirement of simultaneous sam- pling. Errors and difficulties associated with phase-mis- matching in the two-microphone transfer function method are thereby eliminated, making the new measuring tech- FIG. 8. Comparison of the magnitude and phase of the reflection coefficient
of a 5-cm-thick glass-fiber sample measured in an impedance tube with the new technique using two different microphone separations. Sixteen aver- ages were used.
the nodes of some of these frequencies. Thus it is necessary to try different microphone locations and separations for accu- rate measurements. This should pose no serious drawback since the experimental technique is very efficient.
Figure 10 shows that good results at low frequencies can
nique highly practical.
Results determined by the new technique compared well with those obtained by the SWR method. Although this new technique is not as precise as the SWR method, it is more than an order of magnitude faster and is quite adequate for routine impedance and absorption measurements. Expe- rience has indicated that different microphone locations and separations have to be used to cover a wide frequency range, and some ensemble averaging is necessary if no frequency averaging is performed. (a1 L = 11 cm.
E
( c l L = 17 cm. s = 9 c m I d ) L = 38 cm, s = 6 c m ACKNOWLEDGMENTThis paper is a contribution from the ~ i v i s i o n of Build- ing Research, National Research Council of Canada.
0
100 200 300 400 500100 200 300 400 500
F R E Q U E N C Y , H z
'A. F. Seybert and D. F. Ross, "Experimental determination of acoustic properties using a two-microphone random-excitation technique," J. Acoust. Soc. Am. 61, 1362-1370 (1977).
'J. Y. Chung and D. A. Blaser, "Transfer function method of measuring in- duct acoustic properties: I. Theory, 11. Experiment," J. Acoust. Soc. Am. 68,907-921 (1980).
FIG- 9. The absorption coefficient of a 4.9-cm-thick plastic-foam sample
measured in an impedance tube with the new technique using different mi- crophone positions and separations. Thirty-two averages were used.
W. T. Chu: Transfer function technique with single microphone 559 559 J. Acoust. Soc. Am., Vol. 80, No. 2, August 1986
[. Nishimura, S. Fukats~ 4, and K. A1
in o n r l cn...
tamutsu, "Measurements of transfer atrices of duct element,
,..,
,,,.;e impedance using the pair-micro- lone technique," Proc. Inter-Noise 83, 395-398 ( 1983).. Franco and G. Guglielmone, "Determination of the acoustical imped- Ice of complex geometry slots used in automotive exhaust system by
...
eans of a measurement procedure in a tube," Proc. Inter-Noise 83,343- 346 (1983).'M. G. Prasad and M. J. Crocker, "Acoustical source characterization studies on a multicylinder engine exhaust system," J. Sound Vib. 90,479- 490 (1983).
6T. E. Vigran, "Measuring the acoustic properties of ducts," Appl. Acoust.
18,241-249 (1985).
'F. J. Fahy, "Rapid method for the measurement of sample acoustic im- pedance in a standard wave tube," J. Sound Vib. 97, 168-170 ( 1984).
'W. T. Chu, "Single-microphone method for certain applications of the
sound intensity technique," J. Sound Vib. 101,443445 (1985).
9W. T. Chu, "Extension of the two-microphone transfer function method for impedance tube measurements," J. Acoust. Soc. Am. (submitted for publication).
''A. F. Seybert and B. Soenarko, "Error analysis of spectral estimates with application to the measurement of acoustic parameters using random sound fields in ducts," J. Acoust. Soc. Am. 69, 1190-1 199 (1981).
"W. T. Chu, "Architectural acoustic measurements using periodic pseu-
dorandom sequences and FFT," J. Acoust. Soc. Am. 76,475478 ( 1984).
lZW. T. Chu, "An improved tube method for acoustic impedance measure-
ment," Building Research Note 113, National Research Council of Can- ada, Division of Building Research (March 1977).
T h i s paper
i s
being d i s t r i b u t e d i n r e p r i n t form by t h e I n s t i t u t e f o r Research i n C o n s t r u c t i o n . Alist
of b u i l d i n g p r a c t i c e and r e s e a r c h p u b l i c a t i o n s a v a i l a b l e from t h e I n s t i t u t e may be obtained by w r i t i n g t o t h e P u b l i c a t i o n s S e c t i o n , I n s t i t u t e f o r Research i n C o n s t r u c t i o n , National Research C o u n c i l of C a n a d a , O t t a w a , O n t a r i o ,KlA
OR6.
Ce document e s t d i s t r i b u e sous forme de t i t € - 8 - p a r t p a r
1'
I n s t i t u t de r e c h e r c h e e n c o n s t r u c t i o n . On peut o b t e n i r unel i s t e
d e s p u b l i c a t i o n s dc 1 ' I n s t i t u t p o r t a n t s u r l e s t e c h n i q u e s ou
les
recherches enmatiere
d e batiment e n 6 c r i v a n t