A CLAMP LIGATION METHOD FOR POINT MUTATIONAL
SPECTROMETRY: MARKED INCREASE IN SCANNING RANGE FOR THE
HUMAN GENOME
by
Andrea Seungsun Kim
B.S., Biochemistry
Western Washington University, 1994
Submitted to the Division of Bioengineering and Environmental Health in Partial Fulfillment of the Requirements for the Degree of
Doctor of Philosophy in Toxicology at the
Massachusetts Institute of Technology February, 2002
© 2002 Massachusetts Institute of Technology All rights reserved
t\ACHfVES
'''''''-''-:' MASSACHUSETTS INSTITUTE OF TECHNOLOGYAPR 0 2
2002
lIBRARIES
SignatureofAuthor:~~~~~~~~~~~~~~~~~~~~~~~~Division of Bio£ngineering and Environmental Health December 12,2001 Certifiedby:~~~~~~~~~~~ ~~~,...-.-_~~~~~~-7
/7
William G. Thilly Professor of Toxicology Thesis Advisor AcceptedbY:~~~~~~----r~~~~_ _~_~~~_~~~~ ~_ Peter C. Dedon Professor of Bioengineering and Environmental HealthThis doctoral thesis has been examined
by
a Committee of the Division of Bioengineering and Environmental Health as follows:Professor Peter C. Dedon
Chairman
Professor William G. Thilly
Thesis Advisor /
Professor Bevin P. Engelward
Dr. Gerald P.Holmquist
A CLAMP LIGATION METHOD FOR POINT MUTATIONAL
SPECTROMETRY: MARKED INCREASE IN SCANNING RANGE FOR THE HUMAN GENOME
by Andrea Seungsun Kim
Submitted to the Division of Bioengineering and Environmental Health on December 12, 200 1 in Partial Fulfillment of the Requirements for the Degree of Philosophy in
Toxicology
ABSTRACT
The study of human mutagenesis requires methods of measuring somatic mutations in normal human tissues and inherited mutations in human populations. Such methods should permit measurement of rare mutations in the presence of abundant wild-type copies and should be general to the human genome.
A sensitivity of 2x 10⁻⁶for point mutations was recently achieved in human cells using a novel method of target isolation, constant denaturant capillary electrophoresis (CDCE), and high-fidelity polymerase chain reaction (hifi-PCR) (Li-Sucholeiki and Thilly, 2000). This method is applicable to 100-base pair (bp) DNA domains juxtaposed with a naturally occurring domain of a higher melting temperature, or a natural clamp. Such sequence domains represent about9% of the human genome.
To permit analysis of rare point mutations in the human genome more generally, this thesis developed a procedure in which a clamp can be ligated to any 100-bp sequence of interest. This procedure was combined with the previous method to create a new method of point mutational analysis that is not dependent on a naturally occurring clamp. To demonstrate the new method, a sequence with a natural clamp, a part of the human
hypoxanthine-guanine phosphoribosyl transferase (HPRT) gene (cDNA-bp 223-318), was analyzed using both the natural and ligated clamps.
A sensitivity of 2x 10⁻⁵in human cells was demonstrated using the ligated clamp as opposed to 5
x
10-6using the natural clamp. The sensitivity of the new method using the ligated clamp was demonstrated to be limited by the fidelity of Pfu DNA polymerase used for PCR. The sequence of the ligated clamp accounted for the differences in sensitivity as a result of causing a decreased efficiency of mutant enrichment byCDCE.The new method can be applied to measure somatic mutations in normal human tissues, such as lung tissues, in which point mutations at fractions above 10-5have been observed. This method can also detect predominant inherited mutations even for genes carrying recessive deleterious alleles in pooled samples derived from a large number of individuals.
This thesis is dedicated to all of my family members, especially those who did not get to live up to their potential. Each one of their lives allowed me to learn many valuable lessons in life. Without these lessons, I would not have been able to complete this thesis.
ACKNOWLEDGEMENTS
I would like to begin by thanking my thesis advisor, Professor William G. Thilly. While many years of working with him have been a very challenging experience, these years taught me to reach to my higher self. I envy his high scientific ambitions and his important and necessary work searching for the truth in "what mutates people."
I also thank my thesis committee members, Professor Peter C. Dedon, Professor Bevin P. Engelward, Dr. Gerry P, Holmquist, and Dr. Howard L. Liber. Their guidance and time meant a lot when starting, as well finishing, this thesis.
I thank Dr. Xiao-cheng Li-Sucholeiki and her brilliant technological development. Without her development, this thesis would never have been started.
I would like to acknowledge Dr. Paulo Andre for teaching me the basics of PCR and CDCE during those first few months in Thilly lab. I am especially thankful for the shared experience of learning the importance of the fidelities of DNA polymerases in mutation research.
Mr. Allen Zhang, a former employee of the Beckman Research Institute, taught me how to ligate DNA molecules. I thank him for his time and effort during those very first few days of working on DNA ligation.
Sensitivity demonstration using the ligated clamp in human cells was achieved after many failures. I thank Ms. Jacklene Goodluck-Griffith and Dr. Aoy Tomita-Mitchell for sharing a copious number of human cells, allowing these failures.
I would like to thank all Thilly lab members, past and present. I am especially thankful for having the opportunities to learn people with diverse backgrounds.
I thank Ms. Debra Luchanin, a former academic administrator of BEH, for her administrative work throughout the years. I also appreciate her caring heart for the students in the division.
Last, but not least, I would like to acknowledgemy writing coaches, Ms. Pamela Siska and Ms. Susan Spilecki, at the MIT Writing Center. This thesis would not have been possible without numerous sessions with them. It was the teamwork that made completion of this document possible.
TABLE OF CONTENTS Title page 1 Committee page 2 Abstract 3 ~ote 4 Acknowledgments 5 Table of Contents 6 List of Figures 9 List of Tables 12 List of Abbreviations 14 1 Introduction 17 2 Literature Review 19 2.1 Mutational spectra 19
2.1.1 Definition and purpose of analysis 19
2.1.2 Point mutational spectra in humanHPRTgenein vitro 20
2.1.3 Point mutational spectra in human mitochondrial DNAin vitro
and in vivo 26
2.2~ucleargenes associated with human cancer 28 2.3 Nuclear mutations associated with human disease 29
2.3.1 Inherited mutations 29
2.3.2 Somatic mutations 35
2.3.2.1 Gene-specific mutations 35
2.3.2.2 p53 mutations 37
2.4 Somatic nuclear mutations and mutant fractions in normal human tissues 42 2.4.1 Phenotype-based analysis ofHLA andHPRTmutations 42
2.4.2 Phenotype-based analysis ofp53mutations 47
2.4.3 Genotype-based analysis ofrasandp53 mutations 49 2.5 Criteria for measuring somatic point mutational spectra in normal human
tissues 50
2.5.1 Turnover unit size 52
2.5.2 Sample size 53
2.5.3 Methods 54
2.5.3.1 Hifi-PCR 54
2.5.3.2 Genotype-based point mutation detection 56
2.5.3.2.1 Allele-specificpeR 58 2.5.3.2.2 RFLP/PCR 58 2.5.3.2.3 Target isolation/CDCE/hifi-PCR 60 2.5.3.3 Clamp attachment 64 2.5.3.3.1 Cloning-based method 64 2.5.3.3.2 PeR-based method 65 2.5.3.3.3 Probe-based method 66
2.6 Criteria for measuring inherited point mutational spectra in human
3 Materials and Methods 71
3.1 Construction of melting profiles 71
3.2 Proposed method of clamp attachment 71
3.2.1 Ligation-based methodology 71
3.2.2 Method of estimating number of chosen restriction ends per human
cell 73
3.2.3 Preparation of clamp for Apo I restriction end 73 3.2.3.1 First approach: direct hybridization 75 3.2.3.2 Second approach: purification by CDCE 75 3.3 Overview of proposed point mutation detection method 75
3.4 Test target sequence: HPRTexon 3 78
3.5 Preparation of internal standards 78
3.5.1 Homoduplex mutant of genomic DNA 78
3.5.2 Homoduplex mutant ofpeRproducts (438-bp) 78 3.5.3 Homoduplex mutant of PCR products (198-bp/169-bp) 80 3.5.4 Heteroduplex mutant of PCR products (198-bp) 80
3.6 PCR 81
3.6.1 Primers 81
3.6.2 Reaction conditions 81
3.7 CDCE and CE 84
3.7.1 Instrumentation and operating conditions 84
3.7.2 Coating of capillaries 87
3.7.3 Preparation of separation matrix 88
3.7.4 Sample loading 89
3.7.4.1 Diluted sample 89
3.7.4.2 Dialyzed sample 89
3.7.5 Methods of quantitative analysis 90
3.8 Mutational analysis: ligated vs. natural clamp 91
3.8.1 Procedure of genomic DNA isolation 91
3.8.2 First restriction digestion: BstNI andDra I 92
3.8.3 Target isolation 93
3.8.3.1 Procedure 93
3.8.3.2 Methods of estimating yield and isolation efficiency 96
3.8.4 Target renaturation 97
3.8.5 Second restriction digestion 97
3.8.5.1 Ahd I/HinjI: natural clamp 97
3.8.5.2 Apo I: ligated clamp 99
3.8.6 Clamp ligation 99
3.8.7 Pre-PeR mutant enrichment by CDCE 100
3.8.8 Pre-PCR mutant enrichment by CE 101
3.8.9 Hifi-PCR and post-PCR mutant enrichment by CDCE 101
3.8.10 Mutational analysis by CDCE 101
3.8.11 Purification of individual mutants by CDCE 102
3.9 Second target sequence: p53 exon 7 102
4.2 Clamp attachment/ligation 110 4.2.1 Estimated number of chosen restriction ends per human cell 110
4.2.2 Optimal ligation reaction conditions 113
4.2.3 Optimal restriction digestion reaction conditions 115 4.2.4 Demonstration of high efficiency clamp ligation 115
4.3 Test target sequence: HPRTexon 3 118
4.3.1 Demonstration of CDCE separation: ligated vs. natural clamp 118
4.3.2 Fidelity ofPfuDNA polymerase 121
4.3.3 HPRTpseudogenes 121
4.4 Use of internal standards 124
4.5 Mutational analysis: ligated vs. natural clamp 125 4.5.1 With CDCE-purified wild-type DNA of PCR products 125
4.5.1.1 Initial DNA samples 125
4.5.1.2 Restriction digestion and clamp ligation 127
4.5.1.3 Pre-peR mutant enrichment 129
4.5.1.3.1 Necessity 129
4.5.1.3.2 Efficiency 132
4.5.1.3.3 Cause of decreased efficiency 133 4.5.1.4 Hifi-PCR and post-PCR mutant enrichment 135
4.5.1.5 Sensitivity 137
4.5.1.6 Source of background noise 137
4.5.2 With wild-type DNA of human cells 143
4.5.2.1 Initial DNA samples 143
4.5.2.2 Genomic DNA isolation 144
4.5.2.3 Sequential restriction digestion 144
4.5.2.4 Target isolation 147
4.5.2.5 Target renaturation 148
4.5.2.5.1 Potential source of background noise 148
4.5.2.5.2 Efficiency 152
4.5.2.6 Restriction digestion and clamp ligation 155
4.5.2.7 Pre-PCR mutant enrichment 155
4.5.2.8 Hifi-PCR and post-peR mutant enrichment 157
4.5.2.9 Sensitivity and accuracy 157
4.5.2.10 Source of background noise 162
4.6 Demonstration of CDCE separation:p53exon 7 170
5 Conclusions 173
6 Suggested Future Studies 174
6.1. Increase in mutation detection sensitivity 174
6.2. Applications 174
6.2.1 Inherited mutations 174
6.2.2 Somatic mutations 175
LIST OF FIGURES
Figure 1. Mutagen-specific point mutational spectra in human cells (TK6) 22 Figure 2. BP exposure condition-specific point mutational spectra in human
cells
CARR-I)
24Figure 3. Distribution of germline point mutations in tumor suppressor genes
in human cancer 36
Figure 4. Distribution of somatic point mutations in tumor suppressor genes
in human cancer 38
Figure 5. HPRT mutant fraction vs. age in T-lymphocytes of healthy
individuals 43
Figure 6. Distribution of somatic mutations in HPRT gene in T-lymphocytes
of healthy individuals 46
Figure 7. DNA separation by CDCE 61
Figure 8. Flow diagram of target isolationlCDCE/hifi-PCR 63
Figure 9. Probe-based method of clamp attachment 67
Figure 10. Analysis of inherited point mutational spectra in human populations 69
Figure 11. Proposed method of clamp attachment 72
Figure 12. Characteristics of clamp for Apo I restriction end 74 Figure 13. Recognition sequence of Apo I restriction endonuclease 75 Figure 14. Flow diagram of proposed point mutation detection method:
natural vs. ligated clamp 76
Figure 15. Melting profiles of human HPRT exon 3: natural vs. ligated clamp 79
Figure 16. Primer sites for chosen HPRT target 82
Figure 17. Diagram of CDCE apparatus 85
Figure 20. Melting profile of human p53 exon 7 with ligated clamp 103 Figure 21. Characteristics of clamp for Avr II restriction end 104 Figure 22. Recognition sequence of Avr II restriction endonuclease 105 Figure 23. Melting profile of human p53 gene (first 3000-bp) 107
Figure 24. High efficiency clamp ligation 117
Figure 25. CDCE separation of low Tmmutant from wild-type sequences:
HPRT exon 3 with natural clamp 119
Figure 26. CDCE separation of low Tmmutant from wild-type sequences:
HPRT exon 3 with ligated clamp 120
Figure 27. HPRT pseudogenes in the human genome 123
Figure 28. peR-amplification efficiencies: wild-type vs. internal standards 126 Figure 29. Levels of mutations generated byPfuDNA polymerase during PCR 130 Figure 30. Mutation detection by CDCE: before vs. after post-PCR mutant
enrichment 136
Figure 31. Mutation detection by CDCE: natural clamp
(initial samples of CDCE-purified wild-typeDNA) 139 Figure 32. Mutation detection by CDCE: ligated clamp
(initial samples of CDCE-purified wild-type DNA) 140
Figure 33. Background mutants vs. doublings 142
Figure 34. Restriction digestion by BstN I, Dra I, Ahd I, Hinf I, and Apo I 145 Figure 35. Renaturation efficiencies vs. incubation duration 153 Figure 36. Mutation detection by CDCE: ligated vs. natural clamp
(initial samples of human cells) 158
Figure 37. CDCE-mutation detection vs. mutant fractions: ligated clamp
(initial samples of human cells) 160
Figure 38. Accuracy of mutation detection by CDCE: ligated clamp 163 Figure 39. Source of background noise: Pfu DNA polymerase 166
Figure 40. Positions and kinds of mutations in chosen HPRT target 168 Figure 41. CDCE separation of high Tmmutant from wild-type sequences:
LIST OF TABLES
Table 1. Characteristics of selected human proto-oncogenes 30 Table 2. Characteristics of selected human tumor suppressor genes 31
Table 3. Number of HGMD entries by mutation type 32
Table 4. Spectrum of HGMD single base-pair substitutions in gene-coding
regIons 34
Table 5. Summary of somatic mutations in HPRT gene in T-Iymphocytes of
healthy individuals 45
Table 6. Summary of p53 mutant fractions in skin tissues of healthy
individuals 48
Table 7. Summary of nuclear point mutations in normal human tissues 51 Table 8. Characteristics of thermostable DNA polymerases 55 Table 9. Characteristics of genotype-based methods of rare point mutational
analysis 57
Table 10. Sequences of primers for chosen HPRT target 83 Table 11. Melting profile results: entire DNA sequences of selected human
genes 109
Table 12. Melting profile results: coding regions of selected human tumor
suppressor genes 111
Table 13. Estimated numbers of chosen restriction ends 112
Table 14. Estimated numbers of chosen restriction ends and ratios of target
to non-target restriction ends after target isolation 112
Table 15. Optimal ligation reaction conditions 114
Table 16. Reaction conditions of ApoI restriction digestion vs. efficiency of
clamp ligation 116
Table 18. Summary of mutant enrichment efficiencies
Table 19. Rates of heat-induced DNA modifications vs. temperatures
Table 20. Expected fractions of heat-induced DNA modifications
Table 21. Summary of mutations in chosen HPRT target
138
149
151
A AFB] AP APC APS bp BP BPDE BSA C CDCE CDGE
CE
DGGE DMSO DNA EDTA G HGMD hifi-PCR HPLC HPRT LIST OF ABBREBIATIONS Adenine Aflatoxin BI Apurinic/apyrimidinicAdenomatous polyposis coli
Ammonium persulfate
Base pair
Benzo[a]pyrene
Benzo[a]pyrene 7,8-diol-9,10-epoxides
Bovine serum albumin
Cytosine
Constant denaturant capillary electrophoresis
Constant denaturant gel electrophoresis
Capillary electrophoresis
Denaturing gradient gel electrophoresis
Dimethyl sulfoxide
Deoxyribonucleic acid
Ethylenediaminetetraacetic acid
Guanine
Human Gene Mutation Database
High-fidelity PCR
High-performance liquid chromatography
IARC id kb LCR 5mC mf MLTP MNNG PAGE PBS peR Pfu RFLP rRNAs SDS SNPs
SS
SSPE T Taq TBE TBEBInternational Agency for Research on Cancer
Inner diameter
Kilobases
Ligation chain reaction
5-MethyIcytosine
Mutant fraction
Mutations leading to truncated proteins
N-methyl-N' -nitro-N-nitrosoguanidine
Polyacrylamide gel electrophoresis
Phosphate-buffered saline
Polymerase chain reaction
Pyrococcus furiosus
Restriction fragment length polymorphism
Ribosomal RNAs
Sodium dodecyl sulfate
Single-nucleotide polymorphisms
Single strand
Sodium chloride, sodium phosphate, EDTA Thymine
Thermus aquaticus
Tris-borate, EDTA
TEMED 6TG tk tRNAs UMD UV Vent VRL N, N, N', N' -tetramethylethylenediamine 6-Thioguanine Thymidine kinase Melting temperature Transfer RNAs
Universal Mutation Database
Ultraviolet light
Thermococcus litoralis
1 INTRODUCTION
Many mutations have been found in both inherited and somatic cases of human disease (Bos, 1989; Kogelnik et aI., 1998; Beroud et aI., 2000; Krawczak et aI., 2000). However, causes of human mutation are yet to be determined. Possible sources of human mutation are exogenous agents, endogenous metabolites, and DNA replication errors (Lindahl, 1993; Greenblatt et aI., 1994; Coller and Thilly, 1998; Hussain and Harris, 1998; Krawczak et aI., 1998; Loeb and Loeb, 2000).
It has been hypothesized that if environmental agents are the primary cause of human mutation, agent-specific distributions of mutations in a given DNA sequence are expected in individuals exposed to these agents (Cariello and Thilly, 1986; Thilly, 1993; Coller and Thilly, 1994). However, testing such a hypothesis is hindered by the lack of genotype-based methods of measuring somatic mutations in normal tissues. Such methods should permit measurement of rare mutations in the presence of their abundant wild-type and should be general to the human genome. Methods that can fulfill these requirements should also allow analysis of inherited mutations in pooled samples derived from a large number of individuals.
The ability to analyze mutations based on their genotype, rather than phenotype, offers a larger pool of target genes and tissues. Most phenotype-based methods are only
applicable to cultured cells and to certain tissue types, the cells of which can be grown in
vitro (e.g., blood). In addition, phenotype-based methods are limited to selectable genes.
Thus, genotype-based methods are the methods of choice. However, genotype-based point mutation detection methods for rare mutational analysis offer a small target size of 1- to 6-base pairs (bp) (Aguilar et aI., 1994; Hussain et aI., 1994; Nakazawa et aI., 1994; Ouhtit et aI., 1997; Wilson et aI., 2000).
For genotype-based mutational analysis of a larger target size of about 100-bp, our laboratory has developed a method called constant denaturant capillary electrophoresis (CDCE) (Khrapko et aI., 1994a). CDCE differentiates mutant from wild-type sequences based on differences in their melting temperatures. When combined with additional techniques, CDCE allows detection of point mutations in a variety of human samples
technological development in which CDCE is combined with target isolation and high-fidelity polymerase chain reaction (hifi-PCR) allows analysis of mutations at fractions as low as 10-6(Li-Sucholeiki and Thilly, 2000). This development can be applied to only those DNA sequences with a natural clamp, representing about 9% of the human genome.
For genotype-based mutational analysis of a larger target-pool size, this thesis presents a further technological development, a combined method of clamp ligation and target isolation/CDCE/hifi-PCR. This development opens up an additional 89% of the human genome suitable for analysis of rare point mutations. This combined method may allow understanding of human point mutagenesis by performing mutational analysis in a variety of human samples, including normal tissues.
2 LITERATURE REVIEW
2.1 Mutational spectra
Understanding of human mutagenesis requires mutational analysis in humans. Section 2.1.1 defines mutational spectra and discusses how mutational spectra can be used to understand human mutagenesis. Sections 2.1.2 and 2.1.3 review studies on point mutational spectra observed in a variety of human samples.
2.1.1 Definition and purpose of analysis
Benzer and Freese (1958), followed by Benzer (1961), primarily demonstrated
mutational spectra, distributions of mutations with regard to position, kind, and frequency in a given DNA sequence. In these studies, each test mutagen was shown to induce a nonrandom distribution of mutations in the rII region of the phage T4 genome. These studies also showed that the induced mutations appear more frequently than expected by chance, called hotspot mutations. Since these studies, analysis of mutational spectra has been extended to bacteria, yeast, as well as human cells and tissues (Coulondre and Miller, 1977; Armstrong and Kunz, 1990; Cariello et aI., 1990; Khrapko et aI., 1997a).
Mutational spectra have been suggested as a tool to understand cause-and-effect relationships (Cariello and Thilly, 1986; Thilly, 1993; Coller and Thilly, 1994). These studies proposed that if environmental agents are the primary cause of human mutation, agent-specific mutational spectra are expected in individuals exposed to these agents. Exogenous agents, endogenous metabolites, and DNA replication errors have been hypothesized as possible sources of human mutation (Lindahl, 1993; Greenblatt et aI., 1994; Coller and Thilly, 1998; Hussain and Harris, 1998; Krawczak et aI., 1998; Loeb and Loeb, 2000). However, causes of human mutation are yet to be determined. Causes of human mutation may be revealed by a sensitive and general means of measuring mutational spectra in a variety of human samples.
2.1.2 Point mutational spectra in human HPRT gene in vitro
For mutational analysis of a larger pool of target genes and tissues, genotype-based methods are preferred over phenotype-based methods. Most phenotype-based methods are only applicable to cultured cells and to certain tissue types, the cells of which can be grownirl vitro (e.g., blood). In addition, phenotype-based methods are limited to
selectable genes. Despite these limitations, earlier mutational studies have been primarily based on reference to phenotypic selection. This section reviews studies on point
mutational spectra observed in cultured human cells using the hypoxanthine-guanine phosphoribosyl transferase(HPRT) gene as a selectable marker.
The humanHPRTgene is comprised of 57,OOO-bp and consists of nine exons
(Edwards et aI., 1990). This gene is on the X-chromosome, present as one copy per cell in males (Stout and Caskey, 1985). ManyHPRTmutations have been found to be associated with inherited cases of human disease, such as Lesch-Nyhan syndrome (Stout and Caskey, 1985; Mohrenweiser and Jones, 1990; Cariello and Skopek, 1993a;
Krawczak et aI., 2000). This gene is related not only to disease but can be used as a selectable marker. TheHPRTenzyme is involved in the purine salvage pathway, maintaining purine nucleotide pools in cells (Krenitsky et aI., 1969; Stout and Caskey, 1985). Thus,HPRTmutants that alter physiological function of the gene product can be selectedin vitroby their ability to grow in the presence of purine analogs, such as 6-thioguanine (6TG). 6TG is toxic when incorporated into acell's DNA (Stout and Caskey, 1985).
An en masseselection-based method has been developed for analysis of point
mutational spectra in selectable genes, such asHPRT, in vitro (Keohavong and Thilly, 1992a). Human cells are exposed to each test mutagen ofa fixed condition, and mutant cells resistant to a selecting agent (6TG) are en masse selected. After polymerase chain reaction (PCR) amplification of a chosen target, selected and amplified mutants are analyzed by denaturing gradient gel electrophoresis (DGGE). DGGE is a DNA separation technique, which differentiates mutant from wild-type sequences based on differences in their melting temperatures (Fischer and Lerman, 1983).
This combined method ofen masse selection, PCR, and DGGE allows detection of mutations, each representing as low as 1% of selected cells (2::10-2), with statistical significance (±20% precision) (Keohavong and Thilly, 1992a). The advantage of this en masseselection-based method over a clone-by-clone approach is its ability to analyze all detectable point mutations in a chosen target simultaneously. Generating the same outcome by aclone-by-clone approach requires DNA sequencing of numerous mutant clones that are individually selected, thereby making the analysis rather laborious.
The combined method ofen masseselection, PCR, and DGGE has been applied to analysis of point mutational spectra in a human lymphoblastoid line, TK6. Figure 1 illustrates the distributions of hotspot point mutations with regard to position, kind, and frequency in apart of the human HPRTgene. These distributions show that the point mutational spectra in a cultured human cell system are characterized by test mutagens to which the system is exposed. The test mutagens are ICR-191, N-methyl-N'-nitro-N-nitrosoguanidine (MNNG), ultraviolet light (UV), and benzo[a]pyrene 7,8-diol-9,10-epoxides (BPDE). Such mutagen-specific mutational spectra are shown to be different from the spontaneous spectrum (see Figure 1).
More importantly, different mutagen-exposure conditions produce different point mutational spectra. As Figure 2 shows, the AHH-l human lymphoblastoid line exposed to benzo[a]pyrene(BP)under conditions differing in concentration and duration
produced dissimilar point mutational spectra.
These results based on phenotypic selection indicate that mutational spectra observed in cultured human cells treated with a mutagen at high dose(s) for a short term cannot be used to predict human in vivo mutagenesis. Thus, understanding ofhuman in vivo mutagenesis requires mutational analysis in human tissues. However, mutation detection methods based on phenotypic selection are limited to selectable genes, such as HPRT, and certain tissue types, such as blood. For these reasons, genotype-based methods are necessary for analysis of mutational spectra in a larger pool of target genes and tissues.
Figure 1. Mutagen-specific point mutational spectra in human cells (TK6) Human cells, TK6, were exposed to each test mutagen of a fixed condition or left untreated. Mutant cells resistant to 6TG were then en masse selected. After peR amplification of a chosen target, selected and amplified mutants were analyzed by DGGE. DGGE allows analysis of point mutations with regard to position, kind, and frequency in a chosen DNA sequence, thereby generating point mutational spectra.
Sources: ICR-191 and MNNG (Cariello et aI., 1990); BPDE (Keohavong and Thilly, 1992b); UV (Keohavong et aI., 1991); Spontaneous (Oller and Thilly, 1992).
Figure 2. BP exposure condition-specific point mutational spectra in human cells (ARR-I)
Human cells, AHHl, were treated with BP of different concentrations for different periods of time. Mutant cells resistant to 6TG were then en masse selected. AfterpeR amplification of a chosen target, selected and amplified mutants were analyzed by DGGE. DGGE allows analysis of point mutations with regard to position, kind, and frequency in a chosen DNA sequence, thereby generating point mutational spectra.
20nMx 20 d ,...-4 ~ "'0Q) 0 ~ /\ ~ /\ /\ I ,.0 I I 0 I ~ d ~ 2
a
215 265 315 4 0.5 ~x6d (/"J ~ ,...-4 ,...-4 A Q) 'I"""""l U 2 ~ I Q)b
~ ~ "'0 ~ /\ ..0~ \0 I I ~ ~ r:--0 215 265 315 4 U 30~x28 h U 1\ I C ~ 2 ~A ~ /\I Ij
;d
d 0 I I 215 265 3152.1.3 Point mutational spectra in human mitochondrial DNA in vitro and in vivo
Using a genotype-based mutation detection method, point mutational spectra in a part of hllman mitochondrial DNA have been analyzed in a variety of human samples,
including normal tissues (Khrapko et aI., 1997a; Coller et aI., 1998; Marcelino et aI., 1998). This section reviews studies related to such analysis and summarizes the analysis results, allowing understanding of human mitochondrial mutagenesis.
The human mitochondrial genome, distinct from~he nuclear genome, is a circular, double-stranded DNA of 16, 569-bp, inherited from the mother (Giles et aI., 1980; Anderson et aI., 1981; Attardi and Schatz, 1988). It encodes for 13 protein subunits that are involved in synthesizing the respiratory chain complex (Anderson et aI., 1981; Attardi and Schatz, 1988). It also encodes for 2 ribosomal RNAs (rRNAs) and 22 transfer RNAs (tRNAs) essential for mitochondrial protein synthesis (Anderson et aI., 1981; Attardi and Schatz, 1988). Many mitochondrial mutations have been found to be associated with human aging and disease (Kogelnik et aI., 1998; Chinnery and Turnbull, 1999; Wallace,
1999; Cottrell et aI., 2000).
When analyzing mutations in human samples, two factors make mitochondrial DNA a more attractive target than nuclear DNA. The first is its ffiulticopy nature: it is present as a few hundred to a thousand copies per cell (Robin and Wong, 1988; Marcelino et aI., 1998; Khrapko et aI., 1999). This multicopy nature allows detection of mitochondrial mutations using a smaller sample size than that necessary for single copy nuclear mutations. Assuming a thousand mitochondrial DNA copies per cell, a thousand times smaller sample size is expected to be necessary for detection of mitochondrial mutations compared to that required for nuclear mutations of the same fraction. The second factor is the higher mutation rate observed for mitochondrial DNA compared to that for nuclear DNA (Khrapko et aI., 1997a). This factor is expected to generate higher mitochondrial mutant fractions in organ tissues. This expectation suggests that a means of analyzing mitochondrial mutations does not have to be as sensitive as is necessary for nuclear mutations.
A genotype-based method has been developed for analysis of point mutations in 100-bp multicopy sequences (e.g., ~1000copies per cell) (Khrapko et al., 1997b). The
sensitivity of this method is 10-6, detecting at least 102copies of each mutant in the
presence of 108copies of the wild-type. This method is based on constant denaturant gel electrophoresis (eDGE), hifi-PCR, and CDCE. CDGE (Hovig et aI., 1991) and CDCE (Khrapko et aI., 1994a), both derived from DGGE, separate mutant from wild-type sequences based on differences in their melting temperatures.
For mutational analysis by this genotype-based method, human genomic DNA is restriction digested to liberate a chosen target. Mutations in a chosen target from the wild-type are then separated by eDGE, followed by elution of these separated mutations. These separation and elution procedures allow genotype-based enrichment of mutant sequences relative to the wild-type. Mutant-enriched samples are PCR amplified and are separated by CDCE for further mutant enrichment. PCR is then performed prior to mutational analysis by CDCE.
This combined method of CDGE,peR,and CDCE has been applied to measure mitochondrial point mutational spectra in a variety of human samples (Khrapko et al., 1997a; Coller et aI., 1998; Marcelino et aI., 1998). In the study of Khrapko et a1. (1997a), normal human tissues, their derived tumors, and human cells grown under pristine
conditions were analyzed. In all of these samples, the same set of 17 point mutations with regard to position and kind was observed in a 100-bp mitochondrial sequence. Most of these mutations are G to A and A to G transitions, with the average mutant fractions ranging from 10-6to 4 X10⁻⁴. When the same mitochondrial sequence was analyzed in human bronchial epithelial cells of smoking and nonsmoking twins, the same set of 17 point mutations as in Khrapko et a1. (1997a) was observed (Coller et aI., 1998). In addition, Coller et a1. (1998) observed no increase in the overall mutant fractions in the smokers' samples compared to those in the nonsmokers'. These studies suggest the spontaneous origin of the observed human mitochondrial point mutations.
DNA replication errors and endogenous damage have been hypothesized as probable spontaneous sources of the set of mitochondrial point mutations observed in Khrapko et a1. (1997a), as well as in Coller et a1. (1998) (Khrapko et aI., 1997a; Marcelino and Thilly, 1999). To date, one of the hypotheses has been tested using human DNA polymerase
y
and using the same mitochondrial sequence studied in Khrapko et al.polymerase y-generated hotspot point mutations was determined to be the same as those observed in Khrapko et a1. (1997a) and Coller et a1. (1998). DNA polymerase
y
is the only known polymerase responsible for replicating human mitochondrial DNA (Shadel and Clayton, 1997).These mutational studies suggest the spontaneous origin of human mitochondrial mutation. While the same type of studies remains to be completed for nuclear sequences, such studies are hindered by the lack of a general and sensitive means of measuring mutations in normal tissues. A desired means should permit measurement of rare nuclear mutations in the presence of their abundant wild-type and should be general to the human genome.
2.2 Nuclear genes associated with humancancer
Mutational analysis of nuclear genes in human tissues is necessary to understand human nuclear mutagenesis. Proto-oncogenes and tumor suppressor genes are the
primary nuclear genes of interest since many mutations in these genes have been found to be associated with human cancer (Bos, 1989; Beroud et aI., 2000; Krawczak et aI., 2000). Cancer is the one of the leading causes of death in the United States (Vital statistics of the United States). This section reviews studies on these primary nuclear genes of interest.
Oncogenes are mutant forms of their normal genes, proto-oncogenes (Diamandis, 1997). The normal gene products are mainly involved in signaling pathways, positively regulating cell division (Wynford-Thomas, 1991; Yarbo, 1992; Baserga et aI., 1993). Mutations in proto-oncogenes can deregulate cell growthbyexpressing an increased level of the gene products, leading to malignant transformation (Wynford-Thomas, 1991; Diarnandis, 1997). Such mutations are called gain-of-function, or activating, mutations (Haber and Fearon, 1998). Oncogenes are thought to be 'dominant' genes since one mutated allele is capable of transforming cells (Diamandis, 1997).
Unlike oncogenes, tumor suppressor genes are thought to be 'recessive' genes since mutations in both alleles are necessary for malignant transformation (Brown, 1997; Diamandis, 1997). Most tumor suppressor genes are negative regulators of cell growth and development. Mutations in these genes can free cells from negative growth signals
and lead to malignant transformation (Weinberg, 1991; Wynford-Thomas, 1991; Yarbro, 1992; Brown, 1997). Such mutations are called loss-af-function, or inactivating,
mutations (Brown, 1997; Haber and Fearon, 1998).
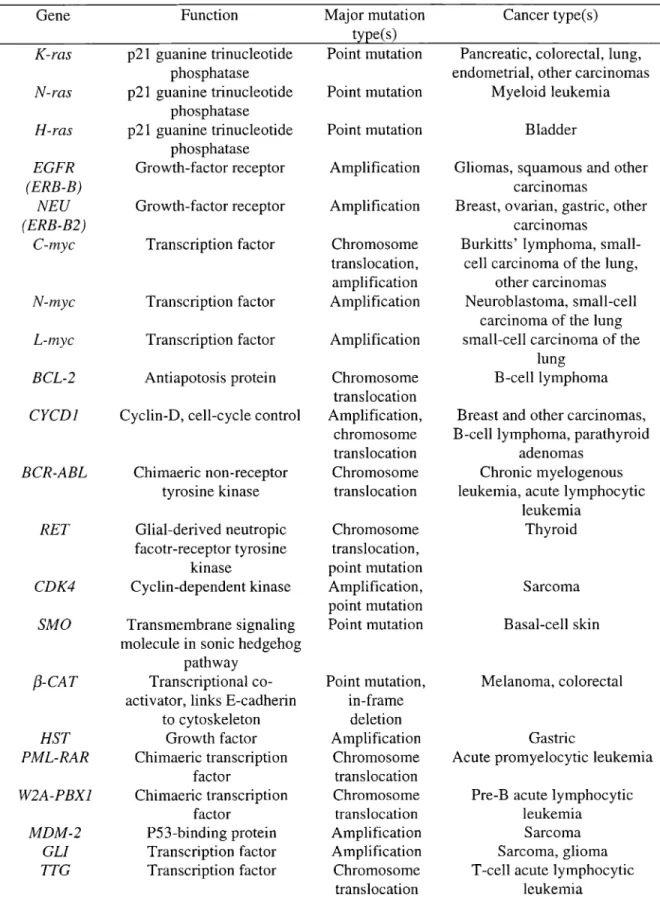
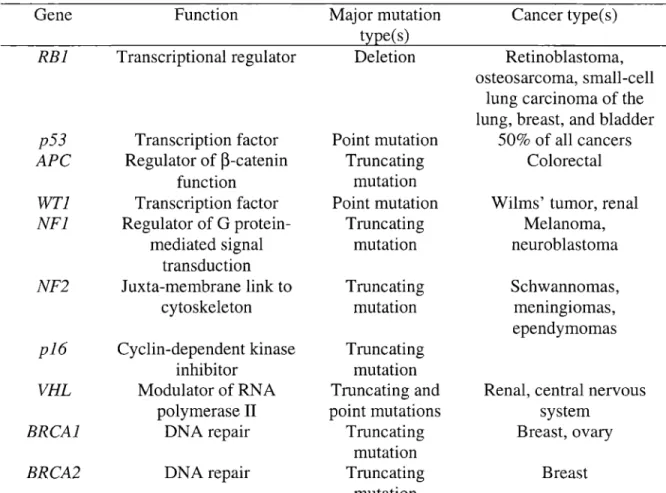
Tables 1 and 2 summarize the characteristics of selected human proto-oncogenes and tumor suppressor genes, respectively. The major mutation type(s) found in cancer is specific to each gene. In addition, each gene is associated with one, or multiple cancer types or multiple genes are associated with one cancer type. Thus, gene, mutation type, and tissue type of interest should be considered together when planning mutational analysis in human tissues.
2.3 Nuclear mutations associated with human disease
Many mutations in nuclear genes have been found to be associated with a variety of human diseases (Beroud et aI., 2000; Krawczak et aI., 2000). Studies on mutations associated with human disease can be used as a guide when planning mutational analysis of a variety of human samples, including normal tissues. This section reviews studies on nuclear mutations foundin either inherited or somatic cases of human disease.
2.3.1 Irlherited mutations
A comprehensive core collection of published germline mutations associated with human disease has been compiled as a database, the Human Gene Mutation Database (HGMD) (Cooper et aI., 1998; Krawczak et aI., 2000). Somatic gene mutations and mitochondrial genome mutations are not included in this database. To date, the database comprises over20, 000 different mutations, each found in coding, regulatory, or splicing-relevant regions of about 1,000 different nuclear genes.
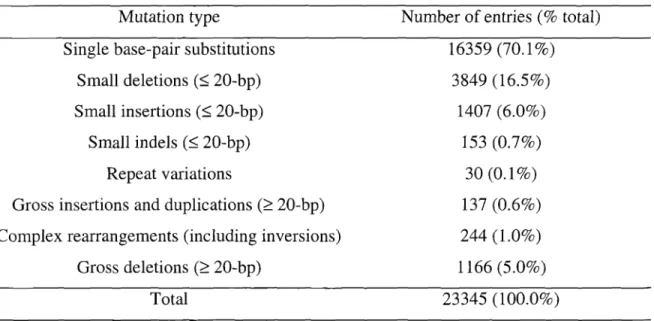
When the HGMD entries were sorted by mutation type, a hierarchy was found, as Table 3 summarizes (Cooper et aI., 1998; Krawczak et aI., 2000). Point mutations are the major mutation type observed. Point mutations include single base-pair substitutions
Table 1. Characteristics of selected human proto-oncogenes
Gene Function
K-ras p21 guanine trinucleotide
phosphatase
N-ras p21 guanine trinucleotide
phosphatase
H-ras p21 guanine trinucleotide
phosphatase
EGFR Growth-factor receptor
(ERB-B)
NEU Growth-factor receptor
(ERB-B2)
C-lnyc Transcription factor
N-lnyc Transcription factor
L-lnyc Transcription factor
BCL-2 Antiapotosis protein
eyeD}
Cyclin-D, cell-cycle controlBCR-ABL RET CDK4 SMO {3-CAT HST PML-RAR W2A-PBXl MDM-2 GLI TTG Chimaeric non-receptor tyrosine kinase Glial-derived neutropic facotr-receptor tyrosine kinase Cyclin-dependent kinase Transmembrane signaling molecule in sonic hedgehog
pathway Transcriptional co-activator, links E-cadherin
to cytoskeleton Growth factor Chimaeric transcription factor Chimaeric transcription factor P53-binding protein Transcription factor Transcription factor Major mutation type(s) Point mutation Point mutation Point mutation Amplification Amplification Chromosome translocation, amplification Amplification Amplification Chromosome translocation Amplification, chromosome translocati on Chromosome translocation Chromosome translocation, point mutation Amplification, point mutation Point mutation Point mutation, in-frame deletion Amplification Chromosome translocation Chromosome tran sIocation Amplification Amplification Chromosome translocation Cancer type(s) Pancreatic, colorectal, lung, endometrial, other carcinomas
Myeloid leukemia Bladder
Gliomas, squamous and other carCInomas
Breast, ovarian, gastric, other carCInomas
Burkitts' lymphoma, small-cell carcinoma of the lung,
other carcinomas Neuroblastolna, small-cell
carcinoma of the lung small-cell carcinoma of the
lung B-celllymphoma Breast and other carcinomas, B-celllymphoma, parathyroid
adenomas Chronic myelogenous leukemia, acute lymphocytic
leukemia Thyroid Sarcoma Basal-cell skin Melanoma, colorectal Gastric
Acute promyelocytic leukemia Pre-B acute lymphocytic
leukemia Sarcoma Sarcoma, glioma T-cell acute lymphocytic
leukemia Adapted from Haber and Fearon, 1998; Verma and Triantafillou, 1998.
Table 2. Characteristics of selected human tumor suppressor genes Gene RBi p53
APe
WTi NFl NF2pi6
VHL BRCAl BRCA2 Function Transcriptional regulator Transcription factor Regulator of~-catenin function Transcription factor Regulator of G protein-mediated signal transduction Juxta-membrane link to cytoskeleton Cyelin-dependent kinase inhibitor Modulator of RNA polymeraseII DNA repair DNA repair Major mutation type(s) Deletion Point mutation Truncating mutation Point mutation Truncating mutation Truncating mutation Truncating mutation Truncating and point mutations Truncating mutation Truncating mutation Cancer type(s) Retinoblastoma, osteosarcoma, small-celllung carcinoma of the lung, breast, and bladder
50% of all cancers Colorectal
Wilms' tumor, renal Melanoma, neuroblastoma
Schwannomas, menIngIomas, ependymomas
Renal, central nervous system
Breast, ovary
Breast
Table 3. Number of HGMD entries by mutation type
Mutation type Number of entries (% total) Single base-pair substitutions 16359 (70.1%)
Small deletions (~20-bp) 3849 (16.5%)
Small insertions (::=;20-bp) 1407(6.0%)
Smallindels (~20-bp) 153 (0.70/0)
Repeat variations 30 (0.1 %)
Gross insertions and duplications (~20-bp) 137 (0.6%) Complexrearrangements (including inversions) 244 (1.0%)
Gross deletions (~20-bp) 1166 (5.0%)
Total 23345 (100.0%)
sorted by nucleotides with respect to their propensity to undergo substitution. Table 4 summarizes this hierarchy: G (38.4%) >C (32.2%) >T (17.0%)>A (12.4%) (Krawczak et aI., 1998). Among these substitutions, transitions (62.5%) are dominant over
transversions (37.50/0) (Krawczak et aI., 1998).
Based on analysis of the HGMD entries, it has been hypothesized that these mutations are mainly the result of endogenous mutagenic processes (Krawczak et aI., 1998). Such processes include spontaneous deamination of 5-methylcytosine (5-mC) and
misalignment mutagenesis during DNA synthesis. These processes can potentially generate point mutations.
Spontaneous deamination of 5-mC has been hypothesized to be a cause of C to T and G to A transitions at CpG dinucleotides (Krawczak et aI., 1998). These mutations account for 23% of all HGMD single base-pair substitutions and for36.90/0 of HGMD transitions found in gene-coding regions (Krawczak et aI., 1998). In vertebrate genomes, about 3 to 4% of all cytosines are methylated (5-mC), with 90 to 100% of these 5-mC occurring in the sequence CpG (Riggs and Jones, 1983; Antequera and Bird, 1993). It has been shown that 5-mC undergoes spontaneous deamination, forming thymine, at a rate much higher than the deamination of cytosine, forming uracil (Shen et aI., 1994). The formed uracil can be removed by uracil-glycosylase (Lindahl, 1982). However, the formed thymine, when left unrepaired, basepairs with adenine, converting amethyl CpG sequence into TpG (Antequera and Bird, 1993; Gonzalgo and Jones, 1997). Base excision repair of U:G mismatches has been shown to be up to 6000-fold more efficient than that of T:G mismatches when tested with extracts from human tissues (Schmutte et aI., 1995). In brief, the hypermutability ofCpG dinucleotides is likely caused by
spontaneous deamination of 5-mC combined with inefficient repair of the resulting premutagenic DNA mismatches.
In addition to spontaneous deamination of 5-mC, misalignment mutagenesis during DNA synthesis has been also hypothesized as a cause of point mutations (Krawczak et aI., 1998). Eukaryotic DNA polymerases have been shown to generate point mutationsin vitro, presumably as a result of template-primer misalignments in addition to
Table 4. Spectrum of HGMD single base-pair substitutions in gene-coding regionsa
Number of substitutions by
Original T C A G Total(% total)
nucleotide T 654 271 312 1,237 (17.0%) C 1,632 (940)b 371 340 2,343 (32.2%) A 201 163 538 902 (12.40/0) G 619 453 1,717 (735)C 2,789 (38.40/0) Total 2,452 1,270 2,359 1,190 7,271 (100.0%)
aAdapted from Krawczak et aI., 1998.
bNumber in parentheses is C to T transitions atCpGdinucleotides.
rates depending on polymerases and neighboring nucleotides (Kunkel, 1985; Kunkel, 1990; Kunkel, 1992).
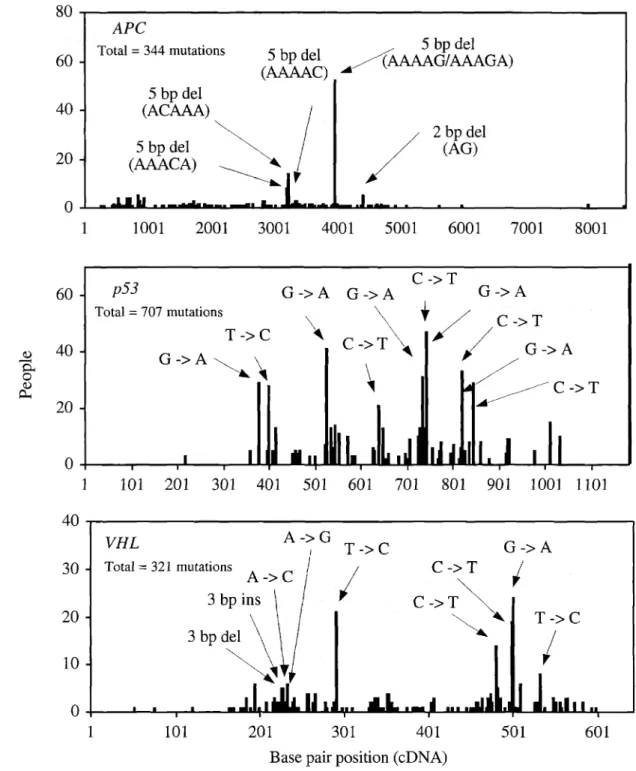
Point mutations have also been found to be the major mutation type when germline mutations associated with human cancer were sortedby type in individual tumor suppressor genes (Beroud et aI., 2000). Among these point mutations, the predominant mutations are small deletions in the adenomatous polyposis coli(APC) gene (Laurent-Puig et aI., 1998; Muniappan, unpublished results) and single base-pair substitutions in thep53gene (Beroud and Soussi, 1998), as well as in the von Rippel-Lindau(VHL) gene (Beroud et al., 1998). These predominant point mutations are distributed throughout each gene-coding region, as Figure 3 illustrates.
While point mutations are not the only mutation type associated with human disease, analysis of HGMD entries suggests point mutations as the primary mutation type to be studied. Thus, methods of measuring point mutations are the methods of choice when planning analysis of inherited mutations in a variety of human samples.
2.3.2 Somatic mutations
Studied on gene-specific mutations associated with human disease can be used as a guide when choosing a target gene sequence, in additionto the primary mutation type to be analyzed. This section reviews studies on nuclear gene-specific mutations found in somatic cases of human cancer.
2.3.2.1 Gene-specific mutations
Published somatic mutations associated with human disease have been compiled as a database, the Universal Mutation Database (UMD) (Beroud et aI., 2000). This database allows creating and analyzing gene-specific mutation databases. The UMD has been adapted to 13different nuclear genes, most of which are tumor suppressor genes.
When the UMD somatic mutations in tumor suppressor genes in cancer were analyzed by mutation type, point mutations were observed to bethe major type (Beroud et aI.,
80
~---60
APe
Total=344 mutations 5 bp del
5 bp del ~~AAAAG/AAAGA) (AAAAC) 8001 7001
6001
2 bp del (AG) 50014001
3001
20011001
5 bp del (ACAAA)I
5bpdel~
(AAACA)~,
O...1..-...III...&...-... . .L.IiIIIa~~~. . . .-... . . & . . . . - - - - a - - - - l L . . . . - - - -_ _.L---IIII
1 20
40
C ->T G->A G->A G->A\
~
f /
C->T C->T.... / G->A\
T->C G->A~\ p53 Total=707 mutations O-+---...---,.---~... ~---..-1 101 201 301 401 501 601 701 801 901 1001 1101 2040
60
G->A C->TI
C->T~
~
VHL 30 Total == 321 mutations 2010
40
- r - - - . 601 501 401 301 201 101O-l--...L-~...-JL.- L.IIIIJJI4ll. .L...U...a..a...- -...-...u.LJ~...-LJDl.JU-IJ_..._---J
1
Base pair position (eDNA)
Figure 3. Distribution of germline point mutations in tumor suppressor genes in human cancer
Sources: Beroud et aI., 1998; Beroud and Soussi, 1998; Muniappan, unpublished results: collection of publishedAPemutations· observed when the entire coding region was analyzed.
UMD somatic entries were sorted by the following two categories: mutations leading to truncated proteins (MLTP) and missense mutations (Beroud et aI., 2000) (MLTP includes nonsense mutations, as well as out of frame deletions and insertions). For example, MLTP accounts for 95% of the APC mutations, 71% of the VHL mutations, and 77% of the WT] mutations (Beroud et aI., 1998; Jeanpierre et aI., 1998; Laurent-Puig et aI., 1998; Gallou et aI., 1999; Beroud et aI., 2000). Missense mutations account for 80% of the p53 mutations (Beroud and Soussi, 1998; Beroud et aI., 2000). These results suggest that differential gene-inactivating mechanisms playa role in tumor formation.
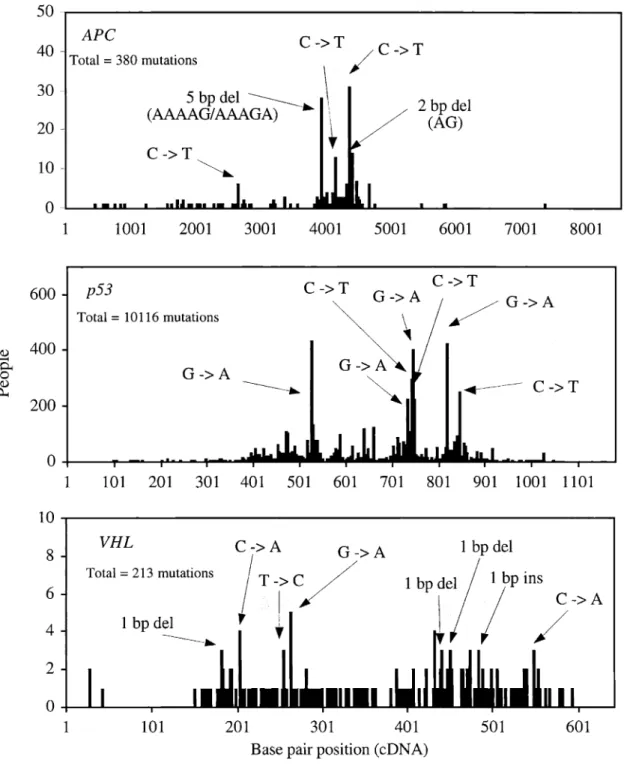
In addition to gene-specific mutations, differential gene-mutation distribution is also observed. For example, the majority of ras mutations found in human cancer are clustered in a small number of codons (Bas, 1989). On the other hand, other cancer-related gene mutations, such as APC, p53 and VHL, are scattered throughout a larger number of codons (Beroud et aI., 1998; Laurent-Puig et al., 1998; Hernandez-Boussard et aI., 1999b). Figure 4 illustrates the distribution of somatic mutations in the APe, p53, and VHL genes in human cancer.
Analysis of somatic mutations associated with human cancer suggests point mutations as the primary mutation type to be studied when planning analysis of somatic mutations in a variety of human samples. In addition, a careful selection of target-gene sequences is suggested. For certain genes like APe, p53, and VHL, the entire gene-coding regions can be selected as a target since the observed mutations are scattered throughout each coding region. On the other hand, analysis should be limited to certain parts of gene-coding regions for other genes like ras (the observed ras mutations are clustered in a small number of codons).
2.3.2.2 p53mutations
The p53 gene has the highest number of mutations among the gene mutations in the UMD (Beroud et aI., 2000). For this reason, this section reviews studies related to p53 somatic mutations associated with human cancer. This section focuses on hypotheses made regarding causes of the p53 mutations and discusses limitations of these studies in
50
---r---,.
8001 7001 6001 2 bp del (AG) 5001 4001 3001 2001 1001o
-r...-...l...oIl..-. . . .. . . . - ._ _. - . - . . - . . . .. . . ._ _ _ 1 20 30 10-APe
40 - C->
T C->
T Total=380 mutations / 5 bp del:-:-:----~
\ (AAAAG/AAAGA) 600 p53 Total= 10116 mutations C->T G->A\
101 201 301 401 501 601 701 801 901 10011101 G->A 601 501 . - - - - C->T 1 bp dellPin;->A
Cj>AG->A
j
T ->C /I
~
I,
201 301 401Base pair position (eDNA) 101 VHL Total= 213 mutations t1) 400 ~ ~ 0 (1) ~ 200 0 1 10 8 6 4 2 0 1
Figure 4. Distribution of somatic point mutations in tumor suppressor genes in human cancer
Sources: Beroud et aI., 1998; Hemandez-Boussard et aI., 1999b; Muniappan, unpublished
results: collection of publishedAPemutations observed when the entire coding region was
The human tumor suppressor genep53 lies on chromosome 17p13 (Levine et al.,
1991; Akashi and Koeffler, 1998). This gene is 20-kb in length and consists of 11 exons, with the gene product being mainly a negative regulator of the cell cycle (Levine et aI., 1991; Akashi and Koeffler, 1998). Manyp53 mutations have been found to be associated
with various cancer types (Hainaut et aI., 1998; Hernandez-Boussard et aI., 1999b). For most cancer types, 20 to 50% of cases have been shown to carryap53 mutation(s)
(Greenblatt et aI., 1994).
One of the databases comprising publishedp53 mutations associated with human
cancer is maintained at the International Agency for Research on Cancer (IARe), the
IARCp53 mutation database (Hainaut et aI., 1998; Hernandez-Boussard et aI., 1999b).
To date, more than 10,000 somaticp53 mutations have been entered into this database.
Most of these mutations are in the gene-coding region. Among IARe mutations 87.2% are single base-pair substitutions, and the remaining 12.8% are small insertions and deletions, as well as complex mutations (Hernandez-Bolissard et aI., 1999b). Over900/0
of all IARe mutations are clustered within the central portion of thep53 gene-coding
region (Soussi et aI., 1990; Hernandez-Boussard et aI., 1999b). This portion is domains of highly conserved sequences through evolution and consists of the DNA binding domain of the protein, essential top53 functional activity (Cho et aI., 1994).
Analysis of publishedp53 point mutations in all human cancer types has shown that
about 50% of the mutations are G to A transitions, with over500/0residing within CpG dinucleotides (Soussi et al., 2000). Spontaneous deamination of 5-mC has been
hypothesized to be a cause of such transition mutations in epG sequences (Greenblatt et aI., 1994) (Section 2.3.1 discusses hypermutability of epG dinucleotides). It has been demonstrated that all of the CpG sites in the humanp53 coding sequence investigated are
methylated in all tissue types studied (Tornaletti and Pfeifer, 1995). This demonstration supports the hypermutability of the epG-dinucleotide hypothesis.
However, analysisbycancer type of these publishedp53 point mutations has
suggested a link between carcinogen exposure and human cancer (Hussain and Harris, 1998; Soussi et aI., 2000). In these studies, tissue-specificp53 mutations were observed,
smoke in lung cancer, and CC to TT dipyrimidine mutations and sunlight exposure in skin cancer.
A G to T transversion at the third position ofp53codon 249 (AGG
->
AGT) is the dominantp53 mutation observed in human liver cancer and has been linked to dietary AFB1(Hussain and Harris, 1998; Hernandez-Boussard et aI., 1999b; Soussi et aI., 2000). This link has been supported by an observation in which a positive dose-responsecorrelation was found between estimated dietary AFB} exposure and the frequency of this mutation in normal-appearing liver samples from hepatocellular carcinoma patients with different AFB}-exposure levels (Aguilar et al., 1994). AFB} exposure to human cells in
vitro has shown to inducep53mutations at positions other than the third of codon 249
(Aguilar et aI., 1993; Mace et aI., 1997). In addition, analysis of formed AFB} adducts in thep53 gene has shown major adduct sites at positions other than codon 249 (Denissenko et aI., 1998). These studies suggest that additional mechanisms, such as infection with hepatitis B virus, may be required for selection of the G to T transversion at the third position ofp53 codon 249 in human liver cancer (Denissenko et aI., 1998).
The predominantp53mutations observed in human lung cancer are G to T
transversions (Hernandez-Boussard et aI., 1999b). This observation is compatible with the role of exogenous carcinogens present in cigarette smoke, such as BP. The three most frequently reportedp53 mutations of this kind in human lung cancer are at codons 157,248, and 273 (Hernandez-Boussard et aI., 1999b). A G to T transversion at one of these codons, codon 248 (CGG
->
CTG), has been shown to be generated as a result of BP exposure to human cells in vitro (Cherpillod et aI., 1995). In addition to cigarette-smoke exposure, formation of many BPDE-DNA adducts has been shown to be strongly enhanced by methylation of CpG sites in thep53 gene (Denissenko et aI., 1996;Denissenko et aI., 1997; Chen et aI., 1998). When HeLa cells and human bronchial epithelial cells were treated with BPDE, this agent selectively induced guanine adduct formation at CpG sitesinp53codons 157,248, and 273, in accordance with thep53
mutational hotspot codons observed in human lung cancer (Denissenko et aI., 1996). Thus, two different 5-mC pathways appear to playa role inp53mutagenesis associated with human cancer: increased affinity of methylated CpG sites for DNA-reactive molecules in addition to spontaneous deamination of 5-mC (Pfeifer et aI., 2000).
Analysis ofp53 mutations observed in human lung cancer based on smoking status has
supported the hypothesis that cigarette smoking as a direct cause of these mutations in Hernandez-Boussard and Hainaut (1998), as well as in Hainaut and Pfeifer (2001). Another study has supported cigarette smoking as a source of selecting pre-existing mutations (Rodin and Rodin, 2000).
The commonality of tandem dipyrimidine CC to TT mutations in human squamous and basal cell skin carcinoma has been observed (Brash et aI., 1991; Ziegler et aI., 1993). A particularp53 mutation of this kind observed in human skin cancer has been analyzed
in normal-appearing skin samples from skin cancer patients with different sunlight-exposure levels (Nakazawa et aI., 1994; Ouhtit et aI., 1997). In these studies, a positive dose-response correlation between the sunlight-exposure level and the frequency of this mutation was observed. In addition to the indicative role of sunlight exposure,
preferential DNA-adduct formation and differential DNA repair rates appear to playa role in human skin cancer. Sites where preferential UV-adducts were formed in thep53
gene in human cells have been shown to correlate with thep53mutational hotspot codons observed in human skin cancer (Tornaletti et aI., 1993; Tommasi et aI., 1997). The majority of these hotspots also have been shown to suffer from slow DNA repair of UV-induced damage in human cells (Tornaletti and Pfeifer, 1994). These studies suggest that preferential DNA-adduct formation and repair rate have contributed to thep53 mutational
hotspots observed in human skin cancer.
However, hypotheses made based onp53 mutations observed in human cancer should
be evaluated carefully. More than 70% of the molecular studies focus on the central region of thep53 gene, exons 5though 8 (Hemandez-Boussard et aI., 1999b; Soussi et aI., 2000). In addition, many factors may influence detection and reporting of mutations, including selection of tumor samples, study design, and choice of methods (Hernandez-Boussard et aI., 1999a; Soussi et aI., 2000). Inter-individual variability in susceptibility to carcinogens also suggests that a single pathway is highly unlikely (Vineis et aI., 1999). For example, carcinogens form adducts with DNA, followed by DNA repair and
replication, rather than directly inducing specific point mutations (Vineis et aI., 1999). Moreover, mutations found in advanced tumors may notbe representative of the type of
addition, these mutations may not play any role in developing tumors (Strauss, 2000). Thus, mutational analysis in normal tissues must be performed to understand cause-and-effect relationships between environmental agents and human mutation. For such analysis, genotype-based methods of measuring mutations in nonnal tissues are
necessary. Such methods should pennit measurement of rare mutations in the presence of their abundant wild-type and should be general to the human genome.
2.4 Somatic nuclear mutations and mutant fractions in normal human tissues
Studies on mutations and mutant fractions observed in normal human tissues can be used as a guide when planning further mutational analysis of normal tissues. This section reviews studies on somatic nuclear mutations, as well as mutant fractions, observed in normal human tissues. The review focuses on point mutations since these mutations are the major mutation type observed in both inherited and somatic cases of human disease.
2.4.1 Phenotype-based analysis of HLA and HPRT mutations
For selectable genes, such as HLA and HPRT, mutation assays based on phenotypic
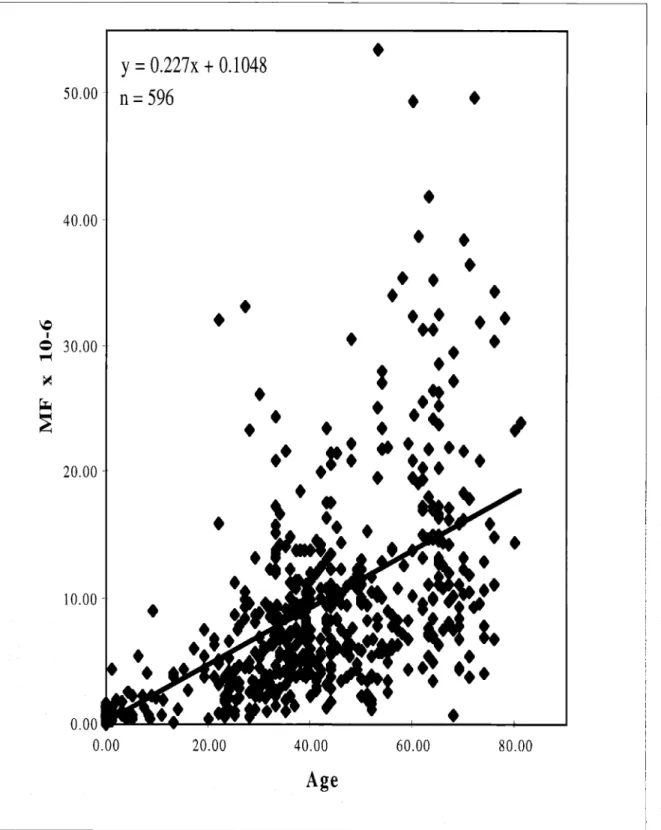
selection have been developed for analysis of human blood (Albertini et aI., 1982; Morley et aI., 1983; Albertini et aI., 1985; Janatipour et aI., 1988). Using such assays, a mutant fraction of about 10-5has been measured in both theHLA and HPRT genes in T-lymphocytes of middle-aged healthy individuals (Grist et aI., 1992; Robinson et aI., 1994; Akiyama et aI., 1995; Podlutsky et aI., 1998). These mutant fractions have been shown to increase linearly with age (Trainor et aI., 1984; Vijayalaxmi and Evans, 1984; Davis et aI., 1992; Grist et aI., 1992; Akiyama et aI., 1995; Green et aI., 1995). Figure 5 illustrates this increase in theHPRT gene.
Assuming a target size of about 1000-bp for both theHLA and HPRT genes, the
expected average mutant fraction per bp inT-lymphocytes of middle-aged healthy individuals is about 10-8. Any hotspot mutations occurring 10 to 100 times more
frequently than expectedbychance would then appear in these genes at fractions between 10-7 and 10-6. Such hotspot mutations in theHPRT gene in cultured human cells have
y
=
O.227x
+
0.1048
50.00 -n =
596
t
t
80.00 60.00 40.00 20.00t
0.00 0.00 10.00-t
40.00-t
t
t
t
t
t t
\Ct
It
t
=
30.00 -~ ~I
~t
t
t
~
t
I
20.00 -tt
t
Age
Figure 5. HPRTmutant fraction vs. age in T-lymphocytes of healthy individuals
been shown to represent between 10 and 50% of the point mutations that affect the physiological function of the gene product (Kat, 1992; Mitchell, 1999; Tomita-Mitchell et aI., 2000).
Clone-by-clone analysis of 6TG-resistantHPRT mutants in T -lymphocytes of healthy
individuals has shown that, at birth, the predominant mutation type is large structural alterations (85%), mostly deletions (McGinniss et aI., 1989). These deletion mutations are thought to be mediated by V(D)J recombinase acting on sequences within theHPRT
gene that resemble theV(D)Jrecombinase signal sequences (Fuscoe et aI., 1991; Finette et aI., 1996~ Fuscoe et aI., 1997). As people age, the predominant mutation type changes to point mutations (85%), with the remaining 150/0being large structural alterations (Albertini et aI., 1990; Lippert et aI., 1990; Albertini et aI., 1993; Cariello and Skopek, 1993a; Albertini and Hayes, 1997). These observations indicate that factors other than V(D)J recombinase playa role in causing mutations in people as they age.
Published 6TG-resistantHPRT mutations observed in T -lymphocytes of healthy
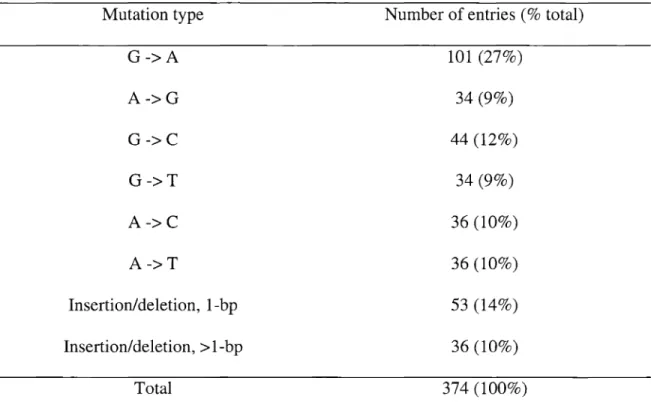
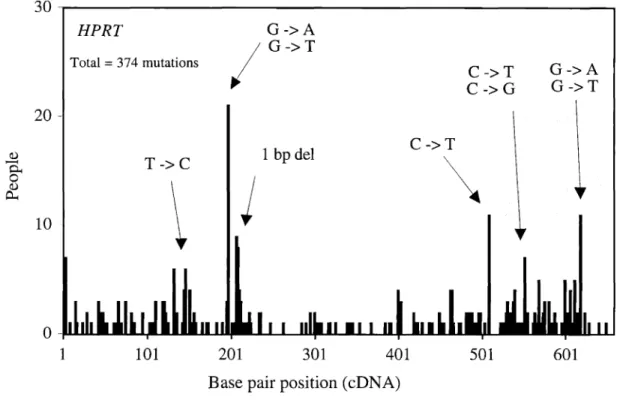
individuals have been compiled as a database (Cariello et aI., 1998). Table5summarizes these mutations by mutation type and corresponding number. Figure6 illustrates the distribution of these mutations. Single base-pair substitutions account for 76% of all mutations, with the remaining24%being deletions and insertions. Among single base-pair substitutions, transversions (41 %) are slightly more common than transitions (36%). In addition, mutations at GC base pairs (48%) are more common than mutations at AT base pairs (29%). G toA transitions are the most common type of mutation, accounting for 27% of all mutations.
TheHPRT database does not seem to pinpoint any particular kind of exogenous agent
as the cause for these mutations. For example, when kinds and positions ofHPRT
mutations observed in smokers were compared to those of nonsmokers, no significant differences were observed between the two sub-populations (Vrieling et aI., 1992; Burkhart-Schultz et aI., 1996; Curry et aI., 1999; Podlutsky et aI., 1999). Thus, these studies imply thatHPRT mutations in healthy populations are endogenous in origin or
induced by ubiquitous environmental exposures (Podlutsky et aI., 1998; Podlutsky et aI., 1999).
Table 5. Summary of somatic mutations inHPRTgene in T-Iymphocytes of healthy individuals
Mutation type Number of entries (% total)
G->A 101 (27%) A->G 34 (9%) G->C 44 (12%) G->T 34(9%) A->C 36 (10%) A->T 36 (10%) Insertion/deletion, 1-bp 53 (14%) Insertion/deletion, > 1-bp 36 (10%) Total 374 (100%)
Source: Cariello et aI., 1998; courtesy of Dr. A. Tomita-Mitchell; based on 6TG selection and clone-by-clone analysis.
30
HPRT G->A Total= 374 mutations / G->T C->T G->A ~ C ->G G->T20
-1 bp del C->T Q.) T->C\
~ 0-4 0\
j
Q) ~10
-601
501
401
301
201
101
o
-~""'--"""""''-'-'--'''''''I.AAfIII--'''''''''''''''...a.aaII...-...----...----....-...-....~-.. 1Base pair position (eDNA)
Figure 6. Distribution of somatic mutations inHPRTgene in T-Iymphocytesofhealthy individuals
Source: Cariello et aI., 1998; courtesy of Dr. A. Tomita-Mitchell; based on 6TG selection and clone-by-clone analysis.
healthy individuals suggest the spontaneous origin of human HPRT mutation. While mutational studies of other nuclear genes in normal human tissues remain to be completed, such studies are hindered by the lack of general and sensitive methods of measuring mutations based on their genotype. Mutation detection methods based on phenotypic selection are limited to selectable genes, such as HPRT, and certain tissue types, such as blood. For these reasons, genotype-based methods are the methods of choice.
2.4.2 Phenotype-based analysis ofp53 mutations
Mutant forms of the p53 protein have been detected in skin tissues of healthy individuals (Ponten et aI., 1995; Jonason et aI., 1996; Tabata et aI., 1999). By using antibodies specific to p53, the mutant forms can be stained as individual patches (Gannon et aI., 1990; Iggo et aI., 1990; Baas et aI., 1994). In this assay,p53 mutants are
distinguished from the wild-type by their longer half life (Finlay et aI., 1988; Harris and Hollstein, 1993). Each compact pattern of the stained patches, a contiguous area of homogeneously stained cells, represents clones derived from a single cell with ap53
mutation (Jonason et aI., 1996; Ren et aI., 1996; Ren et aI., 1997). Between 50 and 70% of the patches have been shown to contain such clones (Jonason et aI., 1996; Ponten et aI., 1997; Ren et aI., 1997).
Using such a phenotype-based assay,p53 mutant fractions in skin tissues of healthy individuals can be estimated. Table 6 summarizes the estimated mutant fractions. On average, 33 and 3 p53-immunopositive patches per cm2of human skin have been
observed in sun-exposed and sun-shielded areas, respectively (Jonason et aI., 1996). By dividing these observed values by the stem cell number per cm2of skin, the p53 stem cell mutant fractions can be estimated. About 4.5 x 10⁶keratinocytes have been estimated per cm2of normal human skin (Pinkus, 1952; Bergstresser et aI., 1978; Weinstein et al.,
1984). And among these keratinocytes, between 2 and 10% have been found to be stem cells (Pinkus, 1952; Potten and Hendry, 1973; Potten, 1981; Potten and Morris, 1988). Using the stem cell number of 2.7 x 10⁵per cm2of human skin (median value: (4.5 x 10⁶
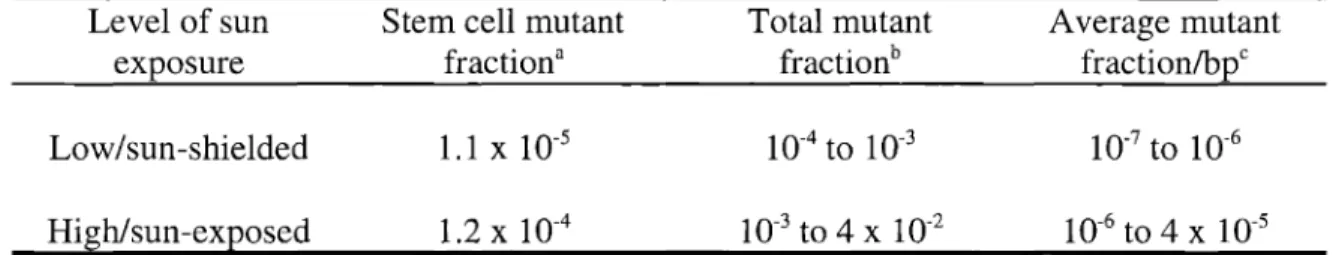
Table 6. Summary ofp53mutant fractions in skin tissues of healthy individuals
Level of sun exposure
Low/sun-shielded
Stem cell mutant fractiona 1.1 X 10⁻⁵ Total mutant fractionb Average mutant fractionlbpC High/sun-exposed 1.2x 10⁻⁴ 10-3to 4 X 10⁻² 10-6to 4 X 10⁻⁵
aOn average, 33 and 3 p53-immunopositive patches per cm2of human skin have been observed
in sun-exposed and sun-shielded areas, respectively (Jonason et aI., 1996). The stem cell mutant fractions were estimated by dividing these observed values by the stem cell number per cm2
of human skin, 2.7 x 10⁵.
bJonason et aI., 1996.
CAssuming a target size of about 1000-bp for thep53 gene, the average mutant fractions per bp
(2.7 X 10⁵))and 1.1
x
10-5(3 + (2.7x
105)) for sun-exposed and sun-shielded areas,respectively. In this estimation, all irnrnunopositive patches are assumed to be clones, each representing an individual mutant.
The totalp53mutant fractions are expected to be higher than the stem cell mutant fractions because of the clonally-derived nature of the immuopositivep53mutant patches (Jonason et aI., 1996~ Ren et aI., 1996~ Ren et aI., 1997). The total mutant fractions in skin tissues of healthy individuals have been estimated to be 10-3to 4X 10⁻²and 10-4to
10-3in sun-exposed and sun-shielded areas, respectively (Jonason et al., 1996) (see Table 6). Inthis estimation, the total mutant fraction was estimated by averaging the measured area of clones and then multiplying by the number of clones per cm2
.
Assuming a target size of about 1000-bp for thep53gene, the average mutant fractions per bp in skin tissues of healthy individuals are expected to be 10-6to 4
X 10-5 in
sun-exposed areas and 10-7to 10-6in sun-shielded areas (see Table6). Any hotspot mutations occurring 10 times more frequently than expectedby chance would then appear in this gene at fractions 10 times higher than the expected average mutant fractions for both sun-shielded and sun-exposed areas.
When the averagep53 mutant fractions per bp were compared, up to a 400-fold higher mutant fraction has been observed in sun-exposed relative to sun-shielded skin (Jonason et aI., 1996). On the other hand, another study showed no such difference (Guhtit et aI., 1998). This discrepancy is perhaps because one study was based on a particularp53
mutant (Ouhtit et aI., 1998), while the other was based on mutations in the entirep53
gene (Jonason et aI., 1996). Further mutational analysis in normal human skin is necessary to validate either study.
2.4.3 Genotype-based analysis of ras and p53 mutations
Several nuclear point mutations have been observed in tissues of healthy individuals without reference to phenotypic selection (Wilson et aI., 1999~ Ouhtit et aI., 1999; Wilson et aI., 2000; Li-Sucholeiki et aI., unpublished results). Either allele-specific PCR or restriction fragment length polymorphism (RFLP)/PCR (see Section 2.5.3.2) was used as