UNIVERSITÉ DE CLERMONT AUVERGNE - UFR DE MÉDECINE
THÈSE d’EXERCICE
pour le
DIPLÔME D’ÉTAT DE DOCTEUR EN MÉDECINE
SPÉCIALITÉ DE PNEUMOLOGIE
par
Mr PERROT Loïc
Présentée et soutenue publiquement le 8 octobre 2018
Prevalence of sarcopenia in chronic
obstructive patients hospitalized in
Pneumology at the CHU of Clermont-Ferrand
Président du Jury :
Professeur Denis CAILLAUD
Membres du Jury :
Professeur Yves BOIRIE
Professeur Frédéric COSTES
Docteur Annick GREIL
Docteur Nicolas FARIGON
UNIVERSITE CLERMONT AUVERGNE
___________________
PRESIDENTS HONORAIRES : JOYON Louis UNIVERSITE D’AUVERGNE : DOLY Michel
: TURPIN Dominique : VEYRE Annie : DULBECCO Philippe : ESCHALIER Alain
PRESIDENTS HONORAIRES : CABANES Pierre UNIVERSITE BLAISE PASCAL : FONTAINE Jacques
: BOUTIN Christian : MONTEIL Jean-Marc : ODOUARD Albert : LAVIGNOTTE Nadine
PRESIDENT DE L'UNIVERSITE et
PRESIDENT DU CONSEIL ACADEMIQUE PLENIER : BERNARD Mathias PRESIDENT DU CONSEIL ACADEMIQUE RESTREINT : DEQUIEDT Vianney VICE-PRESIDENT DU CONSEIL D'ADMINISTRATION : WILLIAMS Benjamin VICE-PRESIDENT DE LA COMMISSION DE LA RECHERCHE : HENRARD Pierre VICE PRESIDENTE DE LA COMMISSION DE LA
FORMATION ET DE LA VIE UNIVERSITAIRE : PEYRARD Françoise DIRECTEUR GENERAL DES SERVICES : PAQUIS François
²²²²²
UFR DE MEDECINE
ET DES PROFESSIONS PARAMEDICALES
DOYENS HONORAIRES : DETEIX Patrice : CHAZAL Jean
DOYEN : CLAVELOU Pierre
RESPONSABLE ADMINISTRATIVE : ROBERT Gaëlle
LISTE DU PERSONNEL ENSEIGNANT
PROFESSEURS HONORAIRES :MM. BACIN Franck - BEGUE René-Jean - BOUCHER Daniel - BOURGES Michel - BUSSIERE Jean-Louis - CANO Noël - CASSAGNES Jean - CATILINA Pierre - CHABANNES Jacques – CHAZAL Jean - CHIPPONI Jacques - CHOLLET Philippe - COUDERT Jean - DASTUGUE Bernard - DEMEOCQ François - DE RIBEROLLES Charles - ESCANDE Georges - Mme FONCK Yvette - MM. GENTOU Claude - GLANDDIER Gérard - Mmes GLANDDIER Phyllis - LAVARENNE Jeanine - MM. LAVERAN Henri - LEVAI Jean-Paul - MAGE Gérard - MALPUECH Georges - MARCHEIX Jean-Claude - MICHEL Jean-Luc - Mme MOINADE Simone - MM. MOLINA Claude - MONDIE Jean-Michel - PERI Georges - PETIT Georges - PHILIPPE Pierre - PLAGNE Robert - PLANCHE Roger - PONSONNAILLE Jean - RAYNAUD Elie - REY Michel - Mme RIGAL Danièle - MM. RISTORI Jean-Michel - ROZAN Raymond - SCHOEFFLER Pierre - SIROT Jacques - SOUTEYRAND Pierre - TANGUY Alain - TERVER Sylvain - THIEBLOT Philippe - TOURNILHAC Michel - VANNEUVILLE Guy - VIALLET Jean-François - Mle VEYRE Annie
PROFESSEURS EMERITES :
MM. BACIN Franck - BEYTOUT Jean - BOITEUX Jean-Paul - BOMMELAER Gilles - CHAMOUX Alain - DAUPLAT Jacques - DEMEOCQ François - DETEIX Patrice - IRTHUM Bernard - JACQUETIN Bernard - KEMENY Jean-Louis - LESOURD Bruno - LUSSON Jean-René - PHILIPPE Pierre - RIBAL Jean-Pierre
PROFESSEURS DES UNIVERSITES-PRATICIENS HOSPITALIERS
PROFESSEURS DE CLASSE EXCEPTIONNELLE
M. VAGO Philippe Histologie-Embryologie Cytogénétique M. AUMAITRE Olivier Médecine Interne
M. LABBE André Pédiatrie
M. AVAN Paul Biophysique et Traitement de l'Image M. DURIF Franck Neurologie
M. BOIRE Jean-Yves Biostatistiques, Informatique Médicale et Technologies de Communication M. BOYER Louis Radiologie et Imagerie Médicale
option Clinique
M. POULY Jean-Luc Gynécologie et Obstétrique M. CANIS Michel Gynécologie-Obstétrique
Mme PENAULT-LLORCA Frédérique Anatomie et Cytologie Pathologiques M. BAZIN Jean-Etienne Anesthésiologie et Réanimation
Chirurgicale
M. BIGNON Yves Jean Cancérologie option Biologique M. BOIRIE Yves Nutrition Humaine
M. CLAVELOU Pierre Neurologie
M. DUBRAY Claude Pharmacologie Clinique M. GILAIN Laurent O.R.L.
M. LEMAIRE Jean-Jacques Neurochirurgie
M. CAMILLERI Lionel Chirurgie Thoracique et Cardio-Vasculaire M. DAPOIGNY Michel Gastro-Entérologie
M. LLORCA Pierre-Michel Psychiatrie d’Adultes M. PEZET Denis Chirurgie Digestive M. SOUWEINE Bertrand Réanimation Médicale
M. BOISGARD Stéphane Chirurgie Orthopédique et Traumatologie M. CONSTANTIN Jean-Michel Anesthésiologie et Réanimation Chirurgicale Mme DUCLOS Martine Physiologie
M. SCHMIDT Jeannot Thérapeutique
PROFESSEURS DE 1ère CLASSE
M. DECHELOTTE Pierre Anatomie et Cytologie Pathologique M. CAILLAUD Denis Pneumo-phtisiologie
M. VERRELLE Pierre Radiothérapie option Clinique M. CITRON Bernard Cardiologie et Maladies Vasculaires M. D’INCAN Michel Dermatologie -Vénéréologie Mme JALENQUES Isabelle Psychiatrie d'Adultes Mle BARTHELEMY Isabelle Chirurgie Maxillo-Faciale
M. GARCIER Jean-Marc Anatomie-Radiologie et Imagerie Médicale M. GERBAUD Laurent Epidémiologie, Economie de la Santé
et Prévention
M. SOUBRIER Martin Rhumatologie
M. TAUVERON Igor Endocrinologie et Maladies Métaboliques M. MOM Thierry Oto-Rhino-Laryngologie
M. RICHARD Ruddy Physiologie M. RUIVARD Marc Médecine Interne
M. SAPIN Vincent Biochimie et Biologie Moléculaire M. BAY Jacques-Olivier Cancérologie
M. COUDEYRE Emmanuel Médecine Physique et de Réadaptation Mme GODFRAIND Catherine Anatomie et Cytologie Pathologiques M. ROSSET Eugénio Chirurgie Vasculaire
M. ABERGEL Armando Hépatologie
M. LAURICHESSE Henri Maladies Infectieuses et Tropicales M. TOURNILHAC Olivier Hématologie
M. CHIAMBARETTA Frédéric Ophtalmologie
M. FILAIRE Marc Anatomie – Chirurgie Thoracique et
Cardio-Vasculaire
M. GALLOT Denis Gynécologie-Obstétrique M. GUY Laurent Urologie
M. TRAORE Ousmane Hygiène Hospitalière M. ANDRE Marc Médecine Interne M. BONNET Richard Bactériologie, Virologie
M. CACHIN Florent Biophysique et Médecine Nucléaire M. COSTES Frédéric Physiologie
M. FUTIER Emmanuel Anesthésiologie-Réanimation Mme HENG Anne-Elisabeth Néphrologie
M. MOTREFF Pascal Cardiologie
Mme PICKERING Gisèle Pharmacologie Clinique
PROFESSEURS DE 2ème CLASSE
Mme CREVEAUX Isabelle Biochimie et Biologie Moléculaire M. FAICT Thierry Médecine Légale et Droit de la Santé Mme KANOLD LASTAWIECKA Justyna Pédiatrie
M. TCHIRKOV Andréï Cytologie et Histologie M. CORNELIS François Génétique
M. DESCAMPS Stéphane Chirurgie Orthopédique et Traumatologique M. POMEL Christophe Cancérologie – Chirurgie Générale
M. CANAVESE Fédérico Chirurgie Infantile
M. LESENS Olivier Maladies Infectieuses et Tropicales M. RABISCHONG Benoît Gynécologie Obstétrique
M. AUTHIER Nicolas Pharmacologie Médicale
M. BROUSSE Georges Psychiatrie Adultes/Addictologie M. BUC Emmanuel Chirurgie Digestive
M. CHABROT Pascal Radiologie et Imagerie Médicale M. LAUTRETTE Alexandre Néphrologie Réanimation Médicale M. AZARNOUSH Kasra Chirurgie Thoracique et Cardiovasculaire Mme BRUGNON Florence Biologie et Médecine du Développement et
de la Reproduction
Mme HENQUELL Cécile Bactériologie Virologie M. ESCHALIER Romain Cardiologie
M. MERLIN Etienne Pédiatrie Mme TOURNADRE Anne Rhumatologie M. DURANDO Xavier Cancérologie
M. DUTHEIL Frédéric Médecine et Santé au Travail Mme FANTINI Maria Livia Neurologie
M. SAKKA Laurent Anatomie – Neurochirurgie M. BOURDEL Nicolas Gynécologie-Obstétrique M. GUIEZE Romain Hématologie
M. POINCLOUX Laurent Gastroentérologie M. SOUTEYRAND Géraud Cardiologie
PROFESSEURS DES UNIVERSITES
M. CLEMENT Gilles Médecine Générale Mme MALPUECH-BRUGERE Corinne Nutrition Humaine M. VORILHON Philippe Médecine Générale
PROFESSEURS ASSOCIES DES UNIVERSITES
Mme BOTTET-MAULOUBIER Anne Médecine Générale M. CAMBON Benoît Médecine Générale
MAITRES DE CONFERENCES DES UNIVERSITES -
PRATICIENS HOSPITALIERS
MAITRES DE CONFERENCES HORS CLASSE
Mme CHAMBON Martine Bactériologie Virologie Mme BOUTELOUP Corinne Nutrition
MAITRES DE CONFERENCES DE 1ère CLASSE
M. MORVAN Daniel Biophysique et Traitement de l’Image Mle GOUMY Carole Cytologie et Histologie, Cytogénétique
Mme FOGLI Anne Biochimie Biologie Moléculaire Mle GOUAS Laetitia Cytologie et Histologie, Cytogénétique M. MARCEAU Geoffroy Biochimie Biologie Moléculaire Mme MINET-QUINARD Régine Biochimie Biologie Moléculaire M. ROBIN Frédéric Bactériologie
Mle VERONESE Lauren Cytologie et Histologie, Cytogénétique M. DELMAS Julien Bactériologie
Mle MIRAND Andrey Bactériologie Virologie
M. OUCHCHANE Lemlih Biostatistiques, Informatique Médicale et Technologies de Communication M. LIBERT Frédéric Pharmacologie Médicale
Mle COSTE Karen Pédiatrie M. EVRARD Bertrand Immunologie Mle AUMERAN Claire Hygiène Hospitalière M. POIRIER Philippe Parasitologie et Mycologie Mme CASSAGNES Lucie Radiologie et Imagerie Médicale M. LEBRETON Aurélien Hématologie
MAITRES DE CONFERENCES DE 2ème CLASSE
Mme PONS Hanaë Biologie et Médecine du Développement
et de la Reproduction
M. JABAUDON-GANDET Matthieu Anesthésiologie – Réanimation Chirurgicale M. BOUVIER Damien Biochimie et Biologie Moléculaire
M. BUISSON Anthony Gastroentérologie M. COLL Guillaume Neurochirurgie Mme SARRET Catherine Pédiatrie
M. MASDASY Salwan Endocrinologie, Diabète et Maladies
Mme NOURRISSON Céline Parasitologie - Mycologie
MAITRES DE CONFERENCES DES UNIVERSITES
Mme BONHOMME Brigitte Biophysique et Traitement de l’Image Mme VAURS-BARRIERE Catherine Biochimie Biologie Moléculaire M. BAILLY Jean-Luc Bactériologie Virologie
Mle AUBEL Corinne Oncologie Moléculaire
M. BLANCHON Loïc Biochimie Biologie Moléculaire Mle GUILLET Christelle Nutrition Humaine
M. BIDET Yannick Oncogénétique
M. MARCHAND Fabien Pharmacologie Médicale M. DALMASSO Guillaume Bactériologie
M. SOLER Cédric Biochimie Biologie Moléculaire M. GIRAUDET Fabrice Biophysique et Traitement de l’Image Mme VAILLANT-ROUSSEL Hélène Médecine Générale
Mme LAPORTE Catherine Médecine Générale
M. LOLIGNIER Stéphane Neurosciences – Neuropharmacologie Mme MARTEIL Gaëlle Biologie de la Reproduction
M. PINEL Alexandre Nutrition Humaine
MAITRES DE CONFERENCES ASSOCIES DES UNIVERSITES
M. TANGUY Gilles Médecine Générale M. BERNARD Pierre Médecine Générale Mme ESCHALIER Bénédicte Médecine Générale Mme RICHARD Amélie Médecine Générale
Remerciements
Je tiens à témoigner toute ma gratitude à l'égard de ma directrice de thèse,
Madame le Docteur Annick GREIL pour son aide. Tu m’as vu grandir durant mon
internat, merci pour ce dernier semestre ensemble, merci pour tout.
Je remercie aussi le Professeur COSTES, le Professeur BOIRIE et le Docteur
FARIGON pour avoir participé à cette thèse. Merci pour vos conseils et votre
disponibilité. Un jour nous enverrons un patient BPCO dans l’espace !
Merci au Professeur CAILLAUD de présider ma thèse et de m’avoir accueilli dans
son service de Pneumologie. Votre rigueur et vos conseils ont été précieux.
Je remercie l'équipe des médecins, les infirmiers, les secrétaires et toute l’équipe
du service de Pneumologie de Clermont-Ferrand pour leur collaboration lors de
la collecte de données.
Merci également au personnel du service d’explorations fonctionnelles
respiratoires de Clermont-Ferrand, pour votre patience et votre bienveillance.
Soufflez, videz, videz, encore, encore, encore, et… inspirez !
Mes remerciements vont aussi à Mr Aurélien MULLIEZ, qui a fourni de précieux
renseignements quant au traitement statistique des données et qui a procédé
avec soin aux différentes analyses statistiques. J’ai apprécié discuter, réfléchir et
travailler avec vous. Sortez-moi des petits p !
J'aimerais exprimer ma reconnaissance aux patients de l'Hôpital Régional de
Clermont-Ferrand qui ont participé volontairement à cette étude.
Toute ma gratitude à ma compagne, Agnès, pour son amour, sa patience et son
soutien tout au long de ma thèse mais aussi de mon internat. Tu as été là durant
ces quatre années d’internat, bien qu’à 400 km de distance, à moi de venir te
retrouver pour construire notre vie ensemble, mon Amour.
A mes amis de Rouen (Jp, Baptiste, Marine & Charles, Popi & Charlotte), aux
rouennais qui m’ont si bien accueilli en inter-CHU (Astrid, Pierre, Diane, Samy,
Mathieu et bien sûr Pr Thiberville).
Merci à mes collègues de travail (Matthieu, Thomas, Nelson, et les autres) pour
leur appui au cours de ces études de Médecine. Vive l’Auvergne !
Je remercie Danièle et Jean pour leurs conseils et leur bienveillance.
Enfin, je remercie mes parents qui sont et seront toujours présents à mes côtés.
A mon frère Thomas, ma source de motivation depuis tout petit.
Summary
Abstract ... 15
I.
Introduction ... 16
II.
Methods and materials... 17
Definition of sarcopenia...18
Respiratory parameters ...18
Nutritional assessment ...19
Statistical analysis ...20
III.
Results ... 22
Prevalence of sarcopenia ...22
Respiratory parameters ...26
Nutritional assessment ...27
Evolution of sarcopenia and respiratory function ...29
IV.
Discussion ... 35
Prevalence of sarcopenia ...35
Sarcopenia and respiratory function ...37
Evolution of nutritional status ...38
Screening sarcopenia to prevent mortality ...39
Strength and limitations of the study ...40
V.
Conclusion ... 42
VI.
References ... 43
Appendix I. Written consent ... 52
Appendix II. Questionnaires... 57
Appendix III. Flow chart ... 58
Tables
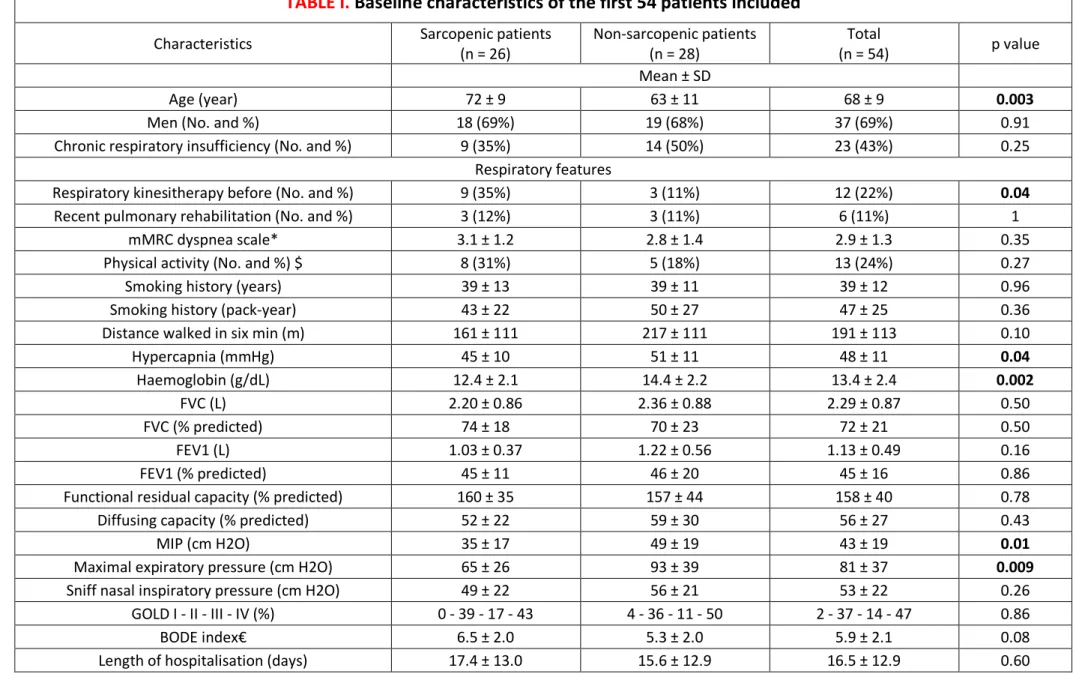
TABLE I. Baseline characteristics of the first 54 patients included ... 24
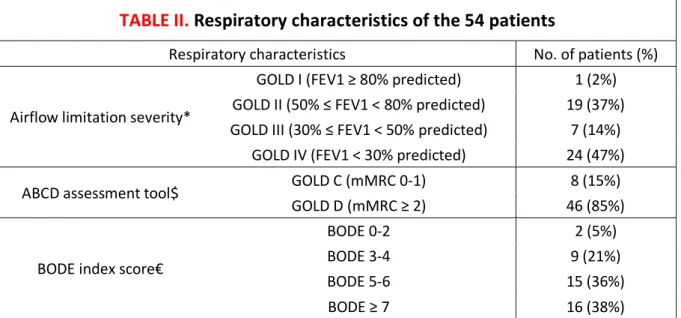
TABLE II. Respiratory characteristics of the 54 patients ... 26
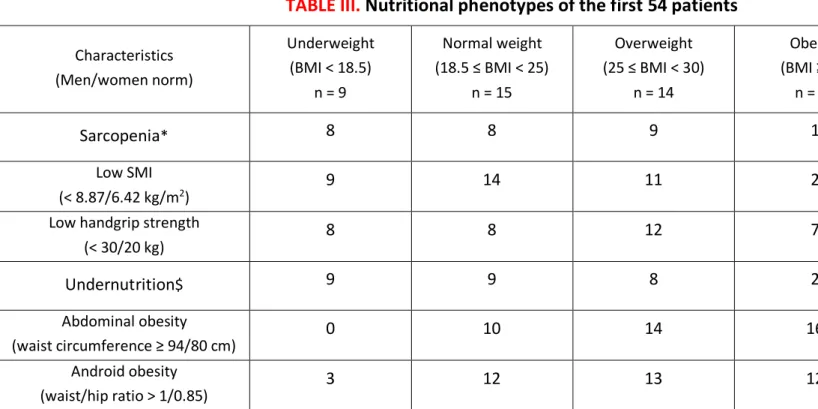
TABLE III. Nutritional phenotypes of the first 54 patients ... 28
TABLE IV. Comparison of muscle mass measurements at six months (n = 17) ... 28
TABLE V. Improvement of the 14 sarcopenic patients followed at six months ... 30
TABLE VI. Study of the five patients recovering from sarcopenia at six months ... 31
TABLE VII. Factors associated with SMI and handgrip strength improvement in
univariate analysis ... 32
TABLE VIII. Characteristics of the 38 patients according to whether they survived at
six months ... 34
Figures
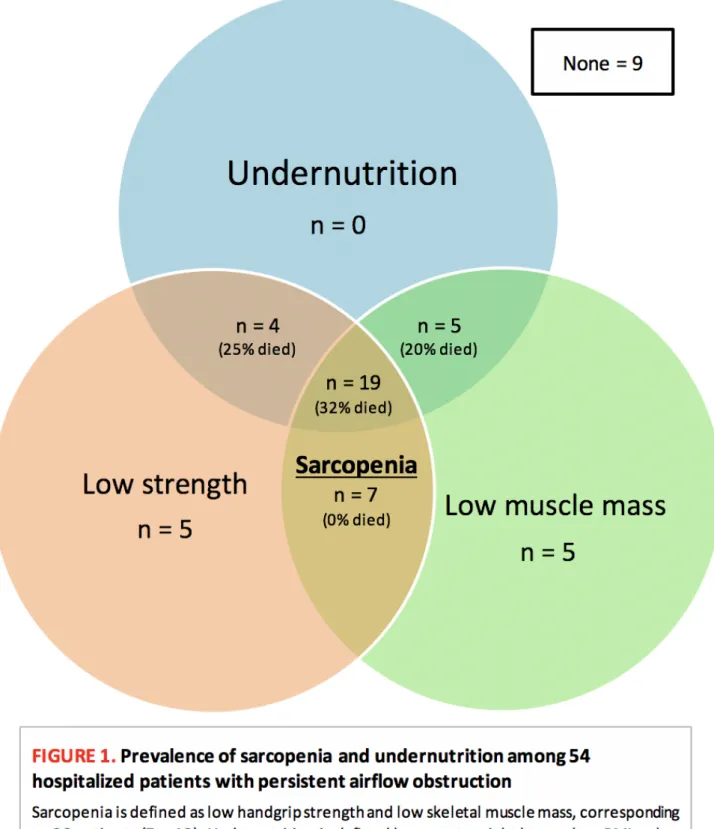
FIGURE 1. Prevalence of sarcopenia and undernutrition among 54 hospitalized
patients with persistent airflow obstruction. ... 23
FIGURE 2. Improvement of sarcopenia determinants at six months. ... 29
FIGURE 3. Kaplan-Meier survival curves of the first 54 patients ... 33
Abbreviations list
BMI: body mass index
COPD: chronic obstructive pulmonary disease
CRP: C-reactive protein
DEXA: Dual-energy X-ray absorptiometry
EWGSOP: European Working Group on Sarcopenia in Older People
FEV1: forced expiratory volume in one second
FFMI: fat-free mass index
FVC: forced vital capacity
HOMA-IR: homeostatic model assessment insulin resistance
MIP: maximal inspiratory pressure
Abstract
Background. COPD is characterized by a loss of skeletal muscle mass. Associated with a decrease in physical performance, it defines sarcopenia. The objective of this study is to describe the prevalence of sarcopenia in patients with chronic obstructive pulmonary insufficiency during hospitalization for acute exacerbation. The evolution of sarcopenia at six months and the survival at one year of these patients were also studied.
Methods. We prospectively included hospitalized patients and measured their body composition, handgrip strength and respiratory function, including maximum inspiratory pressure (MIP) representative of diaphragmatic function. The same measurements were performed at six months in consultation. Sarcopenia was defined by a low skeletal muscle mass index (SMI) measured by body impedance analysis, and a decreased handgrip strength (HGS), based on the criteria of the European Working Group on Sarcopenia in Older Adults (EWGSOP). Survival data were collected eighteen months after hospitalization.
Results. We analyzed data from fifty-four patients, aged 68 ± 9 years and BMI 26.9 ± 7.8 kg/m2, with
an average FEV1 of 1.13 ± 0.49 L (45 ± 16%). Sarcopenia was observed in 48% of patients during hospitalization and in 30% of patients in consultation. At six months, the SMI improved more for men than women (+5% vs -3%, p = 0.01), it tends to improve more for patients taking oral nutritional supplements (+13% vs +1%, p = 0.05). HGS tends to increase more in physically active patients (+324% vs. +7%, p = 0.05). In multivariate analysis, SMI and MIP were linked (p = 0.03). The one-year survival rate was lower in sarcopenic patients (65% vs. 86%, p = 0.03).
Conclusion. Sarcopenia in chronic obstructive pulmonary insufficiency is prevalent during exacerbation and in a stable state. It exposes to lower survival. A multimodal management reduces its prevalence.
Key words: Body composition, Chronic obstructive pulmonary disease, COPD, Malnutrition, Mortality, Nutritional assessment, Prevalence, Sarcopenia.
I. Introduction
Fifth cause of death in 2015 (1) and soon third in 2030 according to World Health Organization (2), chronic obstructive pulmonary disease (COPD) has recently been recognized “public health emergency” in France. As a consequence of a smoking history, the prevalence of COPD and the hospitalizations for acute exacerbations is increasing (3,4), especially among the elderly.
This population is at risk of age-related malnutrition (anorexia, anabolic defect, sedentary lifestyle) and respiratory disorders (dyspnea interfering with food intake, hypermetabolism through increased ventilatory work, systemic inflammation). The aging of the population involves taking an interest in its determinants of health. Combination of genetic and environmental factors, sarcopenia (loss of muscle mass especially at the skeletal level) is one of these determinants.
Loss of body weight or muscle mass is a significant event in the evolution of COPD because of its association with premature mortality, poor functional status and quality of life (5,6). Sarcopenia is a health problem representative of frailty, loss of autonomy (7,8) and decreased muscle strength (9,10). Its prevalence is high in many organ pathologies such as COPD (11), but remains little studied in acute respiratory failure. The frequency and evolution of sarcopenia is unknown in chronic obstructive patients after an acute exacerbation, as well as the role of systemic inflammation on body composition.
Metabolic phenotypes have been defined to stratify patients’ nutritional risk in COPD (12). Hospitalizations could be considered an opportunity for nutritional assessment, patient counselling and implementation of longer-term nutritional management. As a result, improving the nutritional status of these patients could influence their respiratory function. Conversely, does the improvement in respiratory mechanics lead to a change in body composition?
Through this study, we describe the prevalence of sarcopenia in hospitalized chronic obstructive patients for acute exacerbation and at six months from it, we verify the hypothesis that sarcopenia may affect patients’ lung function and we study the survival rate of sarcopenic patients.
II. Methods and materials
This is a French observational descriptive and analytical study, monocentric in the Gabriel-Montpied University Hospital of Clermont-Ferrand. Recruitment was done in the Pneumology Department between 1st of January and 1st of May 2017. 54 patients participated in a prospective survey of
sarcopenia and hospitalization risks.
Inclusion criteria were: age ≥ 18 years, a history of persistent airflow obstruction (a post-bronchodilator forced expiratory volume in one second (FEV1) – forced vital capacity (FVC) ratio less than 0.7 of the predicted value after 400 μg of inhaled salbutamol) (13,14) compatible with respiratory function tests (FEV1 increased less than 12% and 200 mL after bronchodilation, according to the GOLD definition) (15), and informed consent to examination of nutritional status.
Exclusion criteria were: bronchopulmonary cancer being treated, disabling rheumatic disease, recent stroke or surgery (less than three months), missing data on essential variables (body mass index (BMI), mid-arm muscle circumference, impedancemetry). Patients with bronchopulmonary cancer were excluded because of a major impact on nutritional status. Exercise capacity would have been influenced by a disabling rheumatic disease, a recent stroke or surgery.
On a weekly basis, we included patients with known persistent airflow obstruction, consecutively hospitalized in Gabriel-Montpied University Hospital’s Pneumology Department. We offered to participate a study involving complementary nutritional tests (recommended by national and international authorities (16–18) to their standard respiratory management), and a six months’ follow-up consultation in stable clinical condition: examination and surveys, mid-arm muscle circumference, impedancemetry, spirometry. The initial evaluation was performed on average 3.6 days after the patient entered the Pneumology department.
This observational study was approved by the French "Commission Nationale Informatique et Libertés", and all patients gave their verbal and written informed consent for their participation (Appendix I).
The Ethics Committee of the Gabriel-Montpied University Hospital approved the research protocol. The study was registered at clinicaltrials.gov (NCT03111849).
Definition of sarcopenia
Skeletal muscle mass was calculated using an impedance equation to predict appendicular skeletal muscle mass: [0.401 x (height2/resistance) + (3.825 x gender) - (0.071 x age) + 5.102], where height is
in cm; resistance is in ohms; for sex, men = 1 and women = 0; and age is in years (19). Skeletal muscle mass index (SMI) was calculated as the absolute skeletal muscle mass divided by height squared (kg/m2). An SMI lower than 8.87 kg/m2 for men and 6.42 kg/m2 for women was considered abnormal.
Muscle strength was decreased if men’s handgrip was lower than 30 kg and women lower than 20 kg (20). Sarcopenia was defined as the presence of low skeletal muscle mass with low handgrip strength (21). Undernutrition was defined with the criteria of the Haute Autorité de Santé (HAS) 2007 (22).
Respiratory parameters
The following variables, which are known to predict outcome in chronic obstructive diseases, were evaluated and recorded at the time of enrolment and during the follow-up consultation.
We used three questionnaires (Appendix II) to assess the degree of dyspnea by the modified Medical Research Council (mMRC) scale (23), the level of physical exercise and smoking habits (three categories: non-smokers, active smokers and ex-smokers defined by a tobacco cessation for at least three months). Physiotherapy and rehabilitation course in the last six months were recorded. A six-minute-walk test was performed according to American Thoracic Society (ATS) recommendations (24) to measure functional status of patients and skeletal muscle endurance, as a predictor of morbidity and mortality (25), using a theoretical calculated value provided by Enright and Sherill (26,27).
We chose this test among others because it is the most used in Pneumology to assess exercise capacity. Respiratory function tests were done using a Jaegger 920 MasterLab1 spirometer and Body Box (both Masterlab, Jaegger, Würzburg, Germany) along with the European Community for Steel and Coal guidelines to establish predicted values (28,29). We determined FEV1, FVC, the functional residual capacity, the inspiratory capacity and total lung capacity (30,31), the maximum inspiratory and expiratory pressures and the sniff nasal inspiratory pressure (32). A composite prognostic index, the BODE index, was calculated as surrogate of global disease severity (33). Arterial blood gases data were collected.
Nutritional assessment
We measured weight (to within 0.5 kg) and height (to within 0.5 cm) to calculate BMI (34), waist and
hip circumference (to within 0.5 cm). The mid-arm muscle circumference of the dominant side (to within 0.5 cm, reflects of muscle protein), associated with the triceps skinfold (to within 0.2 mm,
indicates the calorie reserves stored in the form of fat, average of the three values varying by less than 1 mm), were evaluated to estimate muscle mass (mid-arm muscle area1) (35). Although this is not the
most precise method, it has an important interest in medical practice because it allows an appreciation of the evolution of muscle mass during a clinical situation. For the measurement of the skeletal muscle strength, we used the hydraulic Jamar’s dynamometer (36) in the second position (the most used), three times with the dominant hand (37) to do the average of the two best values (to within 1 kg). This test has an excellent reproducibility (38) and inter-rater reliability (39) using standardized instructions. The bioelectrical impedance measurement (Bodystat Quadscan 4000 Ltd, Isle of Man, UK) was carried out in accordance with the European Society for Clinical Nutrition and Metabolism (ESPEN) recommendations (40,41). Subjects were measured for height and weight at the time of the impedance measurement. This method has the advantages to be inexpensive, portable, simple, safe,
1 Mid-arm muscle area was calculated by the following equation:
quick, noninvasive (42,43) and is valid in COPD patients (44,45) to measure the fat-free mass index (FFMI). FFMI was calculated by dividing fat-free mass by height squared.
Involuntary weight loss over the past six months, use of oral nutritional supplements and recent enteral or parenteral nutrition were recorded. Due to limitations in memory, the reliability of information generally decreases with the length of the period surveyed, so that we limited the questions to six months. We evaluated the food intake via a verbal and visual scale, asking "Can you indicate the quantities you are currently eating, placing the cursor between 0 meaning "nothing at all" and 10 meaning "as usual"? This scale is statistically correlated with calculated energy intake, especially in undernourished patients (46). Insulin resistance was assessed with the calculation of the Homeostatic Model Assessment (HOMA) index, using the formula: fasting serum insulin (mU/L) × fasting plasma glucose (mmol/L)/22.5 (47).
Statistical analysis
Data were expressed as frequencies and associated percentages for categorical data, as mean ± standard deviation (or as median and interquartile range when data were not normally distributed) for quantitative parameters. Normality was assessed graphically and using Shapiro-Wilk’s test.
Comparisons between two groups were done using Chi-squared test (or Fisher’s exact test when appropriate) for categorical data and using Student’s t-test (or Mann & Whitney test when data not normal) for continuous data.
Univariate analysis was used to study the factors associated with SMI and handgrip strength improvement. Maximal inspiratory pressure (MIP) was analyzed in a multivariate mixed model (taking the patient as random effect), adjusted on SMI (or FFMI), functional residual capacity and time in order to assess relationship between SMI (or FFMI) and MIP with controlled functional residual capacity. Results are expressed as regression coefficients and their 95% confidence interval. To compare muscle
mass measurements, we used Pearson (or Spearman when data were not normal) correlation coefficients.
Intragroup evolution was analyzed using Student’s paired test. Survival analysis was performed, from discharge until 18 months later or death when it occurred. Survival curves were plotted using Kaplan Meier method and sarcopenic versus non-sarcopenic groups were compared using log rank test.
All tests were two-sided and a p value < 0.05 was considered statistically significant. Statistics were computed with Stata v12 (Stata Corp, College Station, Texas, USA).
III.
Results
This study consecutively included 58 patients with all degrees of severity of airflow obstruction. We excluded four non-obstructive phenotypes (three restrictive and one sleep apnea syndrome). 54 patients were evaluated at inclusion and 30 at six-month’s follow-up (Flow chart in Appendix III). All patients were Caucasians. Patients lost to follow-up were not statistically different from others, particularly with respect to age, gender and skeletal muscle index (SMI).
Prevalence of sarcopenia
The prevalence of sarcopenia was 48% (26/54 patients, Figure 1). The mean low SMI and handgrip
strength was respectively 7.01 kg/m2 and 20.3 kg for men, 5.38 kg/m2 and 13.7 kg for women
(no difference by gender for SMI, p = 0.15 and handgrip strength, p = 0.22). The characteristics of sarcopenic patients are presented in Table I. Sarcopenic patients were significantly older and more anemic, they had lower weight and fat-free mass index (FFMI). FVC, FEV1, functional residual capacity and diffusing capacity were not influenced by sarcopenia but maximal inspiratory and expiratory pressures were lower (p = 0.01 and 0.009 respectively). The FFMI of patients with edema of the lower
limbs was increased compared to patients without edema (mean 22.9 kg/m2 versus 16.0 kg/m2
23
Undernutrition
n = 0
Low muscle mass
n = 5
Low strength
n = 5
n = 4
(25% died)
n = 5
(20% died)
Sarcopenia
n = 7
(0% died)
n = 19
(32% died)
None = 9
FIGURE 1.
Prevalence of sarcopenia and undernutrition among 54
hospitalized patients with persistent airflow obstruction
Sarcopenia is defined as low handgrip strength and low skeletal muscle mass, corresponding
to 26 patients (7 + 19). Undernutrition is defined by recent weight loss or low BMI or low
albumin and applies to 28 patients (4 + 5 + 19). All deceased patients were undernourished.
TABLE I.
Baseline characteristics of the first 54 patients included
Characteristics Sarcopenic patients (n = 26) Non-sarcopenic patients (n = 28) (n = 54) Total p value
Mean ± SD
Age (year) 72 ± 9 63 ± 11 68 ± 9 0.003
Men (No. and %) 18 (69%) 19 (68%) 37 (69%) 0.91 Chronic respiratory insufficiency (No. and %) 9 (35%) 14 (50%) 23 (43%) 0.25
Respiratory features
Respiratory kinesitherapy before (No. and %) 9 (35%) 3 (11%) 12 (22%) 0.04
Recent pulmonary rehabilitation (No. and %) 3 (12%) 3 (11%) 6 (11%) 1 mMRC dyspnea scale* 3.1 ± 1.2 2.8 ± 1.4 2.9 ± 1.3 0.35 Physical activity (No. and %) $ 8 (31%) 5 (18%) 13 (24%) 0.27 Smoking history (years) 39 ± 13 39 ± 11 39 ± 12 0.96 Smoking history (pack-year) 43 ± 22 50 ± 27 47 ± 25 0.36 Distance walked in six min (m) 161 ± 111 217 ± 111 191 ± 113 0.10 Hypercapnia (mmHg) 45 ± 10 51 ± 11 48 ± 11 0.04 Haemoglobin (g/dL) 12.4 ± 2.1 14.4 ± 2.2 13.4 ± 2.4 0.002 FVC (L) 2.20 ± 0.86 2.36 ± 0.88 2.29 ± 0.87 0.50 FVC (% predicted) 74 ± 18 70 ± 23 72 ± 21 0.50 FEV1 (L) 1.03 ± 0.37 1.22 ± 0.56 1.13 ± 0.49 0.16 FEV1 (% predicted) 45 ± 11 46 ± 20 45 ± 16 0.86 Functional residual capacity (% predicted) 160 ± 35 157 ± 44 158 ± 40 0.78 Diffusing capacity (% predicted) 52 ± 22 59 ± 30 56 ± 27 0.43
MIP (cm H2O) 35 ± 17 49 ± 19 43 ± 19 0.01
Maximal expiratory pressure (cm H2O) 65 ± 26 93 ± 39 81 ± 37 0.009
Sniff nasal inspiratory pressure (cm H2O) 49 ± 22 56 ± 21 53 ± 22 0.26 GOLD I - II - III - IV (%) 0 - 39 - 17 - 43 4 - 36 - 11 - 50 2 - 37 - 14 - 47 0.86 BODE index€ 6.5 ± 2.0 5.3 ± 2.0 5.9 ± 2.1 0.08 Length of hospitalisation (days) 17.4 ± 13.0 15.6 ± 12.9 16.5 ± 12.9 0.60
Nutritional features
Diabetic (No. and %) 6 (23%) 8 (29%) 14 (26%) 0.65 Six months' weight loss (%) 3.9 ± 12.9 1.8 ± 9.4 2.8 ± 11.2 0.62 ONS before hospitalization (No. and %) 8 (31%) 2 (7%) 10 (19%) 0.04
ONS during hospitalization (No. and %) 8 (31%) 3 (11%) 11 (20%) 0.07 Recent artificial nutrition (No. and %) 3 (12%) 0 (0%) 3 (6%) 0.11 EFI scale£ 6.4 ± 3.0 7.3 ± 2.9 6.9 ± 3.0 0.24 Weight (kg) 60.5 ± 16.4 85.6 ± 21.6 73.5 ± 22.9 < 0.001 BMI (kg/m2) 22.5 ± 5.0 30.9 ± 7.8 26.9 ± 7.8 < 0.001 Waist/hip ratio 0.99 ± 0.07 1.02 ± 0.08 1.01 ± 0.08 0.06 Serum albumin (g/L) 33.3 ± 5.1 35.4 ± 4.8 34.4 ± 5.0 0.12 CRP (mg/L) 15.3 [6.7-38.7] 8.9 [1.8-17.1] 12.1 [6.1-26.5] 0.17 Fibrinogen (g/L) 5.4 ± 1.3 4.8 ± 1.0 5.1 ± 1.2 0.06 Fasting insulin (mUI/L) 13.3 ± 10.8 16.4 ± 10.0 15.0 ± 10.4 0.29 HOMA-IR 3.83 ± 5.41 4.45 ± 4.00 4.2 ± 4.7 0.64 Free testosterone (nmol/L) 5.98 ± 5.65 5.73 ± 4.26 5.9 ± 4.9 0.86 25-OH-vitamin D (ng/mL) 19.0 ± 14.0 11.8 ± 9.3 15.3 ± 12.3 0.03
Mid-arm muscle area (cm2) 26.4 ± 12.4 32.2 ± 10.0 29.4 ± 11.5 0.06
FFMI (kg/m2) 14.6 ± 4.2 20.5 ± 4.4 17.7 ± 5.2 < 0.001
Body fat mass index (kg/m2) 8.0 ± 2.4 10.5 ± 5.4 9.3 ± 4.4 0.03
Phase angle (degrees) 4.4 ± 1.5 5.5 ± 1.1 5.0 ± 1.4 0.004
Abbreviation: GOLD = Global Initiative for Chronic Obstructive Lung Disease; ONS = oral nutritional supplement
* Scores on the modified Medical Research Council (mMRC) dyspnea scale can range from 0 to 4, with a score of 4 indicating that the patient is too breathless to leave the house or becomes breathless when dressing or undressing.
$ A regular activity, as more than 30 minutes a day at least three times a week, is scored 1
€ Higher scores on the BMI, degree of airflow obstruction, dyspnea, and exercise capacity (BODE) index indicate a greater risk of death (Celli, 2004)
£ Evaluation of food intake (EFI), is a scale asking "Can you indicate the quantities you are currently eating, placing the cursor between 0 meaning "nothing at all" and 10 meaning "as usual"?
Respiratory parameters
Of the 54 patients with persistent airflow obstructions (severity presented in Table II), 50 had COPD, three had bronchial dilation and one had asthma-copd overlap (ACO). They were hospitalized for acute respiratory failure in 35 cases (65%), coming from emergency department (44%) or intensive care unit (26%). The number of patients with chronic respiratory insufficiency was 23 (43%). Of the 16 active smokers at inclusion, four have quit smoking for at least three months after the hospitalization.
During hospitalization, all patients had a six minutes’ walk test shorter than the theoretical calculated value. The percentage of patients reporting regular physical activity increased from 24 to 45% with a change in behavior for seven patients. Active patients had significantly better improvement in walking perimeter at six months (improvement of 184 ± 103 meters vs 72 ± 71 meters, p < 0.001). One third of the patients were anemic with no change after six months.
The mean length of stay in Pneumology was 16.5 days and 80% of patients went home. After hospitalization, 12 patients underwent respiratory physiotherapy and six underwent a
respiratory rehabilitation program in a specialized structure.
TABLE II.
Respiratory characteristics of the 54 patients
Respiratory characteristics No. of patients (%)
Airflow limitation severity*
GOLD I (FEV1 ≥ 80% predicted) 1 (2%) GOLD II (50% ≤ FEV1 < 80% predicted) 19 (37%) GOLD III (30% ≤ FEV1 < 50% predicted) 7 (14%)
GOLD IV (FEV1 < 30% predicted) 24 (47%) ABCD assessment tool$ GOLD C (mMRC 0-1) 8 (15%)
GOLD D (mMRC ≥ 2) 46 (85%)
BODE index score€
BODE 0-2 2 (5%) BODE 3-4 9 (21%) BODE 5-6 15 (36%) BODE ≥ 7 16 (38%) Abbreviation: GOLD = Global Initiative for Chronic Obstructive Lung Disease
* Three missing data
$ Classification according to the revised combined COPD assessment (GOLD 2017)
€ Higher scores on the BMI, degree of airflow obstruction, dyspnea, and exercise capacity (BODE) index indicate a greater risk of death (Celli, 2004). 12 missing data
Nutritional assessment
Undernutrition was found in 28 patients (among them, 11 were under 70 years, Figure 1). Mean patient weight was 73.5 ± 22.9 kg for a calculated mean BMI of 26.9 ± 7.8 kg/m2.
Nutritional phenotypes are presented in Table III, four patients were morbidly obese (BMI > 40 kg/m2)
and only one patient was sarcopenic obese (6% of obese patients). The number of patients who lost at least 10% of their weight in the past six months was 13 at baseline and none six months later.
Anorexia was defined as a score under seven on the food intake scale and was found in 43% patients at baseline (23/53, one missing data) and 17% (5/30) after six months. Patient appetite improved 1.9 points with 2.5 kg weight gain and 5.1 g/L albumin improvement. Two patients continued taking oral nutritional supplements and four stopped them after the hospitalization. At the time of exacerbation, patients had a low-grade systemic inflammation (mean fibrinogen 5.1 ± 1.2 g/L and CRP 23 ± 37 mg/L) with no significant decrease for both at six months (p = 0.53 and 0.99). Vitamin D was lower than 20 ng/mL (50 nmol/L) in 36 cases (67%) and increased significantly after six months (12.6 ± 8.9 ng/mL at baseline, 18.7 ± 10.5 ng/mL at six months, p = 0.02). Testosterone level was lower than norms (by gender and menopause) in 36 cases at baseline with no significant improvement. In the 40 non-diabetic patients (74%), HOMA index was higher than 2.5 in 56% of cases and did not change significantly after six months. For the 14 diabetic patients (26%), HOMA index was higher than 4.0 in 33% of cases initially, without data at six-month’s follow-up.
We compared different methods of measuring muscle mass (Table IV), using appendicular skeletal muscle index (ASMI) obtained by DEXA (dual-energy X-ray absorptiometry) as reference. SMI and FFMI
have a high Pearson’s correlation coefficient (r ≥ 0.90 p < 0.001), as well as mid-arm muscle area (r = 0.84 p < 0.001).
TABLE III.
Nutritional phenotypes of the first 54 patients
Characteristics (Men/women norm) Underweight (BMI < 18.5) n = 9 Normal weight (18.5 ≤ BMI < 25) n = 15 Overweight (25 ≤ BMI < 30) n = 14 Obesity (BMI ≥ 30) n = 16 Total (% of men) n = 54 (69%)
Sarcopenia
*8
8
9
1
26 (69%)
Low SMI (< 8.87/6.42 kg/m2)9
14
11
2
36 (75%)
Low handgrip strength
(< 30/20 kg)
8
8
12
7
35 (63%)
Undernutrition
$9
9
8
2
28 (68%)
Abdominal obesity (waist circumference ≥ 94/80 cm)0
10
14
16
40 (68%)
Android obesity (waist/hip ratio > 1/0.85)3
12
13
12
40 (60%)
Body mass index (BMI) is expressed in kg/m2* Sarcopenia was defined as the presence of low skeletal muscle mass index (SMI) with low handgrip strength $ Undernutrition was defined with the criteria of the HAS 2007 (45)
TABLE IV.
Comparison of muscle mass measurements at six months (n = 17)
Variables Pearson correlation coefficient r R2 p value
ASMI (kg/m2) - - -
SMI (kg/m2) 0.94 0.89 < 0.001
FFMI (kg/m2) 0.90 0.81 < 0.001
29
Evolution of sarcopenia and respiratory function
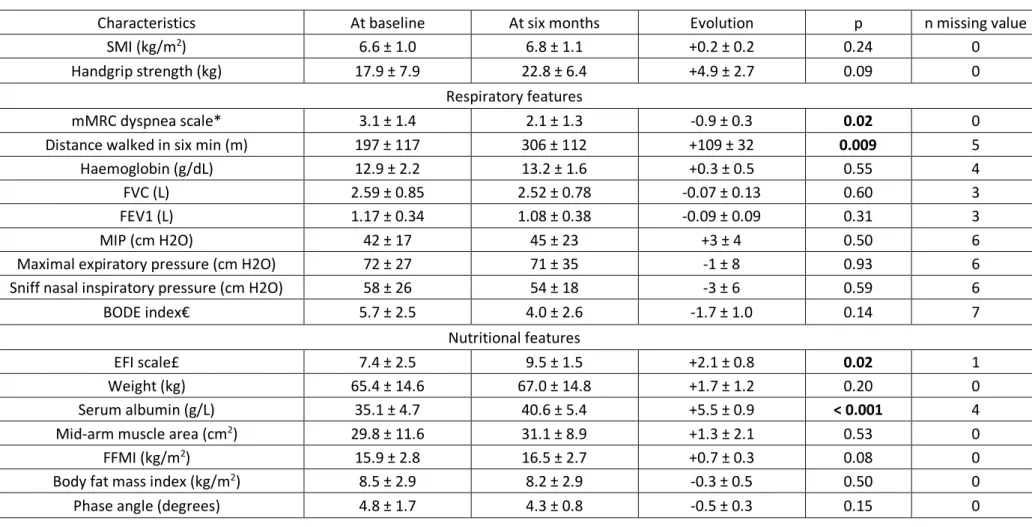
Six months after hospitalization, sarcopenia was found in nine patients (30%). Sarcopenic patients didn’t improve significantly their SMI and handgrip strength (Table V) but appetite was better of 2.1 ± 0.8 points on the appetite scale (p = 0.02) and serum albumin was higher of 5.5 ± 0.9 g/L (p < 0.001). Dyspnea decreased of 0.9 ± 0.3 points on mMRC scale (p = 0.02) and distance walked in six
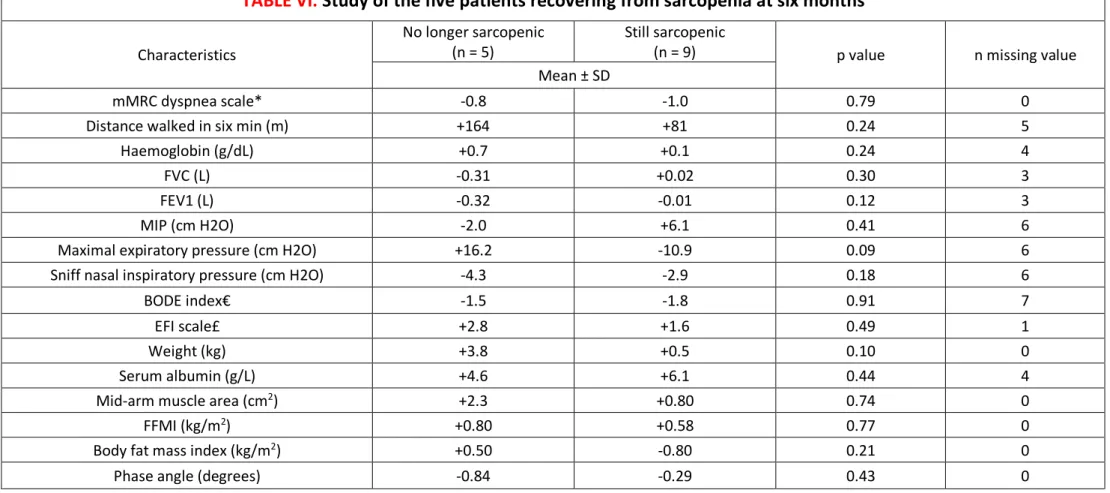
minutes improved of 109 ± 32 meters (p = 0.009). Figure 2 shows differences of evolution between sarcopenic and non-sarcopenic patients. Five patients (36%) recovered from sarcopenia by normalizing either their handgrip strength and/or their SMI, without significant amelioration of the respiratory and nutritional parameters between no-more-sarcopenic patients and still-sarcopenic patients (Table VI).
0% 2% 4% 6% 8% 10% 12% 14% 16%
SMI
FFMI
Handgrip
Sarcopenic patients
Non-sarcopenic patients
p = 0.41
p = 0.73 p = 0.16*
FIGURE 2.
Improvement of sarcopenia determinants at six months
The figure shows the percentage improvement at six months of each parameter according to the initial sarcopenic status. Sarcopenic patients do not improve significantly more their muscle mass and handgrip strength than non-sarcopenic patients.
* The standard deviation was too large to be represented (628% influenced by one extreme value, and 22% respectively).
FIGURE 10.
Kaplan-Meier survival curves of the first 54 patients
FIGURE 11.
Improvement of sarcopenia determinants at six months.
The figure shows the percentage improvement at six months of each parameter according to the initial sarcopenic status. Sarcopenic patients do not improve significantly more their
TABLE V.
Improvement of the 14 sarcopenic patients followed at six months
Characteristics At baseline At six months Evolution p n missing value SMI (kg/m2) 6.6 ± 1.0 6.8 ± 1.1 +0.2 ± 0.2 0.24 0
Handgrip strength (kg) 17.9 ± 7.9 22.8 ± 6.4 +4.9 ± 2.7 0.09 0 Respiratory features
mMRC dyspnea scale* 3.1 ± 1.4 2.1 ± 1.3 -0.9 ± 0.3 0.02 0 Distance walked in six min (m) 197 ± 117 306 ± 112 +109 ± 32 0.009 5 Haemoglobin (g/dL) 12.9 ± 2.2 13.2 ± 1.6 +0.3 ± 0.5 0.55 4 FVC (L) 2.59 ± 0.85 2.52 ± 0.78 -0.07 ± 0.13 0.60 3 FEV1 (L) 1.17 ± 0.34 1.08 ± 0.38 -0.09 ± 0.09 0.31 3
MIP (cm H2O) 42 ± 17 45 ± 23 +3 ± 4 0.50 6
Maximal expiratory pressure (cm H2O) 72 ± 27 71 ± 35 -1 ± 8 0.93 6 Sniff nasal inspiratory pressure (cm H2O) 58 ± 26 54 ± 18 -3 ± 6 0.59 6 BODE index€ 5.7 ± 2.5 4.0 ± 2.6 -1.7 ± 1.0 0.14 7
Nutritional features
EFI scale£ 7.4 ± 2.5 9.5 ± 1.5 +2.1 ± 0.8 0.02 1 Weight (kg) 65.4 ± 14.6 67.0 ± 14.8 +1.7 ± 1.2 0.20 0 Serum albumin (g/L) 35.1 ± 4.7 40.6 ± 5.4 +5.5 ± 0.9 < 0.001 4 Mid-arm muscle area (cm2) 29.8 ± 11.6 31.1 ± 8.9 +1.3 ± 2.1 0.53 0
FFMI (kg/m2) 15.9 ± 2.8 16.5 ± 2.7 +0.7 ± 0.3 0.08 0
Body fat mass index (kg/m2) 8.5 ± 2.9 8.2 ± 2.9 -0.3 ± 0.5 0.50 0
Phase angle (degrees) 4.8 ± 1.7 4.3 ± 0.8 -0.5 ± 0.3 0.15 0
* Scores on the modified Medical Research Council (mMRC) dyspnea scale can range from 0 to 4, with a score of 4 indicating that the patient is too breathless to leave the house or becomes breathless when dressing or undressing.
€ Higher scores on the BMI, degree of airflow obstruction, dyspnea, and exercise capacity (BODE) index indicate a greater risk of death (Celli, 2004)
£ Evaluation of food intake (EFI), is a scale asking "Can you indicate the quantities you are currently eating, placing the cursor between 0 meaning "nothing at all" and 10 meaning "as usual"?
TABLE VI.
Study of the five patients recovering from sarcopenia at six months
Characteristics
No longer sarcopenic
(n = 5) Still sarcopenic (n = 9) p value n missing value Mean ± SD
mMRC dyspnea scale* -0.8 -1.0 0.79 0
Distance walked in six min (m) +164 +81 0.24 5
Haemoglobin (g/dL) +0.7 +0.1 0.24 4
FVC (L) -0.31 +0.02 0.30 3
FEV1 (L) -0.32 -0.01 0.12 3
MIP (cm H2O) -2.0 +6.1 0.41 6
Maximal expiratory pressure (cm H2O) +16.2 -10.9 0.09 6 Sniff nasal inspiratory pressure (cm H2O) -4.3 -2.9 0.18 6
BODE index€ -1.5 -1.8 0.91 7
EFI scale£ +2.8 +1.6 0.49 1
Weight (kg) +3.8 +0.5 0.10 0
Serum albumin (g/L) +4.6 +6.1 0.44 4
Mid-arm muscle area (cm2) +2.3 +0.80 0.74 0
FFMI (kg/m2) +0.80 +0.58 0.77 0
Body fat mass index (kg/m2) +0.50 -0.80 0.21 0
Phase angle (degrees) -0.84 -0.29 0.43 0
* Scores on the modified Medical Research Council (mMRC) dyspnea scale can range from 0 to 4, with a score of 4 indicating that the patient is too breathless to leave the house or becomes breathless when dressing or undressing.
€ Higher scores on the BMI, degree of airflow obstruction, dyspnea, and exercise capacity (BODE) index indicate a greater risk of death (Celli, 2004)
£ Evaluation of food intake (EFI), is a scale asking "Can you indicate the quantities you are currently eating, placing the cursor between 0 meaning "nothing at all" and 10 meaning "as usual"?
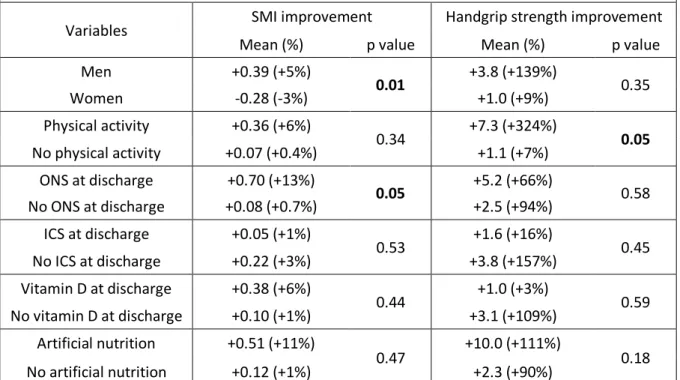
In univariate analysis (Table VII), SMI was associated with significantly better improvement for men (p = 0.01) and patients taking oral nutritional supplements (p = 0.05). For handgrip strength, a regular physical activity was associated with a better improvement (p = 0.05). In multivariate analysis, SMI and
maximal inspiratory pressure (MIP) were linked: for one more SMI unit, MIP gains 3.36 units; 95% CI [0.27-6.44] p = 0.03).
TABLE VII.
Factors associated with SMI and handgrip strength improvement
in univariate analysis
Variables SMI improvement Handgrip strength improvement Mean (%) p value Mean (%) p value Men +0.39 (+5%) 0.01 +3.8 (+139%) 0.35 Women -0.28 (-3%) +1.0 (+9%) Physical activity +0.36 (+6%) 0.34 +7.3 (+324%) 0.05 No physical activity +0.07 (+0.4%) +1.1 (+7%) ONS at discharge +0.70 (+13%) 0.05 +5.2 (+66%) 0.58 No ONS at discharge +0.08 (+0.7%) +2.5 (+94%) ICS at discharge +0.05 (+1%) 0.53 +1.6 (+16%) 0.45 No ICS at discharge +0.22 (+3%) +3.8 (+157%) Vitamin D at discharge +0.38 (+6%) 0.44 +1.0 (+3%) 0.59 No vitamin D at discharge +0.10 (+1%) +3.1 (+109%) Artificial nutrition +0.51 (+11%) 0.47 +10.0 (+111%) 0.18 No artificial nutrition +0.12 (+1%) +2.3 (+90%)
Abbreviation: ONS = oral nutritional supplement; ICS = inhaled corticosteroid
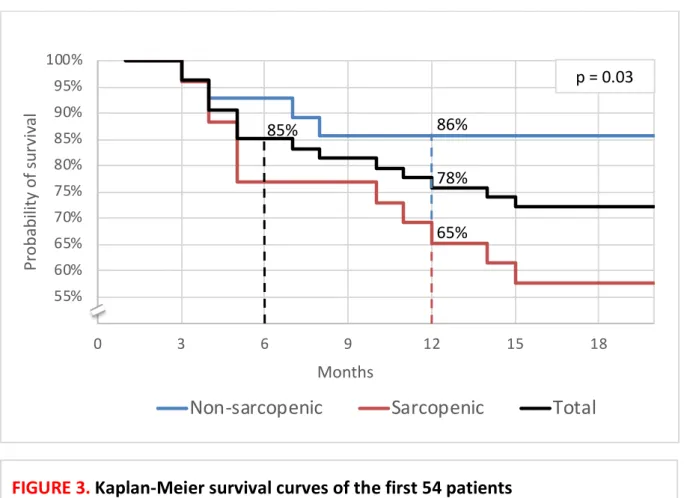
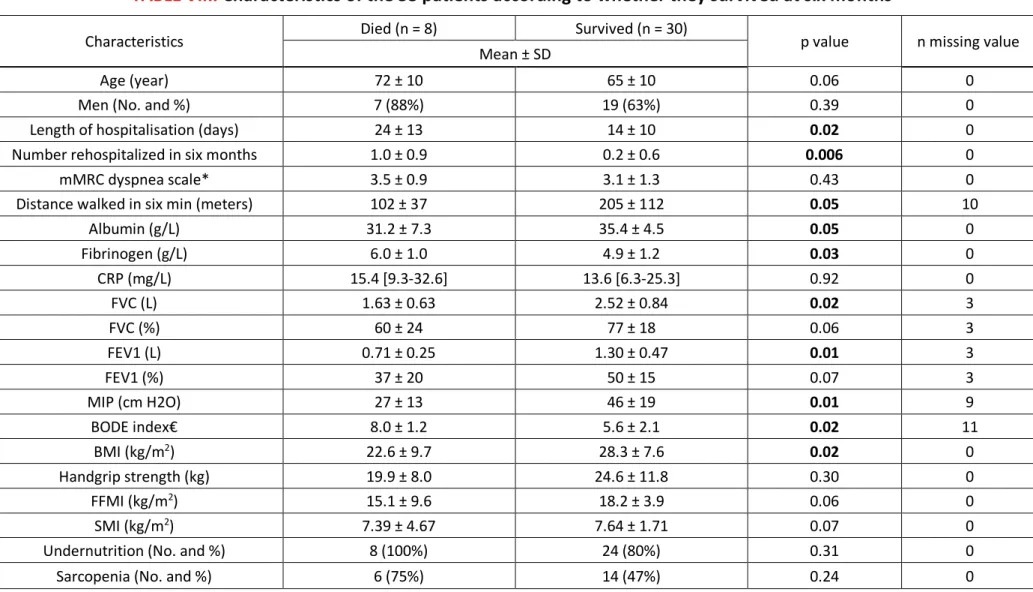
Between the date of discharge from hospital and the follow-up consultation, 17 patients were readmitted for exacerbation in Pneumology: 12 once, four twice and one three times. Eight patients (15%, one woman) died, within a median of 115 days [82-139]. Kaplan-Meier survival curves are presented in Figure 3. The cause of death was an acute respiratory failure in seven cases, most often due to infectious disease. Differences in characteristics between deceased patients and survivors are detailed in the Table VIII.
50% 55% 60% 65% 70% 75% 80% 85% 90% 95% 100% 0 3 6 9 12 15 18
Pr
ob
ab
ili
ty
o
f s
ur
vi
va
l
Months
Non-sarcopenic
Sarcopenic
Total
86%
65%
78%
85%
FIGURE 3.
Kaplan-Meier survival curves of the first 54 patients
85% of patients survived at six months and 78% one year after the exacerbation (black curve). Sarcopenic patients (red curve) have a lower probability of survival than non-sarcopenic patients (blue curve) one year after the exacerbation (65 ± 9% vs 86 ± 7% respectively, p = 0.03).
TABLE VIII.
Characteristics of the 38 patients according to whether they survived at six months
Characteristics Died (n = 8) Survived (n = 30) p value n missing value Mean ± SD
Age (year) 72 ± 10 65 ± 10 0.06 0
Men (No. and %) 7 (88%) 19 (63%) 0.39 0
Length of hospitalisation (days) 24 ± 13 14 ± 10 0.02 0 Number rehospitalized in six months 1.0 ± 0.9 0.2 ± 0.6 0.006 0
mMRC dyspnea scale* 3.5 ± 0.9 3.1 ± 1.3 0.43 0
Distance walked in six min (meters) 102 ± 37 205 ± 112 0.05 10
Albumin (g/L) 31.2 ± 7.3 35.4 ± 4.5 0.05 0 Fibrinogen (g/L) 6.0 ± 1.0 4.9 ± 1.2 0.03 0 CRP (mg/L) 15.4 [9.3-32.6] 13.6 [6.3-25.3] 0.92 0 FVC (L) 1.63 ± 0.63 2.52 ± 0.84 0.02 3 FVC (%) 60 ± 24 77 ± 18 0.06 3 FEV1 (L) 0.71 ± 0.25 1.30 ± 0.47 0.01 3 FEV1 (%) 37 ± 20 50 ± 15 0.07 3 MIP (cm H2O) 27 ± 13 46 ± 19 0.01 9 BODE index€ 8.0 ± 1.2 5.6 ± 2.1 0.02 11 BMI (kg/m2) 22.6 ± 9.7 28.3 ± 7.6 0.02 0 Handgrip strength (kg) 19.9 ± 8.0 24.6 ± 11.8 0.30 0 FFMI (kg/m2) 15.1 ± 9.6 18.2 ± 3.9 0.06 0 SMI (kg/m2) 7.39 ± 4.67 7.64 ± 1.71 0.07 0
Undernutrition (No. and %) 8 (100%) 24 (80%) 0.31 0
Sarcopenia (No. and %) 6 (75%) 14 (47%) 0.24 0
* Scores on the modified Medical Research Council (mMRC) dyspnea scale can range from 0 to 4, with a score of 4 indicating that the patient is too breathless to leave the house or becomes breathless when dressing or undressing.
IV.
Discussion
Sarcopenia was found in 48% of chronic obstructive patients during hospitalization and in 30% six months later. Skeletal muscle mass, measured by SMI, improved more in men and patients taking oral nutritional supplements and handgrip strength more in physically active patients. SMI and maximal inspiratory pressure (MIP) are linked. Sarcopenic patients had a lower probability of survival at six months than non-sarcopenic patients.
Prevalence of sarcopenia
At inclusion, the high prevalence of sarcopenia (48%) can be explained by a higher age, muscle impairment with multiple factors detailed below, and high COPD severity (47% of GOLD stage IV) which is a risk of low FFMI (48). To our knowledge, the prevalence of sarcopenia during an exacerbation had not been explored. Smoliner in Germany (49) and Rossi in Italy (50) studied geriatric hospitalized patients with a prevalence of approximately 25% of sarcopenia. In our study, nine patients were older than 80 years and seven of them were sarcopenic patients (78%) In this population, screening for sarcopenia seems essential to identify the most vulnerable subjects.
The first factor involved in muscle mass loss is anorexia, assessed by a verbal and visual scale, which was found in nearly half of the patients at the time of hospitalization. Six months later, the amelioration of dyspnea can be linked to the increase of appetite and food intake which decreases muscle wasting, inflammatory state and respiratory deficit. Physical activity could decrease anorexia too, by modulating muscle metabolism, insulin sensitivity and inflammation (51,52). The second factor, the inflammatory state, alters energy and protein requirements by elevating resting energy expenditure and nitrogen excretion. Associated with critical illness, it promotes a robust catabolism of lean body mass (53,54). Gan and co-workers were the first to note the importance of high CRP levels in COPD patients, showing that CRP is elevated in patients who actively smoked, had reduced lung
function (55) or stable COPD (56,57). This low-grade inflammation is related to the presence of airflow obstruction (58) and could be associated negatively with lung function (59,60), muscle endurance (61,62) and FFMI (63). Other factors such as recent inactivity (bed rest, deconditioning) or endocrine dysregulation (low free testosterone and vitamin D levels, higher HOMA insulin resistance) are related to loss of muscle mass. Kortebein demonstrated the effect of ten days of bed rest in healthy old individuals: study participants lost 3% of fat-free mass and 15% of muscle strength during immobilization (64).
In patients with stable chronic obstructive disease, nine of the 30 followed-patients were sarcopenic (30%), according to the EWGSOP definition. Jones showed a prevalence of 15% (65) in outpatients without unstable cardiac disease or a recent COPD exacerbation. The cutoff values of SMI used were lower (8.50 kg/m2 for men and 5.75 kg/m2 for women) which may explain the difference in prevalence.
In a community-dwelling older people in the United Kingdom, Patel demonstrated a 6.8% prevalence of sarcopenia using the lowest third of the distribution of DEXA lean mass (66). Healthier patients may be one explanation about this low prevalence. The most recent study conducted by Byun in South Korea found 25% of sarcopenic patients (67) which is what we expected.
The evaluation of nutritional status should include a dynamic assessment of body composition changes during metabolic stress and catabolism (68). In stable patients with DEXA, we compared different muscle mass measurement techniques and found statistically high correlation with appendicular skeletal muscle index. The mid-arm muscle area, calculated from mid-arm circumference and tricipital skin fold thickness, was less precise but has the advantage to be easy, quick and inexpensive. Fat-free mass measurement (sum of water, bones, organs, excluding the fat part) using bioelectrical impedance analysis is relevant in malnutrition, sarcopenia and catabolic diseases (69,70). Because BMI is insufficient to discriminate between the different body compartments (71,72), low fat-free mass has been described in COPD and may be a better predictor of clinical outcomes in these patients. Fat-free mass is a strong predictor of peripheral muscle strength (73) and an independent predictor of survival
(74,75) but can be influenced by edema during an acute exacerbation. Compared to DEXA, the sensitivity for detecting nutritional depletion was 86% for impedancemetry and the specificity 88% (76). The reproducibility of fat-free mass measurements over a seven-week period was excellent. If DEXA is not available, impedance measurement is a reliable diagnostic tool for muscle mass loss in the absence of edema.
Sarcopenia and respiratory function
Loss of muscle mass could affect the diaphragmatic function: sarcopenic patients had lower maximal inspiratory pressure (MIP) than others. In multivariate analysis, SMI and MIP were significantly linked. Lim suggested that muscle wasting could be both a cause and a consequence of respiratory problems: lung function was positively correlated with muscle mass in the trunk or mid-thigh level, and negatively correlated with fat mass in trunk or central area (77). Muscle dysfunction may be due to inactivity induced by deconditioning (8), systemic inflammation (78), oxidative stress, blood gas disturbances, corticosteroid use and reductions in muscle mass (79). Reduced fat-free mass is associated with impaired respiratory muscle strength (80,81) in COPD, both functional muscle strength (82) and endurance (83). Collet found that the endurance of the inspiratory muscles can be altered in obese patients with a BMI greater than 40 kg/m2 (83). Decrease in inspiratory muscle function represents an
important prediction factor for the survival rate in COPD patients (85,86). The combination of endurance and strength training would be indicated for patients with significant muscle atrophy.
At six months, sarcopenic patients did not improved significantly their respiratory function other than dyspnea and distance walked in six minutes. This result can be explained by the presence of a non-reversible respiratory disorder and the persistence of smoking often not admitted in patients already having a maximum inhaled treatment. The six-minute-walk test improved of 109 ± 32 meters which is considered as clinically significant. In Redelmeier’s study with stable severe COPD, the smallest difference associated with a difference in the patients’ perception of exercise performance was a mean
of 54 meters (95% confidence interval, 37–71 m) (87). In contrast, Holland demonstrated a minimal difference of 25 meters (88) and Wise a statistically significant difference of 86 meters (89). Regular monitoring is needed to check long-term changes in respiratory function.
Evolution of nutritional status
We studied factors that could improve patients' nutritional status. In the 2012 Cochrane review, Ferreira reports that nutritional supplementation promotes significant weight gain (mean 1.6 kg), FFMI (mean 0.5 kg) and MIP change from baseline among patients with COPD. We found the same result of muscle mass improvement for patients with oral nutritional supplements at hospital discharge, without information about the quantity and duration of supplements taken. In Ferreira’s meta-analysis of 2000, nutritional supplementation alone failed to induce significant weight gain (90) whereas in Weekes’ trial, a dietary counselling and food fortification resulted in weight gain (91). We noted a better improvement of handgrip strength in patients having a regular physical activity. It has been demonstrated that physically active subjects are less likely to have low FFMI (92) and lower risk of readmission (93).
Two controlled studies have demonstrated that nutritional supplementation combined with supervised exercise training increased body weight and fat-free mass in underweight patients with COPD (81,94). A French trial undertaken in malnourished patients with chronic respiratory failure found the same result with multimodal nutritional rehabilitation combining health education, oral nutritional supplements, exercise and oral testosterone for 90 days (95). In a randomized double-blind study, 81 COPD patients with a lean mass index below the 25th percentile were enrolled
in a four-months ambulatory respiratory rehabilitation program and received daily either an oral nutritional supplement or a placebo. At the end of the rehabilitation program, significant differences in favor of the supplemented group were observed in terms of weight gain, increase in respiratory muscle strength and increase in the number of daily steps evaluated by accelerometers (96).
Jones demonstrated the reversal of the sarcopenic state after a pulmonary rehabilitation (65) with 12/43 patients who were no longer considered sarcopenic at the end of the program. A respiratory rehabilitation should be offered to more patients after an acute exacerbation. Recent experimental data suggest that the endogenous peptide apelin, which is induced by muscle contraction, is positively associated with the beneficial effects of exercise in old patients (97). It could be both used as a tool for diagnosis of early sarcopenia and as the target of an innovative pharmacological strategy to prevent age-associated muscle weakness and restore physical autonomy.
Screening sarcopenia to prevent mortality
COPD is a disease with a high mortality rate. In the meta-analysis of Hoogendoorn, the mortality rate
at six months of COPD exacerbation was 15.6% (98) which corresponds to our results (15%). In our study, non-survivors were older and had more airflow limitation, a shorter walking distance,
higher BODE score, longer hospital stay and more rehospitalizations at six months which corresponds to Celli's results (99). The six-minute-walk test is useful to check the patient's ability to exercise and calculate the prognostic index BODE (100). In 2004, Pinto-Plata demonstrated that a shorter walked distance was associated with a higher mortality in COPD patients (25).
A second mortality factor is malnutrition (59,101) associated with impaired energy balance (102), 40% longer hospital stay (103) and 35% low lean mass (104). In a cohort of COPD patients treated with long-term oxygen therapy, a BMI under 25 kg/m2 was a predictive factor for all-cause and respiratory
mortality (105). Conversely, being overweight is only protective in patients with high muscle mass and the highest mortality is found in the low muscle mass groups (106). Advanced malnutrition syndromes are often associated with loss of muscle mass and function that will result in measurable declines in strength and physical performance. Next to weight (107,108) and CRP level (34,109,110) to predict mortality, plasma fibrinogen is a robust biomarker, significantly associated with symptoms, exercise
capacity, exacerbation rate, BODE index and mortality (111). It can be a useful biomarker to identify COPD patients with a high risk of future exacerbations and lower probability of survival (112).
Aging and chronic diseases like COPD are associated with sarcopenia (113). We found that survival was lower in sarcopenic patients, hence the importance of measuring fat-free mass and muscle strength to better predict mortality. Schols and Vestbo studied survival of COPD patients and demonstrated that fat-free mass assessed by bioelectrical impedance analysis is an independent predictor of mortality (48,114). Kilgour evaluated the association between handgrip strength and survival in advanced cancer patients and found an independent link. In the international consensus statement on sarcopenia in the elderly (16), measures of handgrip strength are recommended and patients with low handgrip strength are further tested for deficits of muscle mass. In older nursing-home residents, Landi demonstrated that sarcopenia was associated with increased risk of all-cause mortality (115). Identifying sarcopenic patients may improve survival with personalized therapeutic intervention.
Strengths and limitations of the study
The main limitation is that the fat-free mass was not measured at the same time with a reference technique, such as DEXA. Skeletal muscle mass was calculated from an bioelectrical impedance analysis equation (19) validated by Janssen (116) and Chien (117) in healthy Caucasians and Asians populations with high correlation coefficients, but not in diseased individuals. The assessment of fat-free mass may be biased during an exacerbation, partly explained by a change in the distribution of body water. At inclusion, 24% of patients had edema of the lower limbs increasing their FFMI. Therefore, the evaluation of sarcopenia should be reevaluated in a stable state, away from any exacerbation.
In addition, a quite small sample of chronic obstructive patients with different disease severity and function impairment was examined. Our study was conducted in a single center and in a cross-sectional study design, which limits the generalization of the results. Chronic obstructive patients hospitalized
in Pneumology are more severe from a respiratory but also nutritional point of view than primary care patients.
To our knowledge, this is the only study exploring the evolution of so many respiratory and nutritional parameters in chronic obstructive patients after an exacerbation. A randomized controlled trial could improve the validity of the results. We did not exclude patients who were lost to follow-up and deceased patients from the analyses so that the results could be generalized to real life COPD population seen in clinical practice.
V. Conclusion
Chronic obstructive diseases, associated with numerous comorbidities (cardio-vascular, malnutrition, skeletal muscle dysfunction, osteoporosis), require a global assessment of risks, disability and evolution. Sarcopenia, defined as skeletal muscle impairment and muscle mass loss, is an important factor to screen and to watch.
Like malnutrition, sarcopenia seems to be a poor prognostic factor. As part of a rehabilitation program, physical activity and optimal dietary intakes including protein could help reduce mortality of these patients.
At a time when the European Space Agency is interested in astronauts' nutritional diets, suffering significant muscle loss in the absence of gravity, would one day dare to imagine sending a sarcopenic COPD patient into space?