Foraminiferal-based biotic indices to assess the ecological quality status of
the Gulf of Gabes (Tunisia): Present limitations and future perspectives
Akram El Kateb
a, Claudio Stalder
a,b, Michael Martínez-Colón
c, Guillem Mateu-Vicens
d,
Fabio Francescangeli
e, Giovanni Coletti
f, Stephanie Stainbank
a, Silvia Spezzaferri
a,⁎aDepartment of Geosciences, University of Fribourg, Chemin du Musée 6, 1700 CH-1700 Fribourg, Switzerland
bFederal Office of Public Health FOPH, Schwarzenburgstrasse 157, 3003 Bern, Switzerland
cSchool of the Environment, Florida A&M University, FSH Science Research Center, 1515 South MLK Blvd., Tallahassee, FL 32307, United States
dCátedra ‘‘Guillem Colom Casasnovas,’’ Universitat de les Illes Balears, Cra. de Valldemossa, Km. 7.5, 07122 Palma de Mallorca, Spain
eUniversity of Hamburg, Institute for Geology, Centre for Earth System Research and Sustainability, Bundesstraße, 5520146 Hamburg, Germany
fDepartment of Earth and Environmental Sciences University of Milano-Bicocca, Piazza della Scienza 4, 20126 Milano, Italy
A R T I C L E I N F O Keywords: Biotic indices Mediterranean Benthic foraminifera Pollution Biomonitoring FOBIMO Foram-AMBI A B S T R A C T
Biotic indices are tools to assess the ecological status of marine systems, and can be based on different metrics (such as ecological groups, specific diversity). The present study applies five biotic indices based on living (stained) benthic foraminiferal assemblages to assess ecological conditions in a wide area of the Mediterranean Sea in the heavily polluted Gulf of Gabes and along the western and eastern coasts of the Djerba Island, with the eastern coast considered as “pristine”. The applied indices are based on epiphytic foraminifera e.g., the “long versus short life span” index (ILS) and the modified FoRAM-Index (FI’), benthic foraminiferal assemblage com-position and diversity, e.g., the Tolerant Species index (TSstd), the Foram Stress Index (FSI), the diversity Index (exp(H’bc)) and the newly developed Foram-AZTI Marine Biotic Index (Foram-AMBI). This latter index was tested using species of benthic foraminifera presently assigned to ecological groups in the Mediterranean Sea. All indices confirm good ecological conditions eastern of Djerba. The FI’ and ILS, % TSstd, FSI, indicate a severe anthropogenic impact especially in the central part of the Gulf of Gabes, next to the phosphate industry of Skhira and along the western coast of Djerba Island and confirm direct observations and geochemical data. The indices based on epiphytic foraminifera seem to better reflect actual environmental conditions in the investigated region because of the extended Posidonia oceanica meadow in the area. The exp(H’bc) reflects lower degrees of pollution. The application of the Foram-AMBI index presents limitations that prevent its current use. It strongly under-estimates the pollution impact along the Tunisian coast, and additional work is needed to increase the number of species attributed to ecological groups and to possibly modify the coefficients to be used in its equation.
1. Introduction
Biotic indices are numerical scales that represent the ecological condition of delimited areas. These indices are based on the funda-mental knowledge that changes in the relative abundance of key bioindicator taxa can be applied to monitor not only water quality but
also the environmental health of coastal/marine habitats (e.g.,Heink
and Kowarik, 2010). A key aspect to consider an organism as a
bioin-dicator is that it responds rapidly not only to stress but that its ecolo-gical response to environmental changes can effectively be used to monitor current and long-term conditions of the physiochemical char-acteristics of the water and sediments in coastal/marine areas (e.g.,
Dale and Beyeler, 2001; Parmar et al., 2016).
The publication of the European Water Framework Directive (WFD, 2000/60/EC) has prompted the scientific community to propose new and/or apply key existing biotic indices to quantitatively characterize marine soft-bottom habitats based on the ecological quality status
(EcoQS) framework (Birk et al., 2012). Although traditionally biotic
indices are based on macrofauna (AZTI Marine Biotic Index, AMBI of
Borja et al., 2000), more recently microbiomes have been tested
(mi-crogAMBI ofAylagas et al., 2017) as environmental health indicators
since they are also based on the assemblage ecological response of the coastal/marine benthos along pollution gradients such as organic
matter (OM) (Borja et al., 2019).
The coastal/marine benthic environment provides a large array of organisms to be used as bioindicators. For example, meiofaunal
⁎Corresponding author.
E-mail address:silvia.spezzaferri@unifr.ch(S. Spezzaferri).
http://doc.rero.ch
Published in "Ecological Indicators 111(): 105962, 2020"
which should be cited to refer to this work.
organisms like nematodes are used as bioindicators of pollution based
on assemblage composition, maturity level, etc. (Chen et al., 2018).
Similarly, for over the past 50 years biotic indices, based on benthic foraminifera, have been increasingly developed and implemented to assess pollution, water quality and changes in environmental conditions
(Sen Gupta, 2013). Benthic foraminifera have several advantages as
sentinel bioindicator organisms with respect to macrofauna, e.g., they have high density in marine sediments, high species diversity, short life
cycle; and their sampling has a low impact on the environment (Hallock
et al., 2003; Schönfeld et al., 2012). The FOraminferal BIo-MOnitoring
(FOBIMO) initiative developed a standardised method for sampling, storing, processing, and analysing sediment samples for living (stained)
benthic foraminiferal assemblages (Schönfeld et al., 2012). The aim of
FOBIMO is to simplify the use of benthic foraminifera as a more reliable tool for biomonitoring across ocean basins.
Five biotic indices based on benthic foraminifera are currently used
for monitoring soft bottom sediments: (1)Bouchet et al. (2012)
pro-posed the diversity index (exp(H’)bc) to assess ecological quality status
based on the effective number of species derived from living (stained) benthic foraminifera. This index “forecasts” the number of species in a given sample that would be present if each were equally common (e.g.,
similar H′bc). This diversity index was applied to assess the EcoQS in the
Norwegian Skagerrak coast (Bouchet et al., 2012), along the Italian
coasts (Bouchet et al., 2018; Melis et al., 2019) and to reconstruct the
paleoEcoQS in the eastern English Channel (Francescangeli et al.,
2016). (2) The Tolerant Species index (% TSstd) developed byBarras
et al. (2014)is based on the relative proportion of stress-tolerant taxa as
a function of the grain size (< 63 μm). It is used in France to distinguish between natural and anthropogenic eutrophication along the coasts of the Gulf of Lion where sediments are characterized by different grain size. The authors follow the definition of eutrophication proposed by
Nixon (1995)as an “increase in the rate of supply of organic matter
(OM) to an ecosystem” resulting from nutrient enrichment and the
concept ofTyson (1995)that the grain size has a significant impact on
the sedimentary organic matter preservation. (3) The Foram Stress
Index (FSI), proposed by Dimiza et al. (2016), modelled after the
FoRAM-Index ofHallock et al. (2003)and validated with the BENTIX
index ofSimboura and Zenetos (2002), is based on the relative
per-centages of two ecological groups of benthic foraminiferal species ac-cording to their tolerance/sensitivity to OM enrichment. The FSI is intended to be applied in shallow and non-reefal environments as it was successfully applied in Greece in the Saronikos Gulf, including the in-dustrial polluted zones of Elefsis Bay and of the Port of Piraeus. (4) The
“long vs short life span” index (ILS) and the modified FoRAM-Index (FI’)
are ephiphytic foraminiferal indices, which can be considered in com-bination, and are designed to evaluate the ecological status of seagrass dominated meadows of Posidonia oceanica in several locations across
the Mediterranean Sea. Developed byMateu-Vicens et al. (2014), these
indices assess the ecological status and conservation of P. oceanica meadows by combining the distribution of epiphytic foraminiferal
morphotypes of the ILS (Table 1) with the water quality and benthic
conditions determined by the FI’. (5) The next step of the FOBIMO
Initiative is the development of the Foram-AMBI (Alve et al., 2016).
Modeled after the AZTI Marine Biotic Index (AMBI) of Borja et al.
(2000), which takes into account the individual species
(macro-invertebrates) sensitivity to an environmental stressor, the goal of the Foram-AMBI index is to assess the health of the benthic environments by assigning benthic foraminiferal species to one of five predefined ecological groups according to their tolerance/sensitivity to OM en-richment. This new index has been implemented as a foraminiferal biomonitoring tool for deep-water environments of the North Atlantic
(Alve et al., 2016) and in the Mediterranean Sea (Jorissen et al., 2018).
Tunisia is the leading country of phosphate production in the
Mediterranean Sea (Fig. 1A). Its 8 million tons/year industrial
pro-duction (Cisse and Mrabet, 2004) strongly impacts the surrounding
marine environments. Three main treatment complexes are located along the Gulf of Gabes. The first production unit was created at Sfax in 1952, followed by the industrial complex of Gabes in 1972 and Skhira
in 1988 (Fig. 1B and C). The industrial activities have polluted the
surrounding soils and marine sediments (Mkawar et al., 2007; Gargouri
et al., 2011; Wali et al., 2013, 2014; Ayadi et al., 2015; El Zrelli et al.,
2015) as well as seawater (Darmoul et al., 1980; El Zrelli et al., 2018)
with heavy metals and phosphorous. The subsequent pollution has se-verely impacted the P. oceanica distribution along the Gulf of Gabes. The large meadows reported at the beginning of the 20th century by
numerous authors (e.g., Le Danois et al., 1925; Guillaumont et al.,
1995; Ben Mustapha et al., 1999; Hattour and Mustapha, 2013; Ben
Mustapha and Hattour, 2015) have experienced a 90% decrease in
surface area over the last few decades (Zaouali, 1993; Ben Brahim et al.,
2010; El Zrelli et al., 2017). Heavy metal bioaccumulation has been
reported in soft tissues of marine fauna (e.g., the gastropod Gibbula
ardens and the oyster Pinctada radiata –Messaoudi et al., 2009; Rabaoui
et al., 2014) and are responsible for reduced macrobenthic communities
(Zaouali, 1993, Pérez-Domingo et al., 2008; El Lakhrach et al., 2012),
which could potentially have contributed to coral decline in the central
part of the Gulf of Gabes (El Kateb et al., 2016).
Aquatic vegetation has been used as a bioindicator (e.g., P. oceanica) to monitor the effect of pollutants on the coastal environments of the
Gulf of Gabes (El Zrelli et al., 2017). Since most of modern epiphytic
foraminifera appeared during (or slightly later) the emergence and early expansion of the seagrass environment and they coevolved
to-gether with the seagrasses (Pomar et al., 2017), epiphytic foraminiferal
assemblages are a potential and valuable indicator of seagrass mea-dows’ health.
Only two investigations were performed using benthic foraminifera to assess the pollution generated by the phosphate industries in Tunisia. One focused on the northern coast of the Gulf of Gabes, around the
region of Sfax (Aloulou et al., 2012), and the second focused on the area
near the waste discharge in Gabes and the industrial site of Skhira
(Ayadi et al., 2016;Fig. 1B and C). These two studies considered the
total assemblage (living + dead) of nearshore benthic foraminifera, which renders their interpretations not representative of the ecological status. Total assemblages are time averaged, while living assemblages are more representative of current environmental conditions (e.g.,
Barras et al., 2014; Alve et al., 2016).
The aim of the present study is to apply and compare for the first time existing benthic foraminiferal biotic indices to assess the impact of phosphate industries at a regional scale, on areas formerly colonized by
Table 1
Classification of the epiphytic foraminiferal morphotypes according toMateu-Vicens et al. (2014).
Mateu-Vicens et al. (2014)morphotypes (modified afterLanger 1993) Hallock et al. (2003)
Morphotypes Mobility Characteristic feature Funtional groups
A* Encrusting Mostly flat forms, permanently attached to the substrate Symbiont-bearing
SB Sessile Symbiont-bearing taxa
B* Temporary motile Same as inLanger's (1993)classification Other heterotrophs
C* Motile Same as inLanger's (1993)classification
D* Permanently motile Single aperture in upright position Stress tolerant
extensive seagrass meadows, and to test the validity of the Foram-AMBI, as well as other indices, for potential future applications in biomonitoring programs in Mediterranean coastal areas.
2. Hydrological and geographical settings
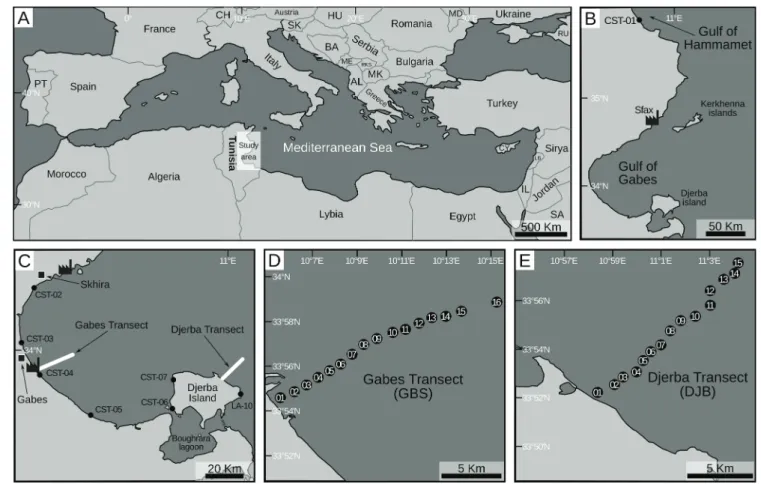
The Gulf of Gabes is located in the southern part of Tunisia (Fig. 1B).
It is approximatively 90 km wide, 100 km long and delimited in the north by the Kerkennah Islands and in the south by the Djerba Island. The tides in this region reach the highest amplitudes of the
Medi-terranean Sea with a maximum of 2 m high (Othmani et al., 2017). A
gently sloping bathymetry reaches a water depth of 50 m at around 130 km from the coastline.
Based onEl Zrelli et al. (2018); Ayadi et al. (2015); El Kateb et al.
(2018b), two dominant currents prevail in the Gulf: coastal and tidal
currents. Tides regulate the flows directed toward land during high tides and toward the open sea during low tides. The Surface Atlantic
current has a north–south trend along the Tunisian coast (El-Geziry and
Bryden, 2010). However,Othmani et al. (2017)suggests also a
south-north coastal circulation for a large part of the Gulf of Gabes during low and high tides and a main current flowing to the open sea between the Kerkennah and Djerba Islands. This current seems directly related to the tides: during flood tides, the current direction is from the offshore to the coast and vice versa.
3. Material and methods
3.1. Study site, sampling and sample treatment
Thirty-nine stations were investigated (Fig. 1B–E;Supplementary
Material 1): eight coastal stations were sampled in January 2014,
ex-cept for Station LA-10, which was sampled in July 2014 (CST-01 to
CST-07;Fig. 1B and C); sixteen stations comprise the Gabes transect
(GBS-01 to GBS-16; Fig. 1C and D) and fifteen stations the Djerba
transect (DJB-01 to DJB-15;Fig. 1C, E), both transects were sampled in
July 2014. Along both the Gabes transect and the western coast of Djerba, samples were collected at sites where P. oceanica and other seagrasses formed dense canopies until the 80′s and they have pro-gressively disappeared leaving barren substrate due to the
anthro-pogenic pollution (Le Danois et al., 1925; Darmoul, 1988; De Gaillande
(1970a,b); Hattour and Ben Mustapha, 2013). Data on living (stained)
foraminifera from station LA-10 are from a study of the Djerba Lagoon
fromEl Kateb et al. (2018a). Coastal stations were collected along the
shoreline at a shallow depth (< 1 m) and cover > 200 km of the eastern
Tunisian coast (Fig. 1B and C). Djerba and Gabes transects were
sam-pled perpendicularly to the coastline and cover a 17.3 km and a 13.8 km long sections, respectively; stations are at approximately 1 km
intervals (Fig. 1D and E) (El Kateb et al., 2018b). Sediment samples
from both transects were collected using an Ekman-Birge box core (15 × 15 × 30 cm), which was deployed from a small fishing boat. Sediments from coastal stations were manually collected using plastic containers. The whole sample set was treated following the FOBIMO
protocol (Schönfeld et al., 2012). The first centimeter of the surface
sediment was collected in plastic bottles and treated with a rose Bengal solution (2 g/L in alcohol at 90%). Living (stained) foraminifera were investigated with a Nikon SMZ18 microscope, picked, counted and stored in plummer cells. Taxonomy at genus and species level follows
Cimerman and Langer (1991); Hottinger et al. (1993); Loeblich and
Tappan (1994); Milker and Schmiedl (2012).
Fig. 1. Location maps of the investigated region. A) The Mediterranean Sea; B) The Gulf of Gabes, the stylized factory indicates the position of the main phosphate industrial complexes; C) Position of the coastal stations, the stylized factories indicate the position of the main phosphate industrial complexes; D) Position of the Gabes transect; E) Position of the Djerba transect.
3.2. Benthic foraminifera biotic indices
Five biotic indices were calculated based on the relative abundances of living (stained) foraminifera categorized into different ecological
groups (Tables 1 and 2). Stained foraminifera are here used because
they are representative of the assemblages under certain environmental conditions (degrees of pollution) at the time of sampling.
The diversity index of Bouchet et al. (2012) is based on the
Shannon-Wiener index (H’, log2) (Shannon and Weaver, 1963), which
expresses the diversity of micro- and macro-fauna. However, since species may be unobserved in the community, H’ may be biased due the
under-sampling (Chao and Shen, 2003; Bouchet et al., 2012).
There-fore, the correction of Shannon's index (H′bc) proposed byChao and
Shen (2003) is applied in order to provide true diversity (effective
number of species) as an exponential function of H’bc.Hence the index
is expressed by the Eq. (1):
exp(H’)bc(seeBouchet et al., 2012for further details)
The EcoQS classes developed for the Italian coastal environments by
Bouchet et al. (2018) are applied in this study based on their
geo-graphical proximity to the Gulf of Gabes. Five different EcoQS classes based on diversity index values are defined from poor (< 3) to excellent
(> 15) (Table 2).
The %TSstdindex (Barras et al., 2014) assumes a calculated
stan-dardized percentage of stress-tolerant species taking into consideration the percentage of samples with a mean grain-size < 63 μm. This index is defined by the following Eq. (2):
=
TS TS TS TS
% std [( x % ref)/(100 % ref)] 100 (see Barras et al., 2014 for further details)
where %TSx is the percentage of tolerant species and %TSref is the
theoretical percentage of tolerant species. “Stress-tolerant” species are those very abundant in stressed conditions, such as eutrophication or
when there is a significant supply of fine-grained sediments. %TSstd
values close to 0% should indicate pristine and healthy environments and values close to 100% should indicate impacted environments
(Table 2). Due to the presence of a few tolerant species in our study
sites, as proposed byBarras et al. (2014), the %TSstdwas calculated
using the ecological groups of the FSI (Dimiza et al., 2016) coupled with
those species assigned to ecological groups in the Mediterranean Sea
(Jorissen et al., 2018). We assume that the stress-tolerant (Str) in
Dimiza et al. (2016)are represented by the sum of %GIII (species
tol-erant to excess OM enrichment), %GIV (second order opportunistic
species) and %GV (first-order opportunistic species) ofJorissen et al.
(2018), which correspond to the TSxinBarras et al. (2014).
The FSI (Dimiza et al., 2016) is based on the relative percentage of
two ecological groups: sensitive (Sen) and stress-tolerant (Str) and is calculated following the Eq. (3):
= +
FSI (10 Sen) (Str) (see Dimiza et al., 2016 for further details)
The FSI ranges from 0 (azoic sediments) to 10 (pristine
environ-ments) (Table 2).
To investigate the environmental conditions of ecosystems that naturally would be colonized by meadows of P. oceanica and other
seagrass species, the FI’ and ILS epiphytic foraminiferal indices of
Mateu-Vicens et al. (2014), based on five foraminiferal morphotypes
(Table 1), were used. For comparing the FI’ and ILSwith the FoRAM
Index (seeHallock et al., 2003; modified slightly byCarnahan et al.,
2009) we assumed the same ecological distinctions that the
symbiont-bearing and sensitive taxa are represented by the morphotypes SB and A*; stress-tolerant species correspond to the morphotype D*; and the heterotrophic species are represented by B* and C* morphotypes
(Table 1). The FI’ and ILSare defined by the following two Eqs. (4–5):
= + + + +
FI 10 (PA PSB) PD 2 (PB PC)
= + + +
ILS (3.5 (PA P )SB 0.1)/(PD 0.1)
(seeTable 1andMateu-Vicens et al., 2014for further details)
For both indices, values above 4 indicate optimal conditions while
values lower than 2 indicate stressed conditions (Table 2). The ILS is
conceived to magnify the difference between well preserved and stressed environments of P. oceanica meadows.
For the Foram-AMBI, benthic foraminiferal species attribution into five ecological groups are defined based on their response to OM
en-richment (Alve et al., 2016; Jorissen et al., 2018). GI) Very sensitive
species; GII) Indifferent species; GIII) Tolerant species ; GIV) Second order opportunistic and GV) First-order opportunistic species. This index is expressed by the following Eq. (6):
The index ranges from 0 (unpolluted) to 7 (azoic) reflecting the
degree of pollution (Table 2).
3.3. Statistical treatment
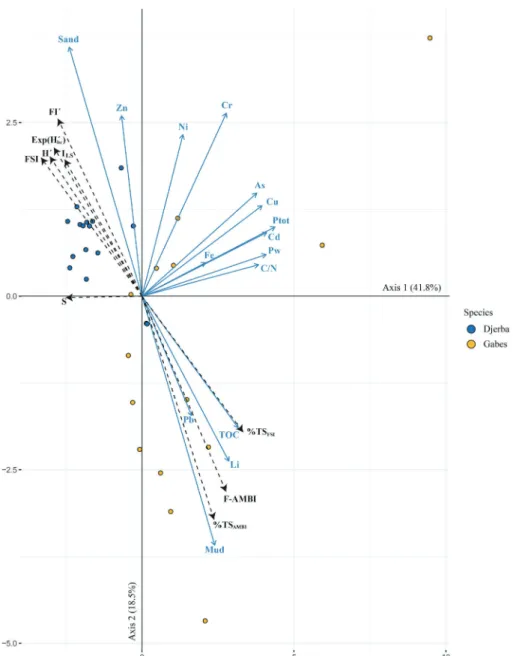
A Principal Component Analysis (PCA) was carried out to highlight discrete relationships between the environmental variables and biotic
indices (Fig. 2). Except for species richness (S), the data on TOC (Total
Organic Carbon), grain-size, total phosphorous, and heavy metal
con-centrations in the sea water are fromEl Kateb (2018) and El Kateb et al.
(2018b) (Supplementary Material 2). A unit variance scaling
(Auto-scaling) was adopted as the data pre-treatment approach. The data for each variable was mean-centered and then divided by the standard deviation of the variable. For the analysis, the following variables were
considered: grain-size (mud and sand), TOC, Ptot, C/N and metals (As,
Cd, Cu, Ni, Fe, Cr, Li, Pb, Zn, P). The measurements of these variables were used, as they were available for all sampling stations along Gabes
Table 2
Threshold values of the biotic indices used in this study.
Epiphytic foraminifera Diversity index Percentage of tolerant species Foram Stress Index Foram-AMBI
Mateu-Vicens et al. (2014) Bouchet et al. (2018) Barras et al. (2014) Dimiza et al. (2016) Alve et al. (2016) FI' & ILS Ecological status H'bc Ecological status %TSstd Ecological status FSI Ecological status AMBI Ecological status
0–2 Stressed
environment
< 3 Poor 100 anthropogenic impact
environment
0 Azoic sediment 6–7 Azoic
3–7 bad 1–2 Heavily poluted
environment
5.6–6 Heavily polluted environment
7–11 moderate 2–5.5 Moderately polluted
environment
3.3–5 Polluted environment
11–15 good 5–9 Slightly polluted
environment
1.2–3.3 Slightly polluted > 4 Optimal condition > 15 excellent 0 Pristine environment 9–10 Pristine environment 0.2–1.2 Unpolluted environment
= + + + +
Foram AMBI [(0 %GI) (1.5 %GII) (3 %GIII) (4.5 %GIV) (6 %GV)]/100 (see Alve et al. , 2016 and Jorissen et al. , 2018 for further details)
and Djerba transects. The biotic foraminiferal-based indices were plotted as supplementary variables. Supplementary variables were not
used to calculate the principal components. The R software (RCore
Team, 2018) was used for statistical computing and graphics, by using
the following packages: FactoMineR (Husson et al., 2019), factoextra
(Kassambra and Mundt, 2017), corrplot (Wei et al., 2017). A draftsman
plot was used to highlight and validate the associations between the
environmental variables and the biotic indices (Supplementary Material
3).
4. Results
One hundred and sixty-three species were identified and 6887 living (stained) specimens were counted. Species abundances and assemblage
composition for each sample are inSupplementary Material 4.
The lowest species richness (S) along the Gabes transect is recorded at station GBS-01 (5 species) and the highest at stations GBS-12 and 13 (37 species). Samples from station GBS-03 are devoid of benthic for-aminifera (0 species). Species richness is remarkably higher along the Djerba transect with S values fluctuating from 21 21) to 48 (DJB-12). Forthy-eight species are also documented in station LA-10B,
whereas S varies from 12 (CST-2) to 25 (CTS-05) among the other
coastal stations (Table 3).
Variations in the H’(log2) diversity index range from 1.2 (GBS-09) to
3.8 (GBS-12) along the Gabes transect and from 1.69 (DJS-01) to 4.4
(DJB-05, DJB-11 and DJB-12) along the Djerba transect (Table 3).
At station LA-10B, H’(log2) is 4.4, and among the other coastal
stations it varies from 2.3 (CTS-07) to 3.6 (CTS-02).
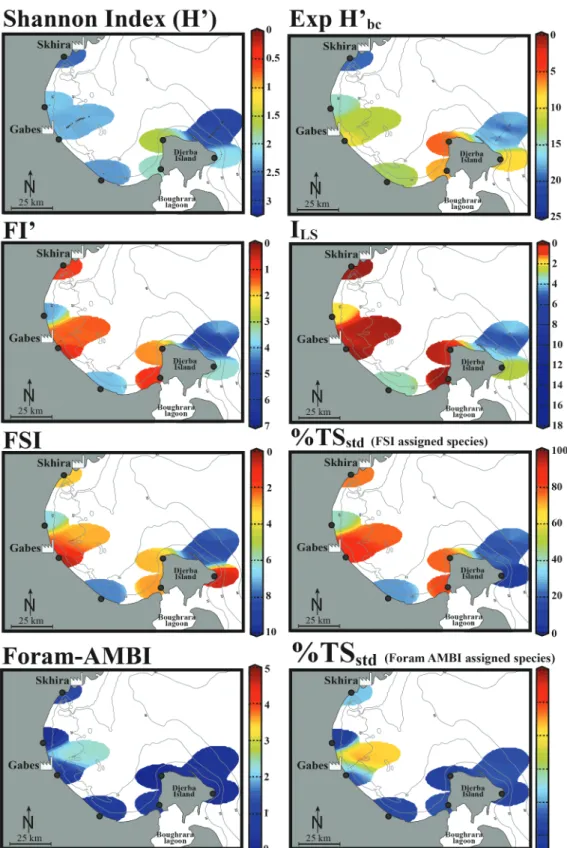
The exp(H’)bcvaries from 3 to 16 along the Gabes transect, from 3 to
24 along the Djerba transect and from 6 to 19 along the coastal stations
and has a value of 8 at LA-10B (Table 3;Fig. 3).
The standardized percentage of tolerant species (%TSstd) for FSI and
Foram-AMBI are significantly higher along the Gabes transect than
Djerba transect, especially in their distal parts (Table 3;Fig. 3). From
GBS-07 to GBS-16, the standardized percentage of tolerant species varies between 63.2 and 100 % (Foram-AMBI assigned species)
(Table 3;Fig. 3). Along the distal part of the Djerba transect (from
DJB-04 to DJB-15) the standardized percentage of tolerant species never
exceeds 42% (Table 3; Fig. 3). At LA-10B the values are of 6.7 (FSI
assigned species) and 5.1 (Foram-AMBI assigned species) (Table 3).
The epiphytic foraminiferal indices (FI’ and ILS) vary significantly
between the Gabes and Djerba transects and coastal stations (Table 3;
Fig. 2. Principal Component Analysis (PCA) plot to visualize the associations between pollutants and biotic indices.
Table 3 Numbers of total living specimens and species, values of diversity indices (Shannon H’ and Fischer α), and calculation of the biotic indices used in th e study. TOC stands Total Organic Content (data from El Kateb et al., 2018b ). Stained specimens Species Richness (S) Fisher α
Shannon index H'(log2) Diversity index Exp (H’bc) FI' ILS FSI NA specimen % %Tsref % TS std (Foram-AMBI assigned species) % TS std (FSI assigned species) Foram- AMBI NA specimen % TOC (%) ( El Kateb et al. 2018b ) Gabes Transect (GBS) GBS-01 8 5 5.7 2.156 8 1.5 0.2 2.1 0.0 5.8 36.3 86.7 1.5 37.5 0.43 GBS-02 61 8 2.5 2.174 5 2.2 0.6 1.5 1.6 1.5 47.3 94.9 2.2 14.8 3.34 GBS-03 0 0 0.0 NA NA NA NA NA NA NA NA NA NA NA NA GBS-04 29 13 9.1 3.316 14 2.2 0.8 8.2 48.3 0.3 10.9 19.8 0.5 69.0 0.13 GBS-05 119 19 6.4 3.143 10 1.9 0.5 7.4 26.1 0.3 37.0 28.2 1.4 57.1 0.23 GBS-06 336 28 7.3 3.587 13 1.2 0.1 2.9 32.4 0.7 50.4 79.2 1.9 22.6 0.80 GBS-07 343 30 7.9 3.257 11 1.2 0.1 2.4 11.1 1.2 71.8 84.4 2.5 17.2 0.60 GBS-08 182 26 8.3 3.366 12 1.3 0.2 2.2 11.5 3.0 74.6 86.5 2.6 28.6 1.93 GBS-09 48 6 1.8 1.165 3 1.2 0.1 1.2 0.0 19.6 100.0 97.4 3.1 4.2 3.38 GBS-10 215 26 7.7 3.258 11 1.9 0.4 3.0 3.3 5.5 63.7 76.1 2.3 22.8 1.40 GBS-11 404 37 9.9 3.29 11 1.4 0.2 2.8 6.9 5.1 68.9 78.7 2.3 17.8 1.30 GBS-12 307 37 11.0 3.796 16 1.4 0.2 2.8 6.5 1.3 68.4 80.2 2.5 29.0 0.67 GBS-13 199 26 8.0 3.029 10 1.4 0.1 3.8 7.0 6.0 54.2 67.2 1.9 24.1 1.66 GBS-14 165 30 10.7 3.459 14 1.7 0.3 2.8 17.0 1.3 64.0 79.3 2.2 24.8 0.63 GBS-15 196 27 8.5 2.941 9 1.4 0.1 2.9 5.1 8.8 68.8 76.4 2.3 15.8 1.18 GBS-16 273 28 7.8 3.443 12 1.3 0.2 2.9 4.4 2.3 63.2 78.8 2.5 20.5 1.30 Djerba Transect (DJB) DJB-01 1174 35 6.8 1.687 3 2.7 2.6 9.3 4.1 1.1 23.6 7.0 0.8 81.5 2.73 DJB-02 85 15 5.3 3.3 11 4.9 4.6 6.6 7.1 0.3 12.4 37.8 0.5 25.9 0.08 DJB-03 77 25 12.9 4.093 22 4.6 3.9 6.3 9.1 0.4 13.7 41.2 0.5 26.0 0.13 DJB-04 148 33 13.2 4.129 21 5.1 5.7 8.9 17.6 0.4 10.8 11.9 0.4 20.9 0.11 DJB-05 205 36 12.7 4.402 24 4.3 3.3 7.7 19.0 0.5 21.8 24.9 0.7 25.4 0.18 DJB-06 99 22 8.8 3.74 16 5.5 6.4 8.4 20.2 0.5 7.3 17.3 0.3 34.3 0.05 DJB-07 108 21 7.8 3.274 12 7.0 15.4 9.8 23.1 0.3 1.0 2.1 0.0 28.7 0.19 DJB-08 140 29 11.1 3.544 15 5.0 6.3 9.0 7.9 0.4 6.2 10.5 0.2 12.9 0.14 DJB-09 131 28 10.9 3.953 18 5.1 3.9 8.3 9.9 0.5 16.0 18.2 0.6 21.4 0.38 DJB-10 122 25 9.5 3.752 16 5.1 4.8 6.8 9.0 0.8 26.3 35.5 0.9 23.8 0.63 DJB-11 193 35 12.5 4.408 24 5.5 7.0 8.1 30.6 0.4 11.3 20.5 0.4 37.8 0.35 DJB-12 416 48 14.0 4.425 24 5.5 7.0 8.8 23.6 0.5 7.1 12.5 0.3 39.7 0.33 DJB-13 195 27 8.5 4.168 19 4.6 3.4 8.8 43.1 0.4 7.1 13.2 0.3 37.9 0.21 DJB-14 117 25 9.7 3.861 17 4.9 6.2 9.0 23.1 0.3 12.5 10.8 0.5 33.3 0.13 DJB-15 115 23 8.6 3.719 15 2.7 1.8 6.2 17.5 1.0 23.2 42.0 0.8 16.5 0.27 Coastal Stations (CTS) CST-01 24 13 11.6 3.403 17 2.7 1.8 9.1 12.5 0.3 5.6 9.3 0.3 29.2 0.05 CST-02 35 17 13.0 3.642 19 1.2 0.1 3.1 14.3 2.0 24.4 76.2 1.3 22.9 0.21 CST-03 23 12 10.1 3.22 15 4.1 2.0 6.3 4.3 0.5 −0.5 40.6 0.2 13.0 0.16 CST-04 0 NA NA NA NA NA NA NA NA 0.3 NA NA NA NA 0.00 CST-05 132 25 9.1 3.416 13 4.0 3.3 7.5 6.1 0.3 8.0 27.2 0.5 45.5 0.22 CST-06 262 13 2.9 2.798 7 1.0 0.1 2.7 9.9 0.7 10.9 80.8 0.5 17.2 0.46 CST-07 201 17 4.4 2.365 6 1.6 0.3 3.0 4.5 0.3 3.0 78.1 0.2 10.9 0.35 LA-10b 2372 48 8.5 4.4 8 3.5 2.6 9.4 29.4 1.0 5.1 6.7 0.2 22.4 0.90
http://doc.rero.ch
Fig. 3). The FI’ values were the lowest along the Gabes transect ranging from 1.2 (GBS-06/07) to 2.2 (GBS-02/04) followed by the coastal sta-tions CST-06 and CST-03 with values ranging from 1 to 4.1, respec-tively. The Djerba transect had the highest values overall, ranging from
2.7 (DJB-01/15) to 7 (DJB-07), whereas at LA-10B it is 3.5 (Table 3;
Fig. 3). Differences in ILSvalues between the Gabes and Djerba transects
are also remarkable (Table 3;Fig. 3). They fluctuate between 0.1
(GBS-06/07/09/13/14) and 0.8 (GBS-04) at Gabes and from 1.8 (DJB-15) to
15.4 (DJB-07) at Djerba. The ILSvalues vary from 0.1 (CST-02/06) to
3.3 (CST-05) at the coastal stations and is 2.6 at LA-10B (Table 3;
Fig. 3).
The values of FSI do not exceed 8.2 (GBS-04) along the Gabes transect with a minimum value of 1.2 (GBS-09) while along the Djerba transect they vary from 6.2 (DJB-15) to a maximum of 9.8 (DJB-07)
(Table 3;Fig. 3). The coastal stations have FSI values between 2.7
(CST-06) and 9.4 (LA-10B) (Table 3;Fig. 3).
Fig. 3. Graphical representation of the ecological quality status in the Gulf of Gabes. Data are spatially interpolated with the DIVA software tool (Data-Interpolating Variational Analysis,Troupin et al., 2012).
The Foram-AMBI values along the Gabes transect are slightly higher
than the values from the Djerba transect and coastal sites (Table 3;
Fig. 3). They fluctuate from 0.5 (GBS-04) to 3.1 (GBS-09) along the
Gabes transect, however, they never exceed 0.9 (DJB-10) along the Djerba transect. The Foram-AMBI varies from 0.2 to 1.3 at the coastal
stations, and is 0.2 at LA-10B (Table 3;Fig. 3).
There were in total 18 Eigen values in the PCA. The first two axes account for 60.3% of the total variance (41.8% and 18.5% respectively)
(Fig. 2). All variables are well represented by the first two dimensions
except for Fe, Ni, Pb and Zn (Fig. 2). As, Cd, Cu, Cr, Li, TOC, Ptotand C/
N contribute to the first axis while Grain-size (sand and mud), mostly,
to the second (Fig. 2). All the variables (except for Zn and Sand) are
placed at the right of the first axis. The majority of the sampling stations from the Gabes and Djerba transects show positive and negative asso-ciation to the first axis, respectively. Whereas on the contrary, the Djerba and Gabes transects show positive and negative association to
the second axis, respectively (Fig. 2).
5. Discussion
The inner part of the Gulf of Gabes is presently affected by intense pollution and the adverse ecological conditions for marine life are
ex-tensively documented (e.g.,El Kateb, 2018; El Kateb et al., 2018b, and
references therein). For this reason, the Gabes transect, positioned within the Gulf of Gabes, was sampled for a direct comparison with the Djerba transect (eastern coast), which was chosen to possibly represent a more “pristine” environment. The most commonly used biotic indices, based on benthic foraminifera, are tested in the present study to prove
their reliability in biomonitoring studies in this region (Fig. 3).
5.1. Geographical distribution of ecological impacts
5.1.1. Gabes
At Gabes, the industrial waste (wastewater, phosphogypsum and sludge) is directly discharged into the Sea. Consequences of this practice, since the 1970s, are seawater acidification, high concentrations of
phos-phorus and fluorine and sea floor siltation (Darmoul et al., 1980; Zaouali,
1993; El Lakhrach et al., 2012). This are responsible for the decline of P.
oceanica meadows in the Gulf of Gabes (Ben Brahim et al., 2010). Factors
such as surface ocean circulation (Guetat et al., 2012), types of
con-taminants (e.g., El Zrelli et al., 2018), and substrate (Zaouali, 1993)
among others, impact the Gulf at different levels. Several investigations report high concentrations of heavy metals in marine sediments and in
the seawater surrounding the Gabes industrial site (Darmoul et al., 1980;
Ayadi et al., 2015; El Zrelli et al., 2015, 2018; Ayadi et al., 2016; El Kateb
et al., 2018b). Of the heavy metals released into the inner section of the
Gulf of Gabes, zinc, copper, mercury and lead have the highest con-centrations ever documented in any marine environment in Tunisia
(Chouba and Mzoughi-Aguir, 2006; Aloulou et al., 2012; Kharroubi et al.,
2012a,b; Ayadi et al., 2015). However, most of these studies only
in-vestigated nearshore environments while a few limited studies analysed the offshore sediments in the central part of the Gulf of Gabes.
As expected, the FI’ and ILSepiphytic foraminiferal indices, % TSstd
(FSI assigned species) and the FSI indicate adverse ecological conditions in the Gulf of Gabes and for the seagrass meadows that once occupied
most of the area (Tables 2 and 3;Fig. 3). This new information suggests
that these indices correctly reflect the ecological status of the marine environment and corroborate previously published data on pollution.
On the contrary, the level of impact determined by the exp(H’)bc,
Foram-AMBI and %TSstd(Foram-AMBI assigned species) are
contra-dictory, suggesting that the overall ecological status is unpolluted to
slightly-moderately polluted in this region (Tables 2 and 3;Fig. 3).
5.1.2. Djerba Island and Skhira
The western coast of Djerba Island has been investigated less in com-parison to the central coast of the Gulf of Gabes and the pollution-related
studies are scarce. Along these coasts, as in other areas of the Gulf of
Gabes, P. oceanica meadows have retreated considerably since early XXth
century and mostly during the last decades, due to anthropogenic activ-ities.
The high phosphorous content in the seawater along the western
coast of the island (Guetat et al., 2012) suggests that this region may
also be influenced by the Gabes phosphate industry due to surface circulation. Heavy metals contamination in surface sediment from the Boughrara lagoon, which is directly connected with the western coast of
Djerba, are reported in Ben Aoun et al. (2007) and Kharroubi et al.,
2012a,b). The provenance of these contaminants may be also linked to
the phosphate industry pollution transported off-shore by tidal currents.
Based on the biotic indices FI’, ILS, FSI and %TSstd(FSI assigned
species), the ecological conditions along the western coasts of Djerba Island seem to be impacted, similarly to Gabes, although to a lower
degree (Tables 2 and 3;Fig. 3). Conflicting results were obtained from
the response of the Foram-AMBI, %TSstd(Foram-AMBI assigned
spe-cies), and the exp(H’)bc. The latter index suggests that the marine
en-vironment has been negatively impacted, while the former two suggests that it is unpolluted. The sites along the eastern coast of Djerba Island (Djerba transect) have been chosen for a direct comparison with the heavily polluted Gulf of Gabes and are considered as remarkably less impacted. Indeed all applied biotic indices confirm this hypothesis.
Although a phosphate treatment complex is present at Skhira, the management practices of the waste product (i.e. phosphogypsum) are
more environmentally conscious when compared to Gabes.
Phosphogypsum wastes are stored on land forming large stacks sur-rounded by dams and basins that control the water runoff in order to
minimize contamination of the marine environment (
GEREP-Environment, 2007). However, despite these environmental
manage-ment practices, heavy metal contamination of marine sedimanage-ments has
been reported around the industrial site (Aloulou et al., 2012; Ayadi
et al., 2016). Additionally, this complex requires large quantities of
industrial fresh water to run the phosphate processing treatment.
Sea-water desalination assures fresh water availability (
GEREP-Environment, 2007) without compromising the aquifers, which are rare
in this region (e.g.Ben Alaya et al., 2014; Chandoul et al., 2015).
De-salination produces brackish water, which is discharged into the sea
(GEREP-Environment, 2007) and therefore, is impacting the
environ-ment (Einav et al., 2003) by significantly decreasing the salinity,
leading to a reduction in seagrass habitat (i.e., P. oceanica) (
Fernández-Torquemada and Sánchez-Lizaso, 2005; Gacia et al., 2007). Brackish
waters, as desalination byproducts, also influence the density of
sub-tropical living benthic foraminifera (Chesher, 1975). Similarly,
ecolo-gical responses of stress-sensitive benthic foraminifera to brackish
water were observed in the Djerba lagoon, on the eastern coast by (El
Kateb et al., 2018a). The FI’, ILS, FSI and %TSstd(FSI assigned species),
show impacted environment while the Foram-AMBI, %TSstd
(Foram-AMBI assigned species), and the exp(H’)bcshow good ecological
con-ditions at Skhira (Tables 2 and 3;Fig. 3).
5.2. Epiphytic foraminifera vs. Posidonia oceanica in the Gulf of Gabes
The importance of preserving P. oceanica seagrass meadows has re-cently been stressed by the IUCN (International Union for Conservation of
Nature), highlighting the role of their ecosystemic services (Pergent et al.,
2016). In particular, the IUCN “red list of threatened species” stresses that
P. oceanica populations along the Mediterranean Sea coasts are currently
decreasing mainly due to anthropogenic activities. This plant, endemic of the Mediterranean Sea, is very sensitive to environmental variability, and for this reason is a good indicator of the ecosystem’s health. The cover area of this seagrass species can vary through time (few months to few years), depending on multiple stress factors (e.g. anthropogenic pressure), that consequently affects benthic foraminiferal populations on a short time scale (days to weeks).
There are protocols to directly assess the environmental state of
seagrass meadows (e.g. POMI –Romero et al., 2007) that are expensive and time consuming. However, the use of epiphytic foraminifera has proven to be advantageous in terms of reliability and low economical
cost. The FI’ and ILSshow stressed environments in a large part of the
Gulf of Gabes (Tables 2 and 3;Fig. 3), which are no longer suitable for
seagrass growth in contrast with previous decades. For example, no-ticeable variations in P. oceanica coverage in the Gulf of Gabes are limited to their proximity to the industrial waste discharge effluents at
Gabes (Darmoul et al., 1980). A recent study on P. oceanica meadows in
the Gulf of Gabes documents a significant decrease in cover post 1970
(El Zrelli et al., 2017). The epiphytic foraminiferal indices reflect well
the current environmental conditions for P. oceanica in the same area (from CST-03 to CST-05). As expected, station CST-04 which is in proximity to the industrial effluents is completely devoid of P. oceanica
meadows (El Zrelli et al., 2017) and the FI’ and ILSindices values reflect
conditions unsuitable for its growth (Tables 2 and 3;Figs. 1, 3).
Simi-larly, at Stations CST-03 and CST-05, where seagrass meadows are
present and form littoral belt and/or patches (El Zrelli et al., 2017),
both indices indicate favorable ecological conditions suitable for
growth and seagrass establishment (Tables 2 and 3;Figs. 1, 3). Along
the Gabes transect P. oceanica totally disappeared (Zaouali, 1993; El
Kateb et al., 2016; El Kateb et al., 2018b) and the indices reflect the
lowest values indicative of unsuitable growth conditions (Tables 2 nd 3;
Fig. 3). The same indices show optimal conditions for growth along the
Djerba transect, where P. oceanica forms large meadows (El Kateb et al.,
2018b) (Tables 2 and 3;Figs. 1, 3). The distribution of P. oceanica has
never been described along the western coast of Djerba Island (CST-06 and CST-07); close to the Skhira phosphate industry (CST-02) and in the
Gulf of Hammamet (CST-01) (Fig. 1). The low epiphytic index values
close to Skhira (Fig. 3) certainly reflect unfavorable conditions
asso-ciated with extensive industrial activity and subsequent contamination
of surface sediment with heavy metals (Aloulou et al., 2012; Ayadi
et al., 2016). Although no information is available on the
environ-mental condition also in the Gulf of Hammamet, P. oceanica meadows are relatively well established (El Kateb, pers. observ.). In this area, the intense tourism seems to not have a major effect on the nearshore en-vironment and may even contribute to the protection of the marine coastal environment. This is also the case for the Djerba transect where
the ecological conditions are considered as optimal (El Kateb et al.,
2018b;Tables 2 and 3;Fig. 3).
5.3. Validation of results
Of all the ecological signals given by the indices used in this study,
the FI’ and ILSepiphytic foraminiferal indices coupled with %TSstdand
FSI reflect maximum ecological impact, while the exp(H’)bc and the
coupled Foram-AMBI and % TSstd(Foram-AMBI assigned species),
re-spectively reflect lower environmental ecological status and pristine
conditions (Tables 2 and 3;Fig. 3).
In order to test the results, a PCA plot was obtained to show possible
discrete relationships between pollutants and biotic indices (Fig. 2). This
plot shows that the majority of the Gabes samples positively associate with a higher muddy sediment fraction, TOC, total phosphorus and heavy metal concentrations in the sea water. Additionally, there is a relation with the Foram-AMBI and %TS indices. In general, OM content is associated to the
smaller sediment size fractions, from mud to silt (e.g.,Ackermann et al.,
1983; Bergamaschi et al, 1997; Lakhan et al., 2003; Andrieux-Loyer and
Aminot, 2001). In these sediments, opportunistic/stress tolerant benthic
foraminiferal species are also dominant (e.g.,Alve et al., 2016; Jorissen
et al., 2018). As both indices are based on the abundances of more
sen-sitive versus opportunistic species this would explain the link between the Foram-AMBI and the %TS indices at Gabes, which is characterized by intense sea floor siltation. The positive association of the Foram-AMBI and the %TS indices with pollutants such as Pb and Li can be explained by the proximity of the Gabes stations to the pollution source (industrial complex,
Fig. 1).
Djerba transect samples on the contrary, appear to positively as-sociate with higher values in the coarser sediment fraction (sand), of the epiphytic indices and the FSI, together with higher concentrations of Zn in sea water as the only pollutant, although as stated Zn is not entirely represented by the first two PCA axes. Coarser sediments were
indeed recovered along the Djerba transect (Supplementary Material 2).
Furthermore, along this transect P. oceanica meadows are still present
(El Kateb et al., 2018b), which further supports the link with the
epi-phytic indices as they are based on species living attached to Posidonia. The association of the Djerba stations to high Zn concentrations de-serves some comment. Zinc has been identified as the most abundant heavy metal in the Gulf of Gabes in sediments recovered in front of the
industrial complex (El Zrelli et al., 2015). Yet, elevated Zn
concentra-tions were not documented in the seawater along the Gabes transect in
El Kateb (2018) (Supplementary Material 2). Zinc precipitation and
migration into the sediments may account for these low concentrations
in the seawater (Ayadi et al., 2015), and this hypothesis is further
supported by the documentation of sphalerite near the industrial
complex (El Kateb et al., 2018b). Along the Djerba transect, Zn
con-centrations in seawater (from 14 to 104 μg/L) are generally higher
(Supplementary Material 2) than the usual Zn concentrations in
sea-water ranging from 0.4 to 5 μg/L (Moore and Ramamoorthy, 1984).
Two processes may account for this discrepancy, firstly Zn may be transported by currents flowing from the coast to offshore during low
tides (Othmani et al., 2017) or alternatively decaying plankton may be
releasing Zn in the seawater (Moore and Ramamoorthy, 1984). This
latter hypothesis is favoured since it is supported by stable carbon isotopic composition of sedimentary organic matter from the distal part of the Gabes transect, reflecting a high abundance of marine
phyto-plankton-derived organic matter (El Kateb et al., 2018b).
5.4. Foram-AMBI and its presently underestimated ecological condition
The recently proposed Foram-AMBI reflects changes in
environ-mental disturbances along a gradient of increased organic matter (Alve
et al., 2016; Jorissen et al., 2018). Organic matter has been chosen to
develop the Foram- AMBI since its presence and abundance is related to mud content in sediments, it impacts dissolved oxygen and, more im-portantly, pollutants like heavy metals and polychlorinated biphenyls
(PCBs) strongly associate with organic matter (Milliman, 1994; Schorer,
1997; Bergamaschi et al., 1997; Martínez-Colón et al., 2009; Alegría
et al., 2016). Indeed an organic matter trend is observed in the Gulf of
Gabes (El Kateb et al., 2018b). However, the actual application of the
Foram-AMBI, in the investigated region, presents some limitations. In particular, the Foram-AMBI values obtained for the area surrounding the industrial waste discharge at Gabes and Skhira indicate that these environments are only slightly polluted, compared to other indices
showing heavily polluted conditions (Tables 2, 3;Fig. 3). The highest
Foram-AMBI values are obtained from the distal section of the Gabes
transect (Table 3;Fig. 3), which is especially affected by the industrial
pollution and is rich in TOC (El-Kateb et al., 2018b).
In this study the correlation between the Foram-AMBI with TOC and
all other pollutants (Supplementary Material 3) suggests that the
Foram-AMBI, as it is presently applied, does not properly reflect EcoQS,
as the AMBI of Borja et al. (2000)does for macrofauna. Similarly to
Alve et al. (2016), the applied equation and coefficients proposed by
Borja et al. (2000)for benthic macrofauna where implemented here for
living (stained) benthic foraminifera. Adapted coefficients and/or a
modification of theBorja et al. (2000)equation may better represent
the real ecological status. Therefore, additional work to produce weighted coefficients for benthic foraminifera is necessary. In addition, several samples have low foraminiferal densities of living specimens,
which limits species assignment to ecological groups (Alve et al., 2016;
Jorissen et al., 2018). In this study 64% of the samples exceeded the
20% threshold of unassigned species, which invalidates the proper use
and effectiveness of the Foram-AMBI (Supplementary Material 4).
6. Conclusions
The biotic indices FI’ and ILS, % TSstdand FSI, and exp(H’bc), based
on living foraminiferal assemblages, reflect highly impacted environ-ments in a large part in the Gulf of Gabes due to the pollution by the phosphate industries. The indices indicate that the most impacted areas are the central part of the Gulf, the western coast of Djerba Island and the regions surrounding the Skhira phosphate industry, confirming di-rect observations and geochemical data. This pollution has severely affected the P. oceanica meadows in the Gulf of Gabes and is expressed
by low epiphytic foraminiferal indices (FI’ and ILS) values, which seem
to be the best indices to apply in this region. The application of the recently developed Foram-AMBI is presently not appropriate to assess the ecological conditions in the Gulf of Gabes since a large percentage of the present species are not assigned to ecological groups. Before its routine application in biomonitoring, additional studies are needed to increase the number of species assigned to ecological groups and to adapt the coefficients in the Foram-AMBI equation to foraminiferal assemblages. However, this index as it is, reflects relatively well the sedimentary organic matter distribution within the Gulf of Gabes.
Credit authorship contribution statement
Akram El Kateb: Investigation, Methodology, Conceptualization,
Visualization. Claudio Stalder: Resources, Conceptualization. Michael
Martínez-Colón: Conceptualization, Writing - review & editing. Guillem Mateu-Vicens: Conceptualization, Writing - review & editing. Fabio Francescangeli: Formal analysis, Writing - review & editing. Giovanni Coletti: Visualization, Writing - review & editing. Stephanie Stainbank: Formal analysis, Writing - review & editing. Silvia Spezzaferri: Supervision, Funding acquisition, Resources, Conceptualization, Writing - review & editing.
Acknowledgments
We are very grateful to Kamel El Kateb, who greatly helped during the organization of the field work in the Gulf of Gabes. Thanks to the FOBIMO members for the fruitful discussions about biotic indices. We acknowledge the reviewers for their valuable comments that help to improve considerably this manuscript. This research was supported by the Swiss National Science Foundation grant 200021_149589.
Appendix A. Supplementary data
Supplementary data to this article can be found online athttps://
doi.org/10.1016/j.ecolind.2019.105962.
References
Ackermann, F., Bergmann, H., Schleichert, U., 1983. Monitoring of heavy metals in coastal and estuarine sediments-a question of grain-size: < 20 μm versus < 60 μm. Environ. Technol. 4, 317–328.
Alegría, H., Martínez-Colón, M., Kurt-Karakus, P., Brooks, G., Hanson, L., Birgul, A., 2016. Historical sediment record and levels of PCBs in sediments and mangroves of Jobos Bay, Puerto Rico. Sci. Total Environ. 573, 1003–1009.
Aloulou, F., EllEuch, B., Kallel, M., 2012. Benthic foraminiferal assemblages as pollution proxies in the northern coast of Gabes Gulf, Tunisia. Environ. Monitor. Assess. 184 (2), 777–795.
Alve, E., Korsun, S., Schönfeld, J., Dijkstra, N., Golikova, E., Hess, S., Husum, K., Panieri, G., 2016. Foram-AMBI: A sensitivity index based on benthic foraminiferal faunas from North-East Atlantic and Arctic fjords, continental shelves and slopes. Mar. Micropaleontol. 122, 1–12.
Andrieux-Loyer, F., Aminot, A., 2001. Phosphorus forms related to sediment grain size and geochemical characteristics in French coastal areas. Estuar. Coast. Shelf Sci. 52, 617–629.
Ayadi, N., Aloulou, F., Bouzid, J., 2015. Assessment of contaminated sediment by phos-phate fertilizer industrial waste using pollution indices and statistical techniques in the Gulf of Gabes (Tunisia). Arabian J. Geosci. 8 (3), 1755–1767.
Ayadi, N., Zghal, I., Aloulou, F., Bouzid, J., 2016. Impacts of several pollutants on the distribution of recent benthic foraminifera: the southern coast of Gulf of Gabes, Tunisia. Environ. Sci. Pollut. Res. 23 (7), 6414–6429.
Aylagas, E., Borja, A., Tangherlini, M., Dell’Anno, A., Corinaldesi, C., Michell, C.T., Irigoien, X., Danovaro, R., Rodríguez-Ezpleta, N., 2017. A bacterial community-based index to assess the ecological status of estuarine and coastal environments. Mar. Pollut. Bull. 114, 679–688.
Barras, C., Jorissen, F.J., Labrune, C., Andral, B., Boissery, P., 2014. Live benthic for-aminiferal faunas from the French Mediterranean Coast: towards a new biotic index of environmental quality. Ecol. Ind. 36, 719–743.
Ben Alaya, M.B., Saidi, S., Zemni, T., Zargouni, F., 2014. Suitability assessment of deep groundwater for drinking and irrigation use in the Djeffara aquifers (Northern Gabes, south-eastern Tunisia). Environ. Earth Sci. 71 (8), 3387–3421.
Ben Aoun, Z., Farhat, F., Chouba, L., Hadj Ali, M.S., 2007. Investigation in possible chemical pollution of the Bougraha lagoon, south of Tunisia, by chemical wastes. Bulletin Institut national scientifique et technique d’Océanographie et de Pêche Salammbô 34, 119–127.
Ben Brahim, M., Hamza, A., Hannachi, I., Rebai, A., Jarboui, O., Bouain, A., Aleya, L., 2010. Variability in the structure of epiphytic assemblages of Posidonia oceanica in relation to human interferences in the Gulf of Gabes, Tunisia. Mar. Environ. Res. 70 (5), 411–421.
Ben Mustapha, K., Hattour, A., 2015. Le couvert végétal marin du golfe de Gabes: État des lieux, intérêt et bénéfices, in: Proceedings of the conference. Les journées de la biodiversité et de la biosécurité aux services de développement durable, Djerba, pp. 152.
Ben Mustapha, K., Hattour, A., Mhetli, M., El Abed, A., Tritar, B., 1999. Bionomie des étages infra et circalittoral du golfe de Gabès. Bulletin Institut national scientifique et technique d’Océanographie et de Pêche Salammbô 26, 5–48.
Bergamaschi, A., Tsamakis, E., Keil, R.G., Eglinton, T.I., Montluçon, D.B., Hedges, J.I., 1997. The effect of grain size and surface area on organic matter, lignin and carbo-hydrate concentration, and molecular compositions in Peru Margin sediments. Geochim. Cosmochim. Acta 61, 1247–1260.
Birk, S., Bonne, W., Borja, A., Brucet, S., Courrat, A., Poikane, S., Solimini, A., van de Bund, W., Zampoukas, N., Hering, D., 2012. Three hundred ways to assess Europe's surface waters: an almost complete overview of biological methods to implement the Water Framework Directive. Ecol. Ind. 18, 31–41.
Borja, A., Franco, J., Pérez, V., 2000. A marine biotic index to establish the ecological quality of soft-bottom benthos within European estuarine and coastal environments. Mar. Pollut. Bull. 40 (12), 1100–1114.
Borja, A., Chust, G., Muxika, I., 2019. Forever young: The successful story of a marine biotic index. Adv. Mar. Biol. 82, 93–127.
Bouchet, V., Alve, E., Rygg, B., Telford, R.J., 2012. Benthic foramnifera provide a pro-mising tool for ecological quality assessment of marine waters. Ecol. Ind. 23, 66–75. Bouchet, V., Frontalini, F., Goberville, E., 2018. Benthic foraminifera to Ecological
Quality Statuses in Italian transitional waters. Ecol. Ind. 84, 130–139. Carnahan, E.A., Hoare, A.M., Hallock, P., Lidz, B.H., Reich, C.D., 2009. Foraminiferal
assemblages in Biscayne Bay, Florida, USA: Responses to urban and agricultural Influence in a subtropical estuary. Mar. Pollut. Bull. 59, 221–233.
Chandoul, I.R., Bouaziz, S., Dhia, H.B., 2015. Groundwater vulnerability assessment using GIS-based DRASTIC models in shallow aquifer of Gabes North (South East Tunisia). Arabian J. Geosci. 8 (9), 7619–7629.
Chao, A., Shen, T.-J., 2003. Nonparametric estimation of Shannon’s index of diversity when there are unseen species in sample. Environ. Ecol. Stat. 10, 429–443. Chen, C.A., Soo, C.L., Balsamo, M., Semprucci, F., 2018. An approach based on nematode
descriptors for the classification of ecological quality (EcoQ) of the Malaysian coasts. Mar. Biodivers. 48 (1), 117–126.
Chesher, R.H., 1975. Biological Impact of a Large-Scale Desalination Plant at Key West, Florida. Elsevier Oceanography Series 12, 99–153.
Chouba, L., Mzoughi-Aguir, N., 2006. Trace metals (Cd, Pb, Hg) and total hydrocarbons in superficial sediments from the coast of Gabes Gulf. Bulletin de l'Institut National des Sciences et Technologies de la Mer 33, 93–100.
Cimerman, F., Langer, M.R. (1991). Mediterranean Foraminifera Slovenska Akademija Znanosti in Umetnosti, 33 (Ljubljana), pp. 118.
Cisse, L., Mrabet, T., 2004. World Phospate Production: Overview and Prospects. Phosph. Res. Bull. 15, 21–25.
Dale, V.H., Beyeler, S.C., 2001. Challenges in the development and use of ecological in-dicators. Ecol. Ind. 1, 3–10.
Darmoul, B., 1988. Pollution dans le golfe de Gabès (Tunisie). Bilan de six années de surveillance (1976–1981). Bull. Inst. Natn. Scient. Tech. Océanogr. Pêche, Salammbô 15, 61–83.
Darmoul, B., Hadj-Ali, M., Vitiello, P., 1980. Effets des rejets industriels de la région de Gabès (Tunisie) sur le milieu marin récepteur. Bulletin Institut national scientifique et technique d’Océanographie et de Pêche Salammbô 7, 5–61.
De Gaillande, D., 1970a. Note sur les peuplements de la zone centrale du golfe de Gabès (Campagne Calypso, 1965). Tethys 2 (1), 131–138.
De Gaillande, D., 1970b. b Peuplements benthiques de l’herbier de Posidonia oceanica (Delile), de la pelouse à Caulerpa prolifera Lamouroux et du large du golfe de Gabes. Téthys 2 (2), 373–383.
Dimiza, M.D., Triantaphyllou, M.V., Koukousioura, O., Hallock, P., Simboura, N., Karageorgis, A.P., Papathanasiou, E., 2016. The Foram Stress Index: A new tool for environmental assessment of soft-bottom environments using benthic foraminifera. A case study from the Saronikos Gulf, Greece, Eastern Mediterranean. Ecol. Indicat. 60, 611–621.
Einav, R., Harussi, K., Perry, D., 2003. The footprint of the desalination processes on the environment. Desalination 152 (1–3), 141–154.
El-Geziry, T.M., Bryden, I.G., 2010. The circulation pattern in the Mediterranean Sea: issues for modeller consideration. J. Operat. Oceanogr. 3, 39–46.
El Kateb, A., 2018. Lesser Syrtis (South of Tunisia): Phosphate industry contamination assessment using a a multidisciplinary approach. PhD Dissertation, University of
Fribourg, pp. 273.
El Kateb, A., Stalder, C., Neururer, C., Pisapia, C., Spezzaferri, S., 2016. Correlation be-tween pollution and decline of Scleractinian Cladocora caespitosa (Linnaeus, 1758) in the Gulf of Gabes. Heliyon 2 (11) e00195.
El Kateb, A., Stalder, C., Neururer, C., Fentimen, R., Spangenberg, J.E., Spezzaferri, S., 2018a. Distribution of benthic foraminiferal assemblages in the transitional en-vironment of the Djerba lagoon (Tunisia). Swiss J. Geosci. 1–18.https://doi.org/10. 1007/s00015-018-0300-0).
El Kateb, A., Stalder, C., Rüggeberg, A., Neururer, C., Spangenberg, J.E., Spezzaferri, S., 2018b. Impact of industrial phosphate waste discharge on the marine environment in the Gulf of Gabes (Tunisia). PLoS ONE 13 (5) e0197731.
El Lakhrach, H., Hattour, A., Jarboui, O., El Hasni, K., Ramos-Esplá, A.A., 2012. Spatial distribution and abundance of the megabenthic fauna community in Gabes Gulf (Tunisia, eastern Mediterranean Sea). Mediterr. Mar. Sci. 13 (1), 12–29. El Zrelli, R., Courjault-Radé, P., Rabaoui, L., Castet, S., Michel, S., Bejaoui, N., 2015.
Heavy metal contamination and ecological risk assessment in the surface sediments of the coastal area surrounding the industrial complex of Gabes city, Gulf of Gabes SE Tunisia. Mar. Pollut. Bull. 101 (2), 922–929.
El Zrelli, R., Courjault-Radé, P., Rabaoui, L., Daghbouj, N., Mansour, L., Balti, R., Castet, S., Attia, F., Michel, S., Bejaoui, N., 2017. Biomonitoring of coastal pollution in the Gulf of Gabes (SE, Tunisia): use of Posidonia oceanica seagrass as a bioindicator and its mat as an archive of coastal metallic contamination. Environ. Sci. Pollut. Res. 24 (28), 22214–22225.
El Zrelli, R., Rabaoui, L., Alaya, M.B., Daghbouj, N., Castet, S., Besson, P., Michel, S., Bejaoui, N., Courjault-Radé, P., 2018. Seawater quality assessment and identification of pollution sources along the central coastal area of Gabes Gulf (SE Tunisia): evi-dence of industrial impact and implications for marine environment protection. Mar. Pollut. Bull. 127, 445–452.
Fernández-Torquemada, Y., Sánchez-Lizaso, J.L., 2005. Effects of salinity on leaf growth and survival of the Mediterranean seagrass Posidonia oceanica (L.) Delile. J. Exp. Mar. Biol. Ecol. 320 (1), 57–63.
Francescangeli, F., Du Chatelet, E.A., Billon, G., Trentesaux, A., Bouchet, V.M.P., 2016. Palaeo-ecological quality status based on foraminifera of Boulogne-sur-Mer harbour (Pas-de-Calais, Northeastern France) over the last 200 years. Mar. Environ. Res. 117, 32–43. Gacia, E., Invers, O., Manzanera, M., Ballesteros, E., Romero, J., 2007. Impact of the brine
from a desalination plant on a shallow seagrass (Posidonia oceanica) meadow. Estuar. Coast. Shelf Sci. 72 (4), 579–590.
Gargouri, D., Azri, C., Serbaji, M.M., Jedoui, Y., Montacer, M., 2011. Heavy metal con-centrations in the surface marine sediments of Sfax Coast Tunisia. Environ. Monitor. Assess. 175 (1–4), 519–530.
GEREP-Environment, 2007. Etude d’impact dur l’environnement de l’usine projetée d’a-cide phosphorique Tifert dans le site de la Skhira. pp. 239.
Guetat, F., Sellem, F., Akroui, F., Brahim, M., Atoui, A., Ben Romdhane, M.S., Daly Yahia, M.N., 2012. Etat environmental de la lagune de Boughrara et ses alentours deux ans après les travaux d’amenagement et d’élargissement du pont d’El Kantara. Bulletin Institut national scientifique et technique d’Océanographie et de Pêche Salammbô 39, 149–160.
Guillaumont, B., Ben Mustapha, S., Ben Moussa, H., Zaouali, J., Soussi, N., Ben Mammou, A., Cariou, C., 1995. Pollution impact study in Gabes Gulf (Tunisia) using remote sensing data. Mar. Technol. Soc. J. 29 (2), 46–58.
Hallock, P., Lidz, B.H., Cockey-Burkhard, E.M., Donnelly, K.B., 2003. Foraminifera as bioindicators in coral reef assessment and monitoring: the FORAM index. Environ. Monit. Assess. 81 (1–3), 221–238.
Hattour, A., Mustapha, Ben, 2013. Le couvert végétal marin du golfe de Gabès: Cartographie et réseau de surveillance de l’herbier de Posidonie. Institut National des Sciences et des Technologies de la Mer, Tunis, pp. 164.
Heink, U., Kowarik, B., 2010. What are indicators ? On the definition of indicators in ecology and environmental planning. Ecol. Ind. 10, 584–593.
Hottinger, L., Halicz, E., Reiss, Z., 1993. Recent foraminifera from the Gulf of Aqaba, Red Sea. Akademija Znanosti in Umetnosti, Classi IV: Historia naturalis, 33. Ljubljana, Slovakia, pp. 179.
Husson, F. Josse, J., Le, S., Mazet, J., 2019. “Package ‘FactoMineR’.” Package FactorMineR (2019).
Jorissen, F., Nardelli, M.P., Almogi-Labin, A., Barras, C., Bergamin, L., Bicchi, E., El Kateb, A., Ferraro, L., McGann, M., Morigi, C., Romano, E., Sabbatini, Schweizer, M., Spezzaferri, S., 2018. Developing Foram-AMBI for biomonitoring in the Mediterranean: Species assignments to ecological categories. Mar. Micropaleontol. 140, 33–45.
Kassambara, A., Mundt., F., 2017. “Package ‘factoextra’.” Extract and visualize the results of multivariate data analyses, 76.
Kharroubi, A., Gargouri, D., Baati, H., Azri, C., 2012a. Assessment of sediment quality in the Mediterranean Sea-Boughrara lagoon exchange areas (southeastern Tunisia): GIS approach-based chemometric methods. Environ. Earth Sci. 184, 4001–4014. Kharroubi, A., Gzam, M., Jedoudi, Y., 2012b. Anthropogenic and natural effects on the
water and sediments qualities of costal lagoons: case of the Boughrara Lagoon (Southeast Tunisia). Environ. Earth Sci. 67, 1061–1067.
Langer, M.R., 1993. Epiphytic foraminifera. Mar. Micropaleontol. 20 (3–4), 235–265. Lakhan, V.C., Cabana, K., LaValle, P.D., 2003. Relationship between grain size and heavy
metals in sediments from beaches along the coast of Guyana. J. Coastal Res. 19, 600–608.
Le Danois, E., Ranson, G., du Baty, R.R., 1925. Recherches sur les fonds chalutables des côtes de Tunisie: croisière du chalutier “Tanche” en 1924. Office Scientfique et
Technique des Peches Maritimes, Mémoires, n. 3. Blondel La Rougery, Paris, pp. 56.
Loeblich, A.R., Tappan, H., 1994. Foraminifera of the Sahul Shelf and Timor Sea. Cushman Foundation for Foraminiferal Research Special Publication n.31, pp. 661. Martínez-Colón, M., Hallock, P., Green-Ruíz, C., 2009. Strategies for using shallow-water
foraminifera as bioindicators of potentially toxic elements: a review. J. Foramin. Res. 39 (4), 278–299.
Mateu-Vicens, G., Khokhlova, A., Sebastián-Pastor, T., 2014. Epiphytic foraminiferal in-dices as bioindicators in Mediterranean seagrass meadows. J. Foramin. Res. 44 (3), 325–339.
Melis, R., Celio, M., Bouchet, V.M., Varagona, G., Bazzaro, M., Crosera, M., Pugliese, N., 2019. Seasonal response of benthic foraminifera to anthropogenic pressure in two stations of the Gulf of Trieste (northern Adriatic Sea, Italy): the marine protected area of Miramare versus the Servola water sewage outfall. Mediterran. Mar. Sci. 20 (1), 120–141.
Messaoudi, I., Deli, T., Kessabi, K., Barhoumi, S., Kerkeni, A., Saïd, K., 2009. Association of spinal deformities with heavy metal bioaccumulation in natural populations of grass goby, Zosterisessor ophiocephalus Pallas, 1811 from the Gulf of Gabès (Tunisia). Environ. Monit. Assess. 156 (1–4), 551.
Milliman, J.D., 1994. Organic matter content in US Atlantic continental slope sediments: decoupling the grainsize factor. Deep Sea Research Part II: Topical Studies in Oceanography. 41(4 ± 6): 797–808.
Milker, Y., Schmiedl, G., 2012. A taxonomic guide to modern benthic shelf foraminifera of the western Mediterranean Sea. Palaeontol. Electronica 15 (2), 1–134.
Mkawar, S., Azri, C., Kamoun, F., Montacer, M., 2007. Impact sur les biophases marines des rejets anthropiques, notamment des métaux lourds rejetés sur le littoral nord de la ville de Sfax (Tunisie). Techniques Sciences Méthodes 10, 71–85.
Moore, J.R., Ramamoorthy, S.S., 1984. Heavy Metals in Natural Waters. Springer Verlag, New York.
Nixon, S.W., 1995. Coastal marine eutrophication: a definition, social causes, and future concerns. Ophelia 41 (1), 199–219.
Othmani, A., Béjaou, B., Chevalier, C., Elhmaidi, D., Devenon, J.-L., Aleyae, L., 2017. High-resolution numerical modelling of the barotropic tides in the Gulf of Gabes, eastern Mediterranean Sea (Tunisia). J. Afr. Earth Sci. 129, 224–232.
Parmar, T.K., Rawtani, D., Agrawal, Y.K., 2016. Bioindicators: the natural indicator of environmental pollution. Front. Life Sci. 9 (2), 110–118.
Pérez-Domingo, S., Castellanos, C., Junoy, J., 2008. The sandy beach macrofauna of Gulf of Gabes (Tunisia). Mar. Ecol. 29 (s1), 51–59.
Pergent, G., Gerakaris, V., Sghaier, Y.R., Zakhama-Sraier, R., Fernández Torquemada, Y., Pergent-Martini, C., 2016. Posidonia oceanica (errata version published in 2018). The IUCN Red List of Threatened Species 2016: e.T153534A135156882. Downloaded on 19 December 2018.
Pomar, L., Baceta, J.I., Hallock, P., Mateu-Vicens, G., Basso, D., 2017. Reef building and carbonate production modes in the west-central Tethys during the Cenozoic. Mar. Pet. Geol. 83, 261–304.
Rabaoui, L., Balti, R., Zrelli, R., Tlig-Zouari, S., 2014. Assessment of heavy metals pol-lution in the Gulf of Gabes (Tunisia) using four mollusk species. Mediterran. Mar. Sci. 15 (1), 45–58.
Core Team, R., 2018. R: A language and environment for statistical computing. R Foundation for Statistical Computing, Vienna, Austria.
Romero, J., Martínez-Crego, B., Alcoverro, T., Pérez, M.M., 2007. A multivariate index based on the seagrass Posidonia oceanica (POMI) to assess ecological status of coastal waters under the Water Framework Directive (WFD). Mar. Pollut. Bull. 55 (1–6), 196–204.
Sen Gupta, B.K., 2013. The roots of environmental micropalaeontology: early inquiries into modern foraminiferal distributions, in: Bowden, A.J., Gregory, F.J., Henderson, A.S. (Eds.), Landmarks in Foraminiferal Micropalaeontology: History and Development. The Micropalaeontological Society, Special Publications. Geological Society, London, pp. 181-191.
Schönfeld, J., Alve, E., Geslin, E., Jorissen, F., Korsun, S., Spezzaferri, S., Members of the FOBIMO group, 2012. The FOBIMO (FOraminiferal BIo-MOnitoring) initiative – Towards a standardised protocol for soft-bottom benthic foraminiferal monitoring studies. Mar. Micropaleontol. 94, 1–13.
Schorer, M., 1997. Pollutant and organic matter content in sediment particle size frac-tions.“ IAHS Publications Series of Proceedings and Reports of the International Association of Hydrological Sciences, 243, pp. 59–68.
Simboura, N., Zenetos, A., 2002. Benthic indicators to use in ecological quality classifi-cation of Mediterranean soft bottom marine ecosystems, including a newbiotic index. Mediterr. Mar. Sci. 3, 2, 77–111.
Shannon, C.E., Weaver, W., 1963. The Mathematical Theory of Communication. The University of Illinois Press, Illinois.
Troupin, C., Sirjacobs, D., Rixen, M., Brasseur, P., Brankart, J.M., Barth, A., Alvera-Azcárate, A., Capet, A., Ouberdous, M., Lenartz, F., Toussaint, M.E., Beckers, J.M., 2012. Generation of analysis and consistent error fields using the Data Interpolating Variational Analysis (Diva). Ocean Model. 52–53, 90–101.https://doi.org/10.1016/ j.ocemod.2012.05.002.
Tyson, R.V., 1995. Abundance of organic matter in sediments: TOC, hydrodynamic equivalence, dilution and flux effects. In: Tyson, R.V. (Ed.), Sedimentary organic matter. Springer, Dordrecht, pp. 81–118.
Wali, A., Colinet, G., Khadhraoui, M., Ksibi, M., 2013. Trace metals in surface soil con-taminated by release of phosphate industry in the surroundings of Sfax-Tunisia. Environ. Res. Eng. Manage. 3 (65), 20–30.
Wali, A., Colinet, G., Ksibi, M., 2014. Speciation of heavy metals by modified BCR se-quential extraction in soils contaminated by phosphogypsum in Sfax, Tunisia. Environ. Res. Eng. Manage. 4 (70), 14–26.
Wei, Taiyun, Simko, Viliam, Levy, Michael, Xie, Yihui, Jin, Yan, Zemla, Jeff, 2017. Package ‘corrplot’. Statistician 56, 316–324.
Zaouali, J., 1993. Les peuplements benthiques de la petite Syrte, golfe de Gabès-Tunisie. Résultats de la campagne de prospection du mois de juillet 1990. Marine Life, 3, 1–2, 47–60.