Adaptability of Manufacturing Operations through Digital Twins
byMaria Fernanda Reyes Castillo
Bachelor of Science, Industrial Engineering, Universidad Tecnológica Centroamericana, Honduras, 2013 and
Sachin Kumar Garg
Master of Business Administration, Indian Institute of Management, Lucknow, India, 2019 SUBMITTED TO THE PROGRAM IN SUPPLY CHAIN MANAGEMENT
IN PARTIAL FULFILLMENT OF THE REQUIREMENTS FOR THE DEGREE OF MASTER OF APPLIED SCIENCE IN SUPPLY CHAIN MANAGEMENT
AT THE
MASSACHUSETTS INSTITUTE OF TECHNOLOGY June 2021
© 2021 Maria Fernanda Reyes Castillo and Sachin Garg. All rights reserved.
The authors hereby grant to MIT permission to reproduce and to distribute publicly paper and electronic copies of this capstone document in whole or in part in any medium now known or hereafter created.
Signature of Author: _____________________________________________________________ Department of Supply Chain Management
May 14, 2021 Signature of Author: _____________________________________________________________
Department of Supply Chain Management May 14, 2021 Certified by: ____________________________________________________________________ Özden Tozanli Yilmaz Postdoctoral Associate Capstone Advisor Accepted by: ____________________________________________________________________ Prof. Yossi Sheffi Director, Center for Transportation and Logistics Elisha Gray II Professor of Engineering Systems Professor, Civil and Environmental Engineering
2
Adaptability of Manufacturing Operations through Digital Twins
byMaria Fernanda Reyes Castillo and
Sachin Kumar Garg
Submitted to the Program in Supply Chain Management on May 14, 2021 in Partial Fulfillment of the
Requirements for the Degree of Master of Applied Science in Supply Chain Management
ABSTRACT
Manufacturing companies are under pressure to build faster and more efficient decision-making capabilities due to the rapidly changing customer demand and expectations. The conventional analytical models are no longer sufficient to capture the complexities of the supply chain. Companies are looking to embark in a digital transformation to address these challenges. One of the digital technologies that offer manufacturers a way to navigate this journey is digital twins, a virtual replica of an object, process or system. Our project focused on studying how digital twins can react to a complex and dynamic environment to create an adaptive mechanism and how can digital twins add value to increase operational efficiency. To answer these questions, we created a conceptual framework of digital twin, AI model and developed a learning feedback loop between simulation and artificial intelligence algorithm. We modeled the supply chain network by using data from a beverage industry and created what-if scenarios that involved varying customer demand and lead time through discrete-event simulation. The output of the simulation was fed into the AI algorithm. The AI prediction was simulated again and results were analyzed. Our research provides insights and discover value associated with adopting these technologies for better decision making. Our recommendation from this study will help supply chain managers understand that a digital twin and AI model framework can be developed, and can be utilized to foresee patterns in supply chain, and proactively take actions to resolve any bottlenecks and constraints.
Capstone Advisor: Özden Tozanli Yilmaz Title: Postdoctoral Associate
3
ACKNOWLEDGEMENTS
We would like to thank our advisor, Özden Tozanli Yilmaz, for her constant guidance and support throughout this capstone project. Her experience, knowledge of digital supply chains, and a deep understanding of the capstone writing process has helped us shape our project.
We would like to thank the MIT Supply Chain Management program community for providing us an opportunity to apply our learnings.
To our cohort, thank you for the moral and emotional support.
Maria: I would like to thank my parents and siblings for believing in and supporting me. Thank you for your constant prayers throughout this experience. To all my family, thank you for your love and support. Sachin: I would like to thank my parents, my wife Ankita, and daughter Aria for their support and
4
TABLE OF CONTENTS
LIST OF FIGURES ... 5 LIST OF TABLES ... 6 1 INTRODUCTION ... 7 2 LITERATURE REVIEW ... 112.1 Complex Adaptive Systems (CAS) ... 11
2.1.1 Complex Adaptive Systems in Supply Chain Management ... 12
2.2 Concept of Digital Twins ... 15
2.2.1 Digital Transformation ... 15
2.2.2 Digital Twins ... 16
2.2.3 Digital Twins - Interaction & Collaboration ... 18
2.2.4 Digital Twin Technologies ... 19
2.2.5 Digital Twin Architecture ... 20
3 DATA & METHODOLOGY ... 23
3.1 Digital Twin Conceptual Model ... 24
3.2 A Complex Adaptive System (CAS) Conceptual Framework of the Beverage Industry ... 25
3.3 Research setting and Data ... 27
3.3.1 Process Flow ... 27
3.3.2 Data Selection and Preparation ... 28
3.3.3 Data Analysis ... 30
3.4 Simulation Modelling Approach ... 32
3.4.1 Supply Chain Network Description ... 33
3.4.2 Simulation Conceptual Model ... 36
3.4.3 Scenario and Experimental Design ... 38
3.5 Artificial Intelligence (AI) Model ... 41
3.6 Feedback loop ... 42 4 RESULTS... 43 4.1 Clustering Results ... 43 4.1.1 Correlation ... 43 4.1.2 Clustering ... 44 4.2 Simulation Results ... 46
4.2.1 Model Implementation, Verification and Validation ... 46
5
4.2.3 Peak Season Demand Increase and Customer Expected Leadtime ... 52
4.3 Gradient Boosting Results ... 53
4.3.1 Data Transformation ... 53
4.3.2 Walk-forward validation ... 53
4.3.3 XGBoost Results ... 53
4.4 Feedback Loop Results ... 59
4.5 Hypothesis Analysis ... 61
5 DISCUSSION AND MANAGERIAL RECOMMENDATIONS ... 62
5.1 Digital Twins ... 62
5.2 Artificial intelligence Model ... 63
5.3 Feedback Loop ... 64
6 CONCLUSION ... 66
6.1 Future Research ... 69
REFERENCES ... 71
LIST OF FIGURES
Figure 1: BeverageCo - Plants and Production lines per Country ... 8Figure 2: Conceptual model of CAS in supply chain management... 13
Figure 3: Digital Twin Conceptual Architecture ... 21
Figure 4: Methodology Overview ... 23
Figure 5: Digital Twin Conceptual Model ... 25
Figure 6: CAS Conceptual Framework for Manufacturing Operations ... 26
Figure 7: Process Flow Diagram ... 27
Figure 8: Key identified at different location levels ... 29
Figure 9: Simulation Modelling Process ... 33
Figure 10: BeverageCo Supply Chain Network ... 34
Figure 11: Simulation Conceptual Model ... 37
Figure 13: Scenario Overview ... 38
Figure 14: Evolution of XGBoost Algorithm from Decision Trees ... 41
Figure 15: Correlation results for the Brazil plant ... 43
Figure 15: Elbow method to identify number of clusters ... 45
Figure 17: Line Graph of XGBoost Forecasting Results for DC_AB... 54
Figure 18: Line Graph of XGBoost Forecasting Results for DC_CB ... 55
Figure 19: Line Graph of XGBoost Forecasting Results for DC_MC... 56
Figure 20: Line Graph of XGBoost Forecasting Results for DC_MG ... 57
Figure 21: Line Graph of XGBoost Forecasting Results for DC_ML ... 58
Figure 22: DC Demand (Shipment) for different scenarios ... 60
6
LIST OF TABLES
Table 1: Triangular Distribution for Customer Demand per DC ... 35
Table 2: Min-Max Policy Values per DC ... 36
Table 3: Experimental Design Matrix for the 22 factorial design on 𝐸𝐿𝑇 and 𝐷𝑓 ... 39
Table 4: Scenario 1: Experimental Design ... 40
Table 5: Scenario 2: Experimental Design ... 40
Table 6: Scenario 3: Experimental Design ... 40
Table 7: Scenario 4: Experimental Design ... 40
Table 8: Clustering Results ... 45
Table 9: Scenarios and Experimental Design Results DC_AB in Liters ... 47
Table 10: Scenarios and Experimental Design Results DC_CB in Liters ... 48
Table 11: Scenarios and Experimental Design Results DC_MC in Liters ... 49
Table 12: Scenarios and Experimental Design Results DC_ML in Liters ... 50
Table 13: Scenarios and Experimental Design Results DC _MG in Liters ... 51
Table 14: Number of Customers served per DC ... 52
Table 15: XGBoost Forecasting Metrics for DC_AB ... 54
Table 16: XGBoost Forecasting Metrics for DC_CB ... 55
Table 17: XGBoost Forecasting Metrics for DC_MC ... 56
Table 18: XGBoost Forecasting Metrics for DC_MG ... 57
7
1 INTRODUCTION
Manufacturing companies across the globe face challenges in reacting to rapidly changing customer demand and expectations while achieving efficiencies in their supply chains. Many companies today are extensively broadening their global network of suppliers, distribution centers, warehouses, and plants, which continuously interact with each other to satisfy customer needs in the most effective and efficient way. This ongoing transformation of global markets continually contributes to the expanding complexity in managerial and operational layers along supply chain networks.
However, conventional analytical models are no longer sufficient to capture all the interactions between different stakeholders of such complex supply chains (Long et al., 2011). To overcome this challenge, companies now are under pressure to build faster and more efficient decision-making capabilities in more customer-centric ecosystems. This problem is being faced by many industries including BeverageCo, the sponsor company. BeverageCo, is a multi-category beverage leader of the fast-moving consumer goods (FMCG) sector and is under pressure to build a more efficient and agile supply chain.
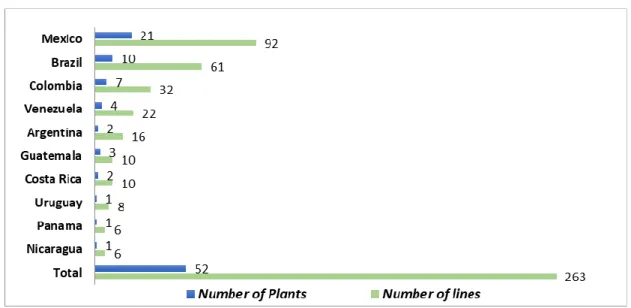
BeverageCo serves 290 million people across 10 countries in Latin America, through 52 plants, 263 production lines (see Figure 1) and 297 distribution centers. BeverageCo plants have a varying production capacity depending on their vicinity to customers and geography. The company has a very rich portfolio of products, ranging from low to no-sugar carbonated beverages, juices, purified water and energy drinks.
BeverageCo’s strategic framework is to transform its operating models through the deployment of world class supply chain solutions across its operations, enabled by digital processes, technology, and innovation. For this reason, the company is creating a sustainable competitive advantage, supported by leading edge strategic capabilities across its value chain.
8
Figure 1: BeverageCo - Plants and Production lines per Country BeverageCo - Plants and Production lines per Country
Although BeverageCo has started to transform its manufacturing and supply chain strategy, the company wants to explore digital technologies that can help them navigate through their digital transformation journey. Nevertheless, digital transformation is not just about introducing digital technologies such as big data, internet of things, artificial intelligence, and digital twins (DTs). It must consider evaluating the added value of these technologies to the operations of the business. One of the digital technologies that BeverageCo now is interested in exploring the added value are digital twins.
DTs are virtual replicas of physical objects, processes or systems (Purdy et al., 2020).DTs are considered to be living models of their physical representations (Liu et al., 2018). These models are updated with ubiquitous flow of data collected through a network of high-quality sensors such Internet-of-Things (IoT) devices. This capability helps DTs constantly adapt to the changes in the environment based on the interchange of information from the virtual model to the physical counterpart and vice-versa.
In terms of the supply chain (SC), a digital SC twin can be defined as “a model that can represent the network state for any given moment in time and allow for complete end-to-end SC visibility to improve
9
resilience and test contingency plans” (Ivanov et al., 2019). This model provides insights from the dynamics of the real-world systems that they emulate in a simulated environment.
This project evaluates a DT model for BeverageCo to examine the behavior of the company’s manufacturing and supply chain operations and understand its value-added. We aim to explore patterns of adaptability of the supply chain network by studying the plant and distribution center interactions to improve visibility and value sharing. The plant and distribution center interactions were studied by varying demand and expected customer lead-times.
The research questions of this project are:
1. How can digital twins react to the complex environment and create a dynamic adaptive mechanism in manufacturing operations along SCs?
2. How can digital twins help increase operational efficiency and value sharing in a supply chain setting?
To answer these research questions, this study investigated a data-driven learning system. This learning system was achieved by developing a feedback loop between a supply chain network simulation and an artificial intelligence model to predict the patterns of adaptability under four different scenarios by varying demand and customer expected lead-time values.
Customer demands and expectations, on the other hand, are the sources of complexity in the supply chain. To better understand the complex and adaptive dynamics of the supply chain under the changing circumstances, we studied a complex adaptive system (CAS) framework and reviewed the relevant literature. Focusing on this, CAS has the property of adaptation, meaning that it has the “ability to consciously alter its system configuration and influence its current and future survival” (McCarthy, 2003). Given these characteristics of adaptiveness and found in environments with many interactions, supply chain networks can be considered CAS (Pathak et al., 2007).
10
Inspired by the concept of CAS, allowed to perform a data analysis of the line, plant and country level components of BeverageCo’s manufacturing operations. The data analysis was made using a one-year scorecard data from BeverageCo’s enterprise resource planning (ERP) system. This analysis helped in understanding and conceptualizing BeverageCo’s supply chain digital twin.
The hypothesis of this project was that digital twins can be used to develop a feedback loop between simulation and AI resulting in a learning system to understand patterns for the adaptability of manufacturing operations and the whole supply chain. The simulation model was used to generate inventory levels per distribution center by varying demand and customer lead-time values. The inventory levels were used to train the AI model. The AI model learned the patterns of inventory levels at each distribution center and provided predictions of those inventory levels. This created a feedback loop between the simulation model and AI algorithm. The interactions between distribution centers to satisfy customer demand were observed providing useful information for better decision making.
Although the project makes recommendations for the value-added in implementing digital twins in this specific beverage company, the study provides a practical reference for future researchers and practitioners in examining the potential value of utilization of DTs in the FMCG industries by filling a gap in the literature. The conceptual framework and recommendations can be applied to similar interactions between individual components of a supply chain.
This document is organized in the following sections: An Introduction was provided in Section 1. Section 2 gives a comprehensive literature review on complex adaptive systems, digital twins, and artificial intelligence. Section 3 describes the project’s methodology. In Section 4, the results of simulation and AI are explained. Based on these findings, insights and managerial implications are presented in Section 5. Finally, Section 6 provides concluding remarks and recommendations and points to future research directions.
11
2 LITERATURE REVIEW
This chapter covers the literature review on Complex Adaptive Systems (CAS) and Digital Twins (DTs).
2.1 Complex Adaptive Systems (CAS)
A system is an integrated whole that consists of interconnected components (Merali & Allen, 2011). Throughout many years and inputs from different disciplines, the study of systems has become known as complex system theory, or some call it, complex theory, or complexity science (McCarthy, 2003). Complex systems theory models and provides understanding of the behavior of systems that possess: 1) a configuration made up of large number of elements 2) significant interactions among these elements and 3) organization in the system (McCarthy, 2003).
A special type of complex system is identified as a complex adaptive system (CAS). Holland (2006) defines CAS as a system that has many components, referred to as agents, that adapt or learn as they interact with each other. CAS exhibits four key characteristics:
1. Parallelism: Continuous and simultaneous signal emissions between large numbers of agents (Holland, 2006). The dynamic system is constantly exchanging information and energy with its environment (Nilsson & Darley, 2006).
2. Conditional Action: Action of the agents in CAS depend on the signals they receive (Holland, 2006). Agents act in correlation and interdependence according to certain policies that influence their behavior (Nilsson & Darley, 2006).
3. Emergence: Interactions among agents produce a collective behavior or pattern that the agents cannot create individually (Nilsson & Darley, 2006). The aggregate behavior of CAS emerges from the interactions of its components (agents). When seeking to adapt, they develop rules that anticipate the consequences of certain responses (Holland, 1992).
12
4. Adaptation and coevolution: Agents change as time goes by due to adaptations that improve performance, rather than due to random alterations (Nilsson & Darley, 2006). The ability to adapt and learn is the fundamental property of CAS (Holland, 1992).
Many difficult contemporary problems from various fields center on CAS; these include encouraging innovation in dynamic economies, preserving ecosystems, predicting changes in global trade, controlling the internet, strengthening the immune system, and understanding markets (Holland, 2006).
2.1.1 Complex Adaptive Systems in Supply Chain Management
In 2001, Thomas Choi first introduced the idea of treating supply networks as CAS. A CAS is a network composed of various interconnected entities (or agents) that display adaptive characteristics in response to changes in the interactions of agents and in the environment (Choi et al., 2001). In 2005, Amit Surana also explored the idea of supply networks from a CAS perspective. Surana et al. (2005) states: “The concept of CAS allows one to understand how supply networks as living systems co-evolve with the rugged and dynamic environment in which they exist and identify patterns that arise in such an evolution.” Pathak et al. (2007) identified four key elements of CAS in supply chains: 1) organizational entities exhibiting adaptivity, 2) a topology with interconnectivity between multiple supply chains, 3) self-organizing and emergent system performance, and 4) an external environment that coevolves with the system.
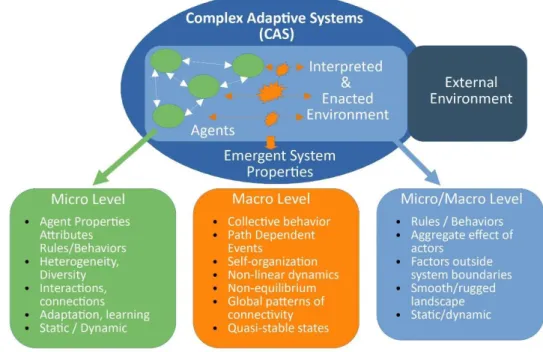
A conceptual framework (Figure 2) built by Nair & Reed-Tsochas (2019) considers the CAS perspective in the operations and supply chain management research.
13
Figure 2: Conceptual model of CAS in supply chain management
Conceptual model of CAS in supply chain management (adapted from Nair & Reed-Tsochas, 2019)
According to Figure 2, Nair and Reed-Tsochas (2019) established properties found in the micro and macro levels of the system, pointing out that agents are in the micro-level and emergent system properties that result from agent interactions with the environment are found in the macro level. However, they divided the environment into two levels: the “interpreted and enacted environment,” which directly interacts with the agents, and the “external environment,” which does not directly affect the agents. They describe this boundary between “interpreted and enacted environment” and “external environment” as not being static but dynamic since agents may interact with factors in the external environment at different moments in time. Therefore, the environment can possess properties from either the micro or macro level.
Companies have started to look for new ways of achieving competitive advantage, different than cost, quality and time (Giannoccaro, 2015). Adaptation has become a key element for companies to maintain competitive advantage (Reeves & Deimler, 2011). As mentioned previously, the CAS perspective is
14
relatively new in the supply chain management domain. Some researchers have begun to investigate and apply this perspective to solve complex supply chain problems.
The relationship between learning and adaptation in supply chains located within industrial districts was studied by Giannoccaro (2015), with the objective of identifying the best adaptive supply chain. The author followed a complexity science approach, in which firms accomplish learning processes developing new knowledge to changes in its environment. The tool used in Giannoccaro’s (2015) study is NK modeling. In the NK fitness model, the firm consists in a set of N interaction decisions on how to perform specific actions. The configuration of the firm displays the specific set of options on the decisions made by the firm and is modeled by the vector 𝑑 = (𝑑1 , 𝑑2… 𝑑𝑁) where the decisions are usually assumed to be binary. All the possible configurations the firm can adopt are then 2𝑁 fitness value (payoff) is related with each configuration and the firm is optimized to find the best configuration (highest payoff) (Giannoccaro, 2015). The study addressed the design of adaptive supply chains by analyzing physical features (e.g., the number of firms) and organizational features (vertical integration) that lead to adaptation. In contrast, our research analyzes behaviors of plant and DC nodes by studying their reactions under different scenarios (e.g., demand variability and lead-time) to improve value sharing in the whole SC of a beverage industry.
A study by Zhao et al. ( 2019) focused on investigating a firm’s adaptive strategies against disruptions in a supply chain network. They analyzed the effects of the supply chain network where in the face of a disruptions, the firms’ interconnected parts of the network have the ability to adapt and restructure their connections. Their study identified the structural complex properties of the network (supplier-customer and competitor) and used agent-based simulation models in order to understand if the firm’s adaptive behaviors can reduce the impact of disruptions. Several simulation runs were executed, and the model followed two steps: 1) An initial disruption by removing a supplier node, and 2) After the removal of a supplier node, each customer of this node tried to find alternative suppliers (Zhao et al., 2019). Zhao’s
15
study examined the adaptive behaviors of the supplier and customer in a supply chain network by using agent-based modeling.
Inspired by the concept of CAS, this project models the BeverageCo’s supply chain network. CAS theory helped us analyze the supply chain from a top-down and bottom-up perspective. It allowed for better understanding of the interactions happening at the line level, plant level and country level.
2.2 Concept of Digital Twins
In this section, an overview of Digital Transformation is presented with a focus on the studies in the field of Digital Twins. These studies concentrate on optimizing operations and achieving efficiencies through digital twins. The previously published work on various digital technologies is also explored in this section. Finally, a review on the conceptual architecture of digital twins is provided.
2.2.1 Digital Transformation
Digital transformation is the process of using digital technologies to transform existing and non-digital business processes or services, or creating new ones, to meet evolving market conditions and customer expectations. Digital transformation today is altering the way businesses operated traditionally and has become crucial for all companies from small firms to large-scale enterprises. Many companies have started a major transformational change by substantially integrating digital technologies into their businesses (Hess et al., 2016). Digital technologies make it possible to accelerate experimentation with business models, providing new opportunities (Massa & Tucci, 2013). Crittenden & Peterson (2019) define digital transformation as a new way of doing business, whereas, for Caro and Sadr(2019), it is the adoption of state-of-the-art concepts such as Industry 4.0, smart factory, or digital twins.
However, digital transformation is not about technology, it is about the value addition to the enterprise. This value addition can only be achieved by implementing technologies that can strategically fit in
16
company’s vision. Hence, the first step in starting a digital transformation journey is to have a strategic framework in place, taking into account short and long-term goals of the company (Kane et al., 2015). This strategic framework should consider existing capabilities, target state, and the gap between current state and target state (Ustundag & Cevikcan, 2018).
A winning digital transformation strategy should strive to provide a coherent plan of action and a guiding policy to reach from current to target state. However, digital transformation is not a static process; it is an iterative discovery-driven process, as the approach needs to be revised based on tests and experiments with different prototypes and solutions (Blank, 2007).
As a starting point towards digital transformation journey, companies should build an initial hypothesis identifying technologies incorporated in this transformation. These technologies may not always provide the expected business value, and may require a replacement by another technology, or a change in implementation methodology. For instance, an advanced autonomous robot may not provide the expected business value to a manufacturing company.
Following the best practices for Digital Transformation strategies, specifically on digital twin and artificial intelligence, found in the literature, the goal of this project is to develop a conceptual model of digital twin and artificial intelligence, and evaluate if this model can add value to BeverageCo.
2.2.2 Digital Twins
In 2003, the University of Michigan Executive Course on Product Lifecycle Management (PLM) publicly introduced the concept of digital twins (DT) as a virtual, digital equivalent of physical object with data flow from physical space to virtual space, and Information and insights shared by virtual space to physical space (Grieves, 2015). National Aeronautics and Space Administration (NASA) came up with a more specific definition of DT (Glaessgen & Stargel, 2012) “an integrated multiphysics, multiscale, probabilistic simulation of an as-built vehicle or system that uses the best available physical models, sensor updates,
17
fleet history, etc., to mirror the life of its corresponding flying twin.” The idea has since then, gain importance from both academicians and industry practitioners.
DTs are not just the mirrors of the static physical objects, processes, or systems but also dynamic simulations of these physical assets (Qi et al., 2018). This dynamic capability allows virtual simulation models to understand, predict, learn, and improve performance by guiding physical systems in responding to changes in their environment (Fei Tao et al., 2017).
Internet of Things (IoT) here is one of the major drivers behind connectivity and adaptability of DT. IoT devices such as high-quality sensors and microprocessors enable real-time data collection through devices connected to physical assets. DT is capable of collecting data through networked IoT sensors from a physical system to the digital twin, and continuously update its model in real-time. Since, the interaction is bi-directional, a physical system can use the knowledge acquired from one or more digital twins to improve its performance (Madni et al., 2019).
Performance and learning capacity of the digital twins can be enhanced by connecting them to the digital thread. According to D’Amico et al. (2019), the stream of data circulating underneath the digital world is called the digital thread, which keeps the real and virtual world synchronized. The digital thread allows a connected network of data flow and integrated view of products or systems throughout their lifecycle, creating a universal access to data. When connected to the digital thread, DTs can create their own network of feedback loop and become more powerful as they feed each other with a strand of their historical and real-time data. Such network of DTs delivers a number of value-adding outcomes such as real-time monitoring of systems, optimized asset maintenance, faults detection and risk mitigation, and reduced unplanned downtimes.
DT can use simulation models to explore physical system behavior under various what-if scenarios to optimize a physical system. In a DT model of a physical supply chain, simulations can be run to understand
18
the behavior of a logistics network over time, and any descriptive statistics of the working of supply chain can be collected. For example, which manufacturing plants can be used in case of a sudden increase in customer demand. Such rules can be combined and tested against any disruption events from machine shutdown to natural disasters to understand supply chain reaction in different scenarios. Adaptive DTs can learn from the predictions captured using technologies such as Artificial intelligence (AI) and machine learning (ML). AI and ML will be further discussed in the Section 2.2.4, “Digital Twin Technologies”.
The main sources of data that a DT can use are historical data, sensor data, user inputs, data from a network of digital twins, and simulation data. AI model can be implemented to obtain patterns in this data and generate insights such as the impact of a sudden decrease or increase in demand on manufacturing plants or to understand the implications of a new environmental policy on production. The output can then be fed back into physical system, creating a feedback loop to obtain operational and supply chain efficiencies.
A DT reference model was presented by Bevilacqua et al. (2020) in order to define conceptual guidelines for the implementation of DT for risk prediction and prevention. For example, DT models can increase the accuracy of machine anomaly detection and increase machine life. As another example by Madini et al. (2019), DT can be used to combine data from physical systems and IoT devices to optimize manufacturing processes, for example, to improve logistics support.
2.2.3 Digital Twins - Interaction & Collaboration
According to Tao et al. (2019), digital twins must interact and collaborate with each other to tackle complex problems. Digital thread enables this interaction by providing the ability to access, integrate, analyze, and transform data from multiple DTs. Through this interaction and collaboration, multiple DTs can be optimized through the synchronization between themselves, and with their physical counterparts. Focusing on this, physical twins can be dynamically adjusted based on direct orders from the digital model.
19
At present, only a few authors have explored interaction and collaboration between DTs. Vachálek et al. (2017) argue that DTs allow physical systems to respond more quickly to unexpected events based on constant interaction between the physical and digital systems. According to Rosen et al. (2015) , a digital space can capture all available data such as system sensor data, data from IoT devices, among others, from a physical space over a digital thread.
2.2.4 Digital Twin Technologies
DT encompasses a wide array of digital technologies and work in conjunction with various such technologies.
Following sections present the use of Digital Twins with simulation, Industrial internet of Things (IIoT), artificial intelligence (AI), and machine learning (ML).
2.2.4.1 Digital Twin and Simulation
Simulations can be used to run what-if scenarios in the virtual environment and predict physical system behavior in the real world. Weyer et al. (2016) suggested that DT simulations could help monitor and optimize complex manufacturing systems. According to D’Amico et al. (2019), a virtual twin which represents attributes of a physical system can be combined with environmental attributes such as data from other assets or external information which does not exist in physical system. Environmental data is a major difference between physical and virtual systems. It is possible to enable simulation of what-if scenarios where output can be predicted by combining data from the physical system, environmental data, and user inputs.
2.2.4.2 Digital Twin and Industrial Internet of Things (IIoT)
Tozanlı et al., 2020 suggested that IIoT devices can be considered as one of the primary enablers of the digital twin technology. According to Boyes et al. (2018) , industrial IoT (IIoT) is a system of devices
20
connected by communication software to monitor, collect, exchange, and analyze information to change their behavior or of their manufacturing environment. IIoT devices provide real-time data from multiple sources to digital twins, increasing the use and applicability of DT. According to Fuller et al. (2020), the growth of digital twins in the manufacturing industry is possible because of a similar growth of IIoT devices. On the other hand, it should be also noted that DTs are not part of IIoT technology. Utilizing IIoT devices facilitates ubiquitous real-time data to DTs and enhances their capabilities.
2.2.4.3 Digital Twin and Artificial Intelligence (AI)
Artificial intelligence (AI) refers to the ability of a computer or machine to mimic the capabilities of human mind. Artificial Intelligence encompasses several techniques. These techniques have the property that they can predict or prescribe efficiently and intelligently without being explicitly instructed (Cagle, 2019). Machine learning is a technique from Artificial Intelligence practices. Machine Learning (ML) algorithms learn from past data and improve themselves recursively to better identify patterns and predict (Cagle, 2019).
2.2.5 Digital Twin Architecture
This section presents an architecture of digital twin showing the information flow between a physical system, simulation, and an AI model through IoT devices, and transferring the information back to physical system. Combining inputs from Grieves (2015), Tao et al. (2019), Bevilacqua et al. (2020), and Canedo (2016), Parrott and Warshaw (2017) constructed a digital twin architecture with the following feedback loop: Concept, Communicate, Analyze, and Improve. The digital twin architectural diagram depicted in Figure 3 is an adopted version constructed for this study to provide the readers with an understanding of information flow within a digital twin.
21 Figure 3: Digital Twin Conceptual Architecture
Digital Twin Conceptual Architecture (adopted from Parrott & Warshaw (2017))
In this regard, the four keystones of the digital twin architecture demonstrated in Figure 3 are elaborated in the following sections.
2.2.5.1 Concept
Initial design is envisioned at this stage, and implemented by creating a replica of physical object, process, and system. The concept stage encompasses replicating physical processes and objects to digital systems with the use of enterprise resource planning systems, supply chain systems, CAD models, and IIoT devices. For example, several IIoT devices can be used to capture real-time data such as performance data, external data affecting operations, from physical objects; physical assets can be represented by 3D model using CAD.
2.2.5.2 Communicate
The communicate step provides the seamless, bi-directional, real-time connectivity between the digital twin and physical system. Several communication interfaces are necessary to transfer information from physical systems, for example, through IIoT devices to the digital twin. Finally, the data gathered is aggregated to ingest into a data repository, and then processed and prepared for analytics.
22 2.2.5.3 Analyze
In the analyze step, data is analyzed and visualized to obtain insights from data. Data analysis involves data collection, cleaning, transforming, modeling, and interpreting data to discover insights and guide decision-making. Data analysts can use advanced technologies such as artificial intelligence to develop models to provide recommendations to business.
2.2.5.5 Improve
In the improve step, actionable insights from the analyze step can be fed back to physical system. These insights can be used to recommend preventive measures, and to reduce maintenance costs in plants. This connection between digital twin and physical system completes the feedback loop between the two systems.
With a focus on the beverage industry, this project investigates the utilization of DTs to examine the adaptability of manufacturing and supply chain operations in complex and dynamic ecosystems. This study aims to fill a gap in the literature by analyzing the value-added of using DTs by creating a data-driven learning system with the utilization of simulation and artificial intelligence.
23
3 DATA & METHODOLOGY
This section outlines the methods and tools used to answer research questions discussed in the previous section.
This study examined a data-driven learning system to analyze complex and adaptive dynamics of the utilization of digital twins in manufacturing operations along the supply chain of a beverage manufacturer. To understand and run what-if scenarios, a feedback loop between simulation and AI to foresee the patterns for the adaptability of supply chain agents (plants and distribution centers) and within the whole supply chain (SC) settings was created. The project analyzed how different supply chain players such as manufacturing plants and distribution centers interact in a supply chain network, and respond to the dynamic environment both internally and externally to create an autonomy in decision-making processes to achieve operational efficiency and value sharing.
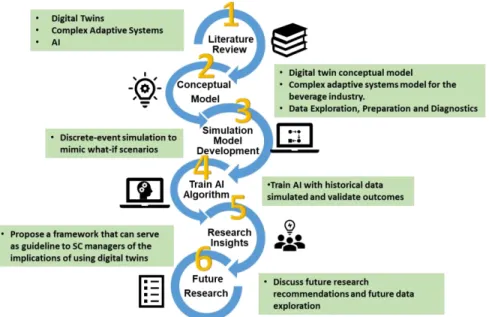
This project was conducted in six phases, as depicted in Figure 4. Figure 4: Methodology Overview
24
In this regard, Phase 1 was detailed in Section 2, ‘Literature review’. Phases 2, 3, and 4 are explained in this section. Phase 5 and Phase 6 will be further elaborated in Section 5, ‘Discussion and management insights’ and Section 6, ‘Conclusion’, respectively.
First, a conceptual model (Phase 2) of a digital twin mechanism in the beverage industry was developed. This model represents a replica of the physical supply chain of BeverageCo. Then, a discrete-event simulation model was created and implemented to mimic various real-world situations (Phase 3). The simulation output was then used to train an AI model (Phase 4). Finally, a feedback loop was established between the simulation and AI model to share AI predictions with simulation model. These predictions can be reviewed and analyzed by BeverageCo supply chain users, and can be fed back to the physical supply chain completing the closed connection between physical supply chain, digital twin and AI model. The following sections discuss digital twin conceptual model and complex adaptive systems. Subsequently, our methodology for data preparation, simulation and AI model design, and for feedback loop creation is provided.
3.1 Digital Twin Conceptual Model
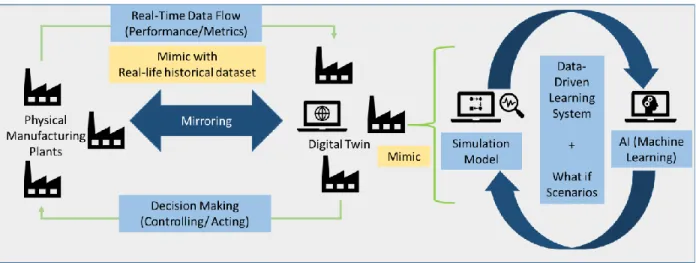
Our digital twin conceptual model for the beverage industry is adapted from Modoni et al. (2019) as shown in Figure 5. According to Figure 5, a continuous mirroring between the physical manufacturing plants and its digital twin is realized by means of two data flows. The first one (from left to right) denotes the real-time data flow and includes performance metrics from the real physical manufacturing plants to the digital twin. The second flow (from right to left) represents the actions performed based on the feedback from the digital twin to the physical manufacturing plants. These actions are the decisions that managers can make with the use of digital twins.
We enhanced this digital twin conceptual model developed by Modoni et al. (2019) by adding the concept of the data-driven learning system. Focusing on this, the learning system addresses the utilization of AI
25
and simulation to provide supply chain managers opportunities to understand the impact of AI predictions on supply chain behavior of BeverageCo. DTs can be made more intelligent and can be used to prescribe actions in the physical world using the data obtained from AI algorithms. AI-driven predictions can enrich the capabilities of DT by recommending optimized future actions to users.
Figure 5: Digital Twin Conceptual Model
Digital Twin Conceptual Model (adopted from Modoni et al. (2019))
Although the conceptual model presented in Figure 5 is how it will look if digital twins are implemented in real life, this capstone does not focus on creating a real-time digital twin where data is transferred through IoT sensors. This research offers a conceptual view of digital twins based on a real-life historical dataset from BeverageCo. The digital twin created in this study consisted of historical data, simulation, an AI model, and a feedback loop between AI and simulation model.
3.2 A Complex Adaptive System (CAS) Conceptual Framework of the Beverage
Industry
The conceptual framework was built using Nair & Reed-Tsochas (2019)’s consideration of the CAS perspective in operations and supply chain management research. Inspired by the CAS theory, in Figure 6 a conceptual framework is created to analyze the manufacturing and supply chain network of BeverageCo.
26
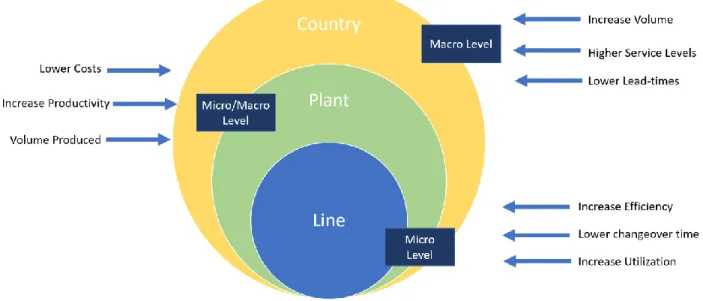
Figure 6: CAS Conceptual Framework for Manufacturing Operations CAS Conceptual Framework in Manufacturing Operations
According to the figure, the line level is the macro level in which the operation aims to increase efficiency, lower changeover times and increase utilization. Each production line has its own configuration and performance in order to achieve the targets for efficiency, changeover times and utilization. The interaction between production lines creates the micro/macro level which is the plant level. At this level, the operation is looking to lower costs, increase productivity and secure production volumes. The interaction between different production plants creates the macro level which is the country level. The operation at this level is looking to increase volume, increase service levels and reduce lead-times to satisfy customer demands and expectations.
In this project the focus of the scenarios created during simulation was at the country level. The four scenarios were created by varying customer demand and expected customer lead-times values, and the interaction between manufacturing plants, distribution centers and customers were observed.
27
3.3 Research setting and Data
3.3.1 Process Flow
The following section explains the execution process flow. This section starts by providing a high-level process flow to the reader. Each of the steps and sub-steps are explained in following sections in detail and can be visualized in Figure 7.
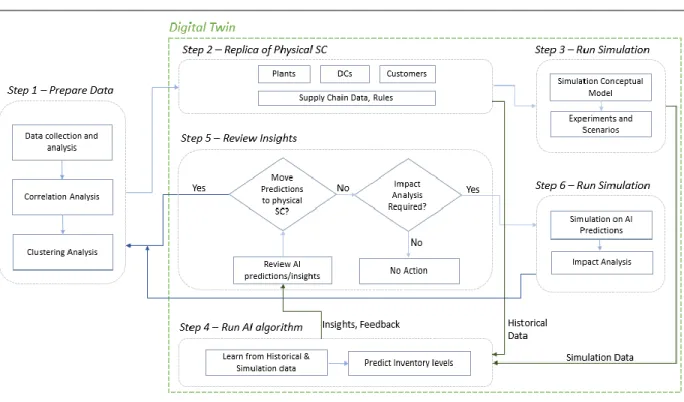
Figure 7: Process Flow Diagram Process Flow Diagram
Step 1: Execution starts with data preparation including data collection and analysis, followed by correlation and clustering analysis. The output of Step 1 is the ‘data’ required for the creation of conceptual model of digital twin.
28
Step 2: In this step, we create a digital twin to replicate physical supply chain of BeverageCo. Digital twin consists of manufacturing plants, distribution centers, customers, and supply chain rules or parameters of physical supply chain of BeverageCo.
Step 3: Several experiments and scenarios are run in this step. We run multiple experiments by increasing demand, changing lead times to generate inventory levels for different scenarios. The data from simulation is shared with AI model.
Step 4: AI model accepts historical data directly from digital twin and simulation data from simulation model. AI algorithm learns from historical and simulation data, and share insights/predictions with digital twin. This transaction completes the feedback loop between digital twin and AI model.
Step 5: Supply chain managers can review the predictions shared by AI model in this step. Various data interpretation and visualizations techniques can be used to review insights shared by AI model. SC managers can decide to fed predictions to physical supply chain or perform an impact analysis to understand the impact of these predictions on BeverageCo supply chain.
Step 6: SC managers can perform an impact analysis in this step to understand the supply chains reaction to AI predictions. Various what-if scenarios can be run on AI predictions and historical data obtained from the physical supply chain. Depending on the results of these scenarios, SC managers can manipulate the physical supply chain with AI predictions. There is an opportunity to alter AI predictions and share refined numbers with physical supply chain as well. These modifications may be necessary to include market intelligence and real-world knowledge of SC managers.
3.3.2 Data Selection and Preparation
Data was obtained from BeverageCo’s enterprise resource planning (ERP) system and was collected for all the countries where the company operates. Among these countries, data from Brazil was found to be
29
the most comprehensive and sufficient for this study. Brazil has second highest number of plants and distribution centers (DCs) providing enough data for the study and at the same time, reducing complexity which might incur if data from Mexico, country with highest number of plants is used. Further, Mexico data is incomplete, and data for all plants is not available in the ERP system. Hence, Brazil data was selected for the study and to build the digital twin model. Brazil operations consist of 10 manufacturing plants with 61 production lines, and 5 distribution centers.
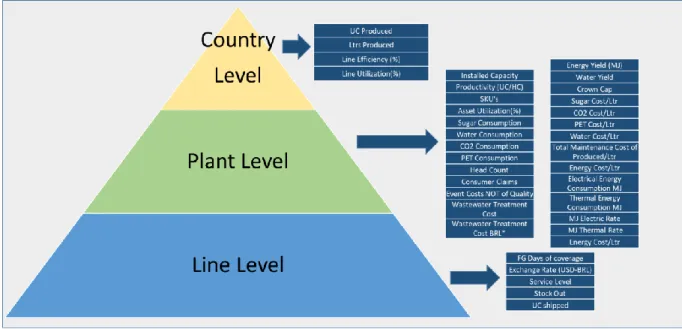
Historical data consists of monthly data available from Jan 2018 to Mar 2019, including quantitative information of manufacturing plants. Based on data availability, relevant data variables were identified for the plant and distribution center selection. Data was examined at three different levels – Production Line, Plant, and Country level. Figure 8 depicts the significant variables identified for manufacturing at these three levels.
Since majority of the variables including costs and yield values were available at the ‘Plant’ level, the plant level data was selected for further data analysis.
Figure 8: Key identified at different location levels Key variables identified at different location levels
30
3.3.3 Data Analysis
For preliminary data analysis, we first analyzed the correlation between variables and performed a clustering analysis. Correlation results were shared as an input to identify right variables for clustering. Clustering findings were used to select plants for digital twin and AI model. To increase the testing efficiency, in the data selection process, the focus was to identify the plants and distribution centers most relevant for developing the digital twin model. To overcome this limitation of number of plants and DCs, we used the results from the clustering analysis to select manufacturing plants and DCs for the analysis.
3.3.3.1 Correlation Analysis
Correlation is a statistical measure that indicates the degree to which two variables fluctuate in relation to one another. In this study, the main objective of correlation analysis was to identify suitable variables for clustering. The output of correlation analysis was used to limit the variables required for the clustering analysis. For example, it was evident from the data that liters produced and the installed capacity have a very high correlation; hence, both these variables were not required for clustering analysis. A positive correlation indicates the extent to which two variables are associated with a positive relationship, i.e., the variables increase or decrease in parallel, while a negative correlation is when two variables are associated with a negative relationship, i.e., increase in one variable decrease other.
3.3.3.2 Clustering Analysis
Clustering is a technique of unsupervised learning. It is not necessary to provide a priori an example or label of the clusters, but the algorithm creates the groups based only on the set of data. It is a common method for statistical data analysis used to discover similarities between the data items and group them according to these common characteristics into several categories, known as clusters. It is also used to discover patterns (Milligan & Cooper, 1985).
31
In this study, clustering analysis was used to cluster 10 manufacturing plants of Brazil into smaller groups with similar characteristics. Plants within resultant clusters or group of plants are more similar to each other than to the rest of the plants based on certain identified parameters.
Clustering analysis involves two important identifications – identify appropriate numbers of clusters and identify the variables to discriminate between groups. The elbow method was used to find the number of possible groups with similar patterns and k-means was used to help identify the variables that allow discrimination between groups.
Elbow method
In cluster analysis, the elbow method is a heuristic used in determining the number of clusters in a data set. The method consists of plotting the explained variation as a function of the number of the clusters, and picking the elbow of the number of clusters to use. The relationship is graphed between the number of clusters and within cluster sum of squares (WCSS) and then the number of clusters is selected where the change in WCSS begins to level off (Syakur et al., 2018).
K-means clustering
The k-means clustering is a partitional algorithm. The goal of using this algorithm in our analysis was to group the data items in a way that the items with similarities are in one group. K-means clustering is one of the most used algorithms in research. The algorithm consists of following steps:
a. Identify number of clusters using Elbow method explained in ‘Elbow method’ section. Cluster-sum-of-squares is used as a measure to find the optimum number of clusters. Within-Cluster-sum-of-squares is defined as the sum of the squared distance between each member of the cluster and its centroid.
𝑊𝐶𝑆𝑆 = ∑(𝑥𝑖− 𝑐𝑖)2 𝑛
32 where,
𝑥𝑖 = data point
𝑐𝑖 = closest point to centroid
The WCSS is measured for each value of k. The value of k, that which has the least amount of WCSS is considered optimum.
b. Choose K random data items representing k clusters to initiate the algorithm. These k data points will be the cluster centers called centroids.
c. Assign each data item (𝑥𝑖) to the closest cluster by minimizing following objective function:
𝐽𝐾𝑀 = ∑ ∑ 𝑤𝑖𝑗(‖𝑥𝑖− 𝑐𝑗‖) 2 𝑛 𝑖=1 𝑘 𝑗=1 where, 𝑘 = number of clusters
𝑛 = the amount of data items in the data set 𝑤𝑖𝑗= { 1 𝑖𝑓 𝑐𝑗 𝑖𝑠 𝑡ℎ𝑒 𝑐𝑒𝑛𝑡𝑟𝑜𝑖𝑑 𝑐𝑙𝑜𝑠𝑒𝑠𝑡 𝑡𝑜 𝑥𝑖
0 𝑜𝑡ℎ𝑒𝑟𝑤𝑖𝑠𝑒
‖𝑥𝑖− 𝑐𝑗‖ = the Euclidean distance between each data item 𝑥𝑖 and the centroid 𝑐𝑗 d. Identify new centroids by taking the average of the assigned points
e. Keep repeating step c and step d until convergence is achieved
The results of clustering analysis provided us with the final list of plants and DCs used in the digital twin model.
3.4 Simulation Modelling Approach
The steps in our simulation modelling are demonstrated in Figure 9. The modelling process is comprised of two stages: the development stage and the experimental stage.
33 Figure 9: Simulation Modelling Process
Simulation Modelling Process
The following sections elaborates on the stages of the simulation modeling in further detail.
3.4.1 Supply Chain Network Description
The BeverageCo supply chain network used for the purpose of this study consisted of 10 manufacturing plants from Brazil operations. As explained in the Section 4, Results , five manufacturing plants from Cluster 1 (see Section 4.1.2, Clustering results, Table 8) were selected to be modeled in the simulation together with five distribution centers and ninety-nine customers. All customers designated to be fulfilled from the selected plants are included in the study.
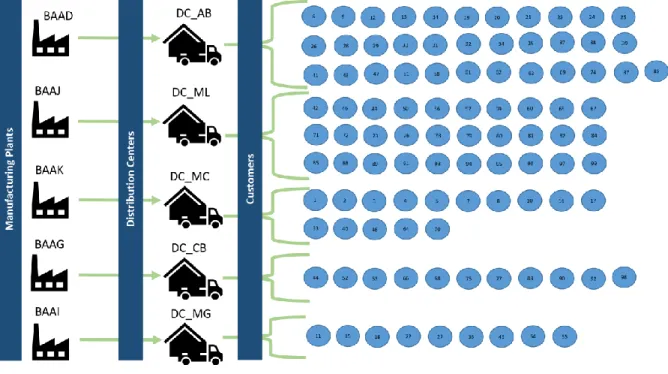
In the existing supply chain network, each manufacturing plant serves to one distribution center, and a distribution center serves a group of customers based on the nearest distance proximity (see Figure 10). The manufacturing plants locate in Jundiaí, Maringa, Marilia, Itabirito, and Curitiba, which are identified as BAAD, BAAJ, BAAK, BAAG and BAAI in Figure 10, respectively. Similarly, the distribution centers are
34
placed in Assis Brasil, Marilia, Macro, Curitiba, and Maringa and referenced as DC_AB, DC_ML, DC_MC, DC_CB, and DC_MG, respectively. The customers are numbered from 1 to 99, and shown in blue circles. Figure 10: BeverageCo Supply Chain Network
BeverageCo Supply Chain Network
In the ERP system, all the data required to build the model was not present; hence, we structured certain assumptions on customer demand, lead time, and inventory policy to be considered in the simulation model. These assumptions are explained below.
Customer Demand:
Customer demand is at the daily level and can be fulfilled by any DC. Demand was computed using the one-year shipment quantity data available in the ERP system. Triangular distribution was used as only limited shipment data for few plants and distribution centers was available.
Triangular distribution is a continuous, bounded probability distribution, which serves as a good way to express uncertainty by providing the minimum, maximum and most likely (mode) values. We developed
35
triangular distribution using min shipment quantity, max shipment quantity, and mean shipment quantity obtained from data. Triangular distribution was formulated as follows:
Triangular distribution (min, mode, max):
𝑀𝑖𝑛 = 𝑀𝑖𝑛 (𝑖) 𝑀𝑎𝑥 = 𝑀𝑎𝑥 (𝑖)
𝑀𝑜𝑑𝑒 = 3 ∗ 𝑀𝑒𝑎𝑛 (𝑖) − 𝑀𝑖𝑛 (𝑖) − 𝑀𝑎𝑥 (𝑖) where;
i ∈ shipment data.
Min, Max and Mode values, in liters for each distribution center are summarized as shown in Table 1. Table 1: Triangular Distribution
Triangular Distribution for Customer Demand per DC
Distribution Center Customers Min Max Mode
DC_AB 99,430 164,363 102,306 DC_ML 27,320 46,072 28,893 DC_MC 35,619 82,270 41,787 DC_CB 64,083 93,102 69,171 DC_MG 131,919 251,284 202,948 DC Inventory Policy:
DC inventory policy used is assumed as a “Min-Max” policy. The “Min-Max” policy also referred as (s,S) policy is an inventory policy where products are ordered when the inventory level falls below a fixed inventory level ‘Min’ (s). The ordered quantity is set to such a value that the resulting inventory quantity equals ‘Max’ (S). Same inventory policy was used for all the DCs and values are shown in Table 2. The units are in liters and were estimated based on the average inventory days of sales found in BeverageCo’s historical dataset. The inventory holding cost was also provided as input to simulation model, which was assumed to be $0.001 per day per liter.
36 Table 2: Min-Max Policy Values per DC
Min-Max Policy Values per DC in Liters
Distribution Center s S DC_AB 12,910,636 17,214,181 DC_ML 3,389,664 4,519,552 DC_MC 2,742,755 3,657,007 DC_CB 7,933,417 10,577,889 DC_MG 5,880,281 7,840,375
Customer expected lead time (ELT):
Customer expected lead time is the time an order should be fulfilled in. In BeverageCo’s data, the distribution center to customers lead time varied from 1 to 4 days.
SKU Selection:
All the SKU’s of beverage company have a similar product flow. The replenishment to DC always happens from the plant, and the DC distributes the supply to customers. However, in the ERP system, replenishment data is available for only few SKU’s. As a result, we selected only 1 SKU – ‘PET 2,0L’ for the analysis as this SKU was produced at all plant locations and shipped to all DCs and customers.
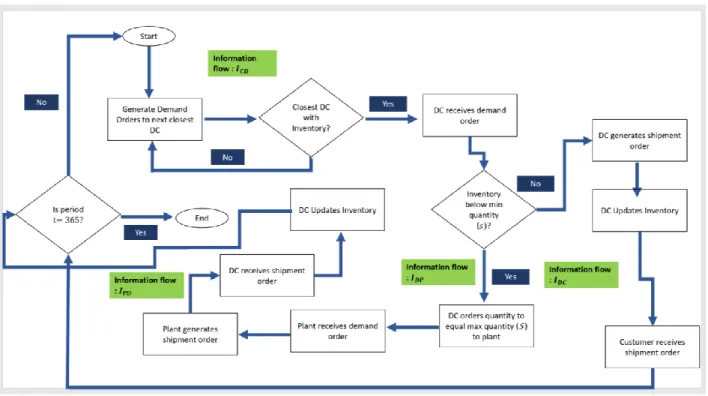
3.4.2 Simulation Conceptual Model
The conceptual model used for our study is shown in Figure 11. The notation used is the following: Notation
Indices for the supply chain entities: • 𝐶 = Customer
• 𝐷 = Distribution Center • 𝑃 = Manufacturing plant
• 𝐼𝐶𝐷 = Information flow from entity 𝐶 to entity 𝐷 • t = Time period in days
37
The simulation begins at period t = 1, and the information flows from customers to DCs. Customers generate demand orders to closest DC. If the closest DC does not have inventory to satisfy the order quantity, the customer will look for another closer DC to satisfy demand from. If there is inventory at DC to satisfy the order quantity, the DC receives the order and checks if inventory is below min quantity s.
If inventory is not below min quantity, DC generates shipment order, updated inventory and customer receives shipment order. If inventory at DC is below min quantity, it orders the quantity to reach target max quantity from manufacturing plant. Plants receive the demand order from DC, then generates the shipment order. The DC receives shipment order, then updates its inventory level.
The simulation starts from t = 1, and is repeated for each day till it ends when t = 365.
Figure 11: Simulation Conceptual Model Simulation Conceptual Model
38
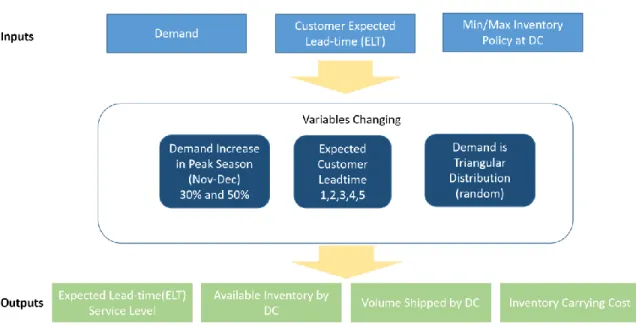
3.4.3 Scenario and Experimental Design
Using BeverageCo’s historical dataset of production volumes as guidance, it was analyzed that the peak season is during the months of November and December. The scenarios that were simulated had the objective of studying the effects of increasing the demand in November and December and adjusting the customer expected lead-time (ELT). ELT is the time-period within which the ordered product is expected to be received by the customer. The results of the simulation model will enable managers take actions and decisions to better serve their customers.
Figure 12 shows the input and outputs of this scenario.
Figure 12: Scenario Overview
Scenario Overview
A 2𝑘 factorial design was used to create four experiments, and to measure the effects of factors on the response with which interactions were measured. In experimental-design terminology, the input parameters and structural assumptions comprising a model are called factors, and output performance
39
measures are called responses (Law, 2013). Factors have two levels denoted with (−, +) signs and the 2𝑘 possible factor-level combinations, are called design points.
The 22 factorial design is shown in Table 3. The factors 𝑗1 and 𝑗2 are the expected customer lead-time (𝐸𝐿𝑇) and the demand factor (𝐷𝑓). The notation 𝑅𝑖 is the value of the response when running the simulation with the 𝑖th combination of factor levels. The response for our experiments was the average inventory level at DC. For example, 𝑅3 is the response resulting from running the simulation with factor (𝐸𝐿𝑇) at (−) level and factor (𝐷𝐹) at its (+) level.
Table 3: Experimental Design Matrix for the 22 factorial design on 𝐸𝐿𝑇 and 𝐷𝑓 Experimental Design Matrix for the 22 factorial design on 𝐸𝐿𝑇 and 𝐷𝑓
The main effect of each factor, denoted by 𝑒𝑗, is the average change in the response due to moving factor j from its (−) level to its (+) level. This average was taken over all combinations of the other factor levels in the design.
𝑒
1=
(𝑅
2− 𝑅
1) + (𝑅
4− 𝑅
3)
2
𝑒
2=
(−𝑅
2− 𝑅
1) + (𝑅
4+ 𝑅
3)
2
The signs of column 𝐸𝐿𝑇 𝑥 𝐷𝑓 in Table 3 were calculated by multiplying the 𝑖th sign in the factor (𝐸𝐿𝑇) column by the 𝑖th sign in factor 𝐷𝑓 column (the product of like signs is a (−) and the product of opposite signs is a (+)). This column gives the signs of the 𝑅𝑖 used to form the interaction effect
denoted by 𝑒
𝑗1𝑗2.
The measure of the interaction is the difference between the average effect of factor 𝑗1 when factor 𝑗2 is at its (+) level (and all other factors other than 𝑗1 and 𝑗2 are held constant) and the average effect of factor𝑗1 when factor 𝑗2 is at its (−) level.
Factor Combination (design point) 1 - - + 2 + - - 3 - + - 4 + + + 𝑗1 = 𝐸𝐿𝑇 𝐸𝐿𝑇 𝑥 𝐷𝑓 𝑅𝑖 𝑅1 𝑅2 𝑅3 𝑅4 𝑗2= 𝐷𝑓
40
𝑒
𝑗1𝑗2=
(𝑅
1− 𝑅
2) + (𝑅
4− 𝑅
3)
2
The matrix design of the four scenario and experiments conducted are presented in Table 4-7. Table 4: Scenario 1: Experimental Design
Scenario 1: Experimental Design
Expected customer lead-time varies from 1 to 2 days and demand increase factor varies from 1.3 to 1.5. Table 5: Scenario 2: Experimental Design
Scenario 2: Experimental Design
Expected customer lead-time varies from 2 to 3 days and demand increase factor varies 1.3 to 1.5. Table 6: Scenario 3: Experimental Design
Scenario 3: Experimental Design
Expected customer lead-time varies from 3 to 4 days and demand increase factor varies from 1.3 to 1.5. Table 7: Scenario 4: Experimental Design
Scenario 4: Experimental Design
Expected customer lead-time varies from 4 to 5 days and demand increase factor varies from 1.3 to 1.5.
Factor - + 1 2 1.3 1.5 𝐷𝑓 𝐸𝐿𝑇 Factor - + 2 3 1.3 1.5 𝐷𝑓 𝐸𝐿𝑇 Factor - + 3 4 1.3 1.5 𝐷𝑓 𝐸𝐿𝑇 Factor - + 4 5 1.3 1.5 𝐷𝑓 𝐸𝐿𝑇
41
3.5 Artificial Intelligence (AI) Model
An AI time-series algorithm was used to predict inventory levels at each DC from the output of the simulation experiments. There are many AI models that can be applied for time-series forecasting. A gradient boosting model was selected for this study. Gradient boosting is an ensemble artificial intelligence method that uses regression trees that are added sequentially. In each step, the new predictor is fit into the residual errors of the prior models. It can be used for both classification and regression predictive modeling.
Extreme Gradient Boosting (XGBoost) is an efficient, fast and effective open-source gradient boosting algorithm (Chen & Guestrin, 2016). The evolution and concepts of XGBoost from decision trees is shown in Figure 13. It uses parallel processing and tree-pruning. Because favorable prediction results have been obtained by using this model, since it avoids overfitting and bias, it is widely used in machine learning competitions. The XGBoost model performs excellently on the prediction of the sales volume, stock price, and traffic flow (Gumani et al., 2017; Wang & Guo, 2020; Lu et al., 2020).
Figure 13: Evolution of XGBoost Algorithm from Decision Trees Evolution of XGBoost Algorithm from Decision Trees
42
3.6 Feedback loop
In this step, a feedback loop was established between AI model and DT to improve decision-making. In real world, AI model share actionable insights with decision makers to predict behavior of physical system. However, in this study, the output of AI model was shared with digital twin. A simulation was then run to validate the output of AI model.
AI model was run to predict Inventory levels at each DC for a future period. Simulation model takes the predicted inventory levels as input, in addition to demand, lead time, inventory policy, which were other inputs to the model. Simulation model was run to validate if the predicted inventory levels are correct based on the future what-if scenario provided to model. For instance, simulation model can be run with demand coefficient (1.5), lead time (5), inventory policy (Min-Max), and inventory level predicted by AI model. In this scenario, if the AI model predictions are correct, DC’s will fulfill customer demand from available inventory without replenishing from plant, and expected service levels are close to 100%. This interaction completes the feedback loop connection between the AI model and digital twin.
43
4 RESULTS
This chapter presents data analysis, results from simulation, artificial intelligence model, and the feedback loop.
4.1 Clustering Results
4.1.1 Correlation
The main objective of correlation analysis was to identify suitable variables for clustering. Correlation analysis was executed through Python. Figure 14 is the heatmap result of the correlation analysis. Figure 14: Correlation results for the Brazil plant
44
The results of Figure 14 are interpreted as follows. A perfect positive correlation has a 1 value and a perfect negative correlation has a -1 value. No correlation represents a 0 value. For both positive and negative correlation, values between 0.5 and 0.99 are described as having high correlation, and values between 0.3 and 0.49 as moderate correlation. The values below 0.29 are considered of low correlation.
Correlation results show a high correlation between UC produced, Ltrs produced, SKUs and all the cost variables such as Energy cost/Ltr and Sugar cost/Ltr. Hence, out of all these variables, only Ltrs produced is selected for clustering analysis. Similarly, as water yield and energy yield have high correlation, only energy yield was selected. Both line efficiency (%) and line utilization (%) were selected for clustering analysis.
4.1.2 Clustering
The output of correlation analysis was used to limit the variables required for the clustering analysis. Clustering analysis was performed to group the 10 manufacturing plants of Brazil into smaller subgroups with similar characteristics. As described in methodology section, clustering analysis consists of two important steps which are identifying the numbers of clusters and identifying the variables to differentiate between groups.
Elbow method
Elbow method was used to identify number of groups, and k-means helped in identifying the variables. To determine the optimal number of clusters, the value of k at the “elbow” i.e. the point after which the distortion/inertia start decreasing in a linear fashion, was selected. Thus, according to elbow method (Figure 15), three is an appropriate number of clusters for this study.