HAL Id: hal-03079838
https://hal.archives-ouvertes.fr/hal-03079838
Preprint submitted on 17 Dec 2020
HAL is a multi-disciplinary open access
archive for the deposit and dissemination of
sci-entific research documents, whether they are
pub-lished or not. The documents may come from
L’archive ouverte pluridisciplinaire HAL, est
destinée au dépôt et à la diffusion de documents
scientifiques de niveau recherche, publiés ou non,
émanant des établissements d’enseignement et de
A methodology for CT based non-destructive
geometrical evaluations of lattice structures by holistic
strut measurement approach
Jitendra Singh Rathore, Chetra Mang, Caroline Vienne, Yann Quinsat,
Christophe Tournier
To cite this version:
Jitendra Singh Rathore, Chetra Mang, Caroline Vienne, Yann Quinsat, Christophe Tournier. A
methodology for CT based non-destructive geometrical evaluations of lattice structures by holistic
strut measurement approach. 2020. �hal-03079838�
A methodology for CT based non-destructive geometrical
evaluations of lattice structures by holistic strut
measurement approach
Jitendra Singh Rathorea,b,, Chetra Manga, Caroline Vienneb, Yann Quinsatc, Christophe Tourniera,c
aInstitut de Recherche Technologique SystemX, F-91120 Palaiseau, France bUniversité Paris-Saclay, CEA, List, F-91120, Palaiseau, France cUniversité Paris-Saclay, ENS Paris-Saclay, LURPA, F-91190 Gif-sur-Yvette, France
Abstract
The presence of lattice structures is increasing in the manufacturing domain espe-cially in the air/spacecraft and biomedical applications due to their advantages of high strength-to-weight ratios, energy absorption, acoustic and vibrational damping, etc. Dimensional accuracy of a lattice structure is one of the most important requirements to meet the desired functionality as there could be significant deviations in the as-produced part from the designed one. Evidently, an approach (non-destructive) to eval-uate the dimensional accuracy of all the elements and eventually the lattice quality is of great significance. X-ray computed tomography (CT) has emerged as a promis-ing solution in the field of industrial quality control over the last few years due to its non-destructive approach. In this work, we propose a methodology for geometrical evaluations of a lattice structure by measuring the deviation in the shape and size of its strut elements holistically. The acquired CT data of the complete lattice is extracted in the form of a point cloud and then segmented and stored as a single strut element with unique identification so that measurements can be performed on the strut individually. As demonstrated with a metallic BCCz type lattice structure, the methodology helps in critical evaluation of its quality and the correlation with spatial position of the individ-ual struts; e.g. the lattice exhibits large variations of shape among the inclined struts while the vertical struts possess consistency in their shape.
Keywords: Lattice structure, non-destructive evaluation, X-ray computed tomography, point cloud, strut
1. Introduction
Lattice structures are defined as a periodical arrangement of unit cells intercon-nected in three dimensional (3D) space. Thanks to the advancements in manufactur-ing, mainly additive manufacturing (AM) these structures have become very prominent
in recent times due to their number of advantages including optimum use of material,
5
shorter manufacturing time, reduced energy utilization and enhanced mechanical prop-erties [1,2]. These advantages make the lattice structures very suitable for high-value aerospace (lightweight thermal controller), biomedical (implants), and engineering ap-plications, more details about the application can be found in [3,4]. Furthermore, they are also advantageous in context to the entire product life cycles, e.g., lattice structures
10
are particularly beneficial in minimizing material waste [5] and can be recycled easily, particularly when comprised of a single material. There are various types of lattice structures based on the composition of their unit cells. Helou et al. [1] categorized most of the lattice structures as manually and mathematically generated structures. In many cases of additive manufacturing, the unit cell is composed of well-organized
15
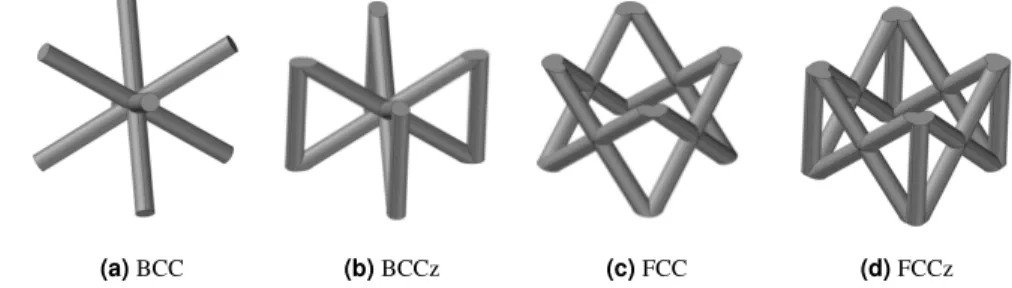
struts in various forms such as octet-truss, body-centered cubic (BCC), body-centered cubic with z struts (BCCz), face-centered cubic (FCC), face-centered cubic with z struts (FFCz), etc. [6], which are represented in Fig.1.
The lattice structure should possess good dimensional and geometrical quality to meet the desired mechanical performance of the part. The additive manufacturing
pro-20
cesses (especially for metallic structures) induce a lot of geometrical irregularities such as surface deviations, roughness, and waviness, etc. especially with metallic materials [7]. The surface can be controlled to a certain extent with post-processing methods [8] but the geometrical characterization of the struts is extremely important to predict their mechanical properties as demonstrated in [9], where an equivalent diameter of a
25
single strut was proposed for the stiffness prediction. Kadirgama et al. [10] used X-ray computed tomography (X-ray CT or CT) based global comparison for evaluating the dimensional accuracy of the lattice. In most of the work, they use either a representa-tive strut element or a global deviation but there is a lack of geometrical evaluation of the lattice considering all its strut elements, which can be crucial when correlating the
30
geometrical accuracy with process parameters and mechanical responses. The behav-ior of strut elements within a lattice can be different due to the fact that their relative position and orientation with respect to the build direction are different, which makes it difficult to generalize their behavior based on a single strut or a global comparison.
As regards measuring technology, X-ray CT is the most suitable for analyzing
lat-35
tice structures since classical optical and mechanical (probe-based) measurement sys-tems suffer from very limited third-dimensional range and reach-ability to the complex feature respectively. X-ray CT is a computer-aided non-destructive technique (NDT) that uses irradiation to produce 3D internal and external representations of a scanned object [11,12]. X-ray CT scanning has been used in many areas of industry for various
40
quality aspects such as flaw detection, failure analysis, metrology, assembly analysis, and reverse engineering applications [13,14,15,16]. Thompson et al. [17] have high-lighted the advancements of CT including novel porosity measurements, artifact devel-opment, and hybrid dimensional measurements, which make CT a preferred solution for quality assessment of AM parts. Van Bael et al. [18] utilized X-ray CT for
optimiz-45
ing the robustness and controllability of the production of porous Ti6Al4V structures
produced by Laser Powder Bed Fusion (LPBF) [19] by reducing the mismatch between
designed and as-produced morphological and mechanical properties. Yan et al. [20]
revealed with the help of micro CT that the gyroid cellular lattice structures with var-ious unit cell sizes ranging from 2 to 8 mm can be manufactured free of defects by
LPBF without the need of additional support structures. It is demonstrated in [21] that micro CT provides not only 3D quantification of structure quality but also a feedback mechanism, such that improvements to the initial design can be made to create more stable and reliable titanium structures for a wide variety of applications. Researchers [22,23] have also studied the accuracy of CT measurement of AM parts using a test
55
artifact. As reported in [24,25], they used X-ray CT for surface topography measure-ment, by extracting profiles from the slice data obtained from measurement of lattice struts. Furthermore, a more extensive examination of CT based surface topography measurement performance in comparison to conventional optical surface measurement was reported in [26,27,28]. It is evident that X-ray CT can be used for extracting
60
surface topography, dimensional measurements, and geometrical deviation in context to AM parts.
In this work, we present a CT-based general methodology to assess both the global and local quality of a lattice structure by means of strut-by-strut evaluations, which leads to identifying the geometrically critical aspects of lattices and the influence of
65
the relative position and orientation on the strut geometry. The raw data is acquired with an X-ray CT system with optimized scanning parameters, which undergoes sev-eral processing steps to ensure a robust measurement approach. The paper is organized as follows: first, the methodology is explained step-wise including the data acquisi-tion, data processing, indexing, and measurement approach. Secondly, a case study is
70
presented with an Inconel 718 based BCCz lattice structure produced by additive man-ufacturing with results obtained with the methodology followed by discussions. The paper is concluded with a summary of the major findings of the study and future work.
2. Methodology
This section describes the proposed methodology with a generalized approach
ap-75
plicable to different types of lattice structures, which consist of an arrangement of unit cells of several interconnected cylindrical strut elements. The commonly used unit
cells are BCC, BCCz, FCC, and FCCz which are shown in Fig.1. The methodological
procedure from data acquisition to measurement will be explained in detail in the next sections.
80
(a) BCC (b) BCCz (c) FCC (d) FCCz
2.1. Data acquisition
X-ray CT is a very extensive measurement technique that involves several steps for performing the requisite task [12] and whose result depends on factors related to the system, object, data processing, environment as well as the operator as explained in [29].
85
During the scanning procedure, the part is placed between an X-ray source and a 2D detector and several hundreds of projections are recorded while the part is rotated. The cone shape of the X-ray beam allows different magnification and thus different spatial resolution with the same material. The closer the part is placed to the source, the higher the resolution (lower voxel size) is achieved, the best achievable resolution being
90
relative to the size of the part. Indeed, for reconstructing the whole part with the best quality, all the object has to project inside the field of view of the detector. The quality of the CT result depends on the selection of the scanning parameters (current, voltage, exposure time, etc.), which need to be optimized considering the size, geometry, and the material of the part as explained in section 2.6.1. The voltage and the current
95
of the X-ray tube influence the energy of X-rays and the flux (number of photons) respectively. All the projections are then acquired with those optimized parameters [11].
2.2. Point cloud extraction
The acquired projections are processed through a reconstruction algorithm to
ob-100
tain 3D volumetric data. The most widely used filtered back-projection approach based FDK (Feldkamp, Devis, and Kress) algorithm is utilized [30,31], which has the advan-tage of much lower computation time compared to other techniques. The next step is the surface determination of this volume, which consists of identifying the limit be-tween the object and the background. This surface determination is performed using
105
the ISO-50% method that defines the surface at the mean of the average material grey value and average background grey value, which is a global method and offers better reproducibility.
The volume is then registered in the 3D scene in such a way that the x-y plane represents the building plane (BP) the z-axis represents the building direction (BD).
110
Then, the volumetric dataset of the lattice is exported in the form of a point cloud. This raw point cloud is post-processed to segment all the strut elements and obtain a separate point cloud as explained in the next section.
2.3. Segmentation
The segmentation process is done by superimposing a regular pattern of the strut
115
elements in the lattice structure. The pattern admits the classification of the strut ele-ments by categorizing them into groups termed as families. The family is defined as a group of struts following a set pattern which generalizes their segmentation from the lattice structure. There are three types of families identified as a strut-type family (FB)
or cell- type family (FC) and node family (FN), where the first two contain different
120
strut elements and the last one contains the nodes (the nodes are the positions where the strut elements intersect). In BCCz type lattice, there are two categories of struts
where the vertical strut belongs to the strut-type family as they need to be extracted in-dividually while the inclined strut belongs to the cell-type family as they are extracted cell-by-cell.
125
Figure 2: Extraction of a strut in a lattice structure and the extracted strut has its local coordinate system independent of the parent lattice structure
Followed by the surface determination step (explained later in section2.6.2), the raw point cloud of the lattice surface is obtained which is treated further with distinct approaches for achieving strut-type family or cell-type family. The process of point cloud extraction for the strut-type family is directly performed by storing each strut point cloud from the bounded box with the unique indexing of each strut as detailed
130
in the following section. As depicted in Fig.2, three operations are performed for the cell-type family as follows: firstly, the cell point cloud is extracted using the cell bounded box and is indexed for each individual cell. Secondly, each strut point cloud within the cell (obtained from the first step) is extracted using the strut bounded box and is indexed uniquely. As the last step, each strut point cloud is vertically rotated
135
for the measurement process. The rotation angle is given by either a nominal direction of each strut where determined by the direction of cylindrical fitting of the strut point cloud.
2.4. Indexing Strategy
The indexing strategy is performed for a general lattice structure with N families
140
of FB,i, i = 1, ..., N , M families of FC,i, i = 1, ..., M and a node family. In each
of FB,i, the struts are designated with three indices ([ib3][ib2][ib1]) which define their
positions in the lattice structure coordinate frame. Equivalently, for the node family, the nodes are indexed by [in3][in2][in1]. On the other hand, for each FC,i, the designation
of struts consists of six indices ([ic3][ic2][ic1][ib3][ib2][ib1]), where the first three
145
indices correspond to the cell position which is defined in the structure coordinate frame and the last three indices correspond to strut position corresponding to the cell coordinate frame.
2.5. Measurement approach
Based on the previous steps, all the strut elements are now extracted from the
lat-150
tice, assigned a unique identification, and stored individually for further treatment. Strut-type and cell-type families can be handled with the same measurement approach,
(a)
(b)
(c)
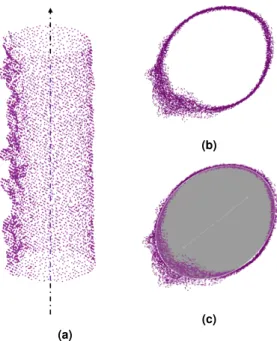
Figure 3: The strut measuring approach: individual strut point cloud (a), projection on orthogonal plane (b) and ellipse fitting (c)
but the node family needs to be treated separately. Depending on the requirements, different measurement attributes can be assigned to the strut elements for their geomet-rical quality assessment. In this work, we present an example of a simple projection
155
based fitting method where each individual strut point cloud is projected on a plane orthogonal to the vertical axis. The projection points are then fitted by an ellipse fitting method as illustrated in Fig.3. The method is based on the work of Fitzgibbon et al. [32] which utilizes the direct least-square fitting to obtain fast-fitting for the projected point cloud of the strut to an ellipse point set. We obtain the measurement of each strut
160
in the form of the (semi) major axis, (semi) minor axis, and the least square error E of the elliptical fitting.
The measurement data is stored systematically according to the two families of indexing (vertical and inclined struts). The data is used to perform further statistical analysis to be able to observe the quality of each strut and more importantly to
under-165
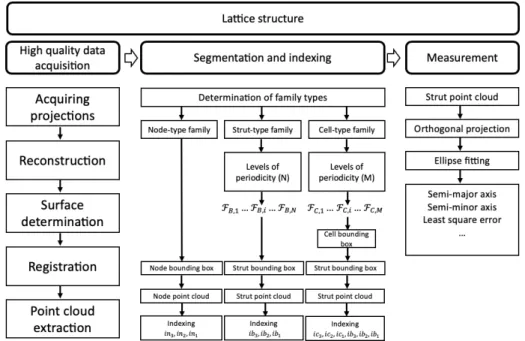
stand the overall behavior of the lattice structure. For instance, the spatial classification of the groups of struts according to their section quality. The explained methodology is summarized schematically in Fig.4. The application of the methodology and use of measurement data for statistical analysis are demonstrated in the next section.
2.6. Application on a metallic lattice structure
170
The methodology was applied on an Inconel based lattice structure produced from the LPBF additive manufacturing process on an EOS 290 machine. The lattice struc-ture is in a form of an isometric cube with an equal number of unit cells in all three
Figure 4: Schematic diagram of the methodology
directions (x, y, and z). The unit cell of the lattice is a type of body-centered cubic with (vertical) z-struts geometry (BCCz), which consists of four vertical struts and
175
four pairs of 45◦inclined struts (Fig.1b). The vertical struts are shared among four neighboring unit cells whereas the inclined struts are entirely part of one unit cell. The struts of the lattice are designed as identical solid cylindrical elements with a nominal strut diameter of 1 mm. The material of the lattice is Inconel 718 with a density of
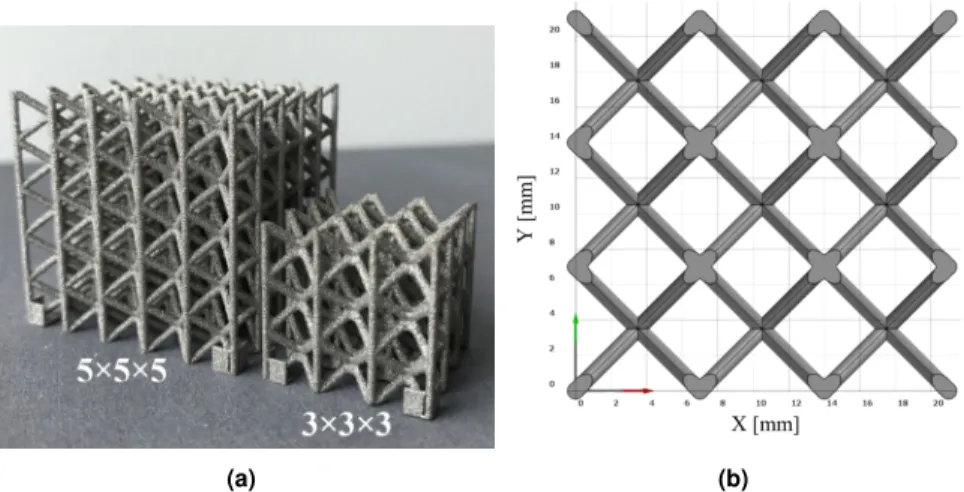
8.47 g/cm3. The two common configurations of the lattice structure are 5 × 5 × 5
180
and 3 × 3 × 3 with five and three unit cells in each direction respectively as shown in Fig.5a; however, only the latter is discussed in this work. Fig.5bpresents the nominal dimensions of the lattice grid.
2.6.1. Data acquisition with X-ray CT
The tomographic acquisitions have been carried out using a Viscom XT 9225D
185
micro-focus open X-ray tube, with a maximum voltage of 225 kV and a maximum power of 320 W , as illustrated in Fig.6. The detector is a matrix of photodiodes with CsI scintillator, brand Perkin Elmer, model XRD 0822, having 1024 × 1024 pixels of 200 µm. The lattice is placed between the source and the detector on the rotary stage and the projections are acquired for complete 360◦rotation.
190
In order to find out the right set of scanning parameters for the Inconel (3×3×3) lat-tice structure, the transmission-based approach was utilized which states that a minimal transmission between 10% and 20% is required to reach an optimal signal-to-noise ra-tio (SNR) [33,34]. The transmission is the ratio between the minimal and the maximal X-ray intensity at the detector, which is expressed in the respective grey values of the
(a) (b)
Figure 5: Inconel cubic lattice structures with two configurations (a) and the top view of 3 × 3 × 3 with the nominal dimensions (b)
X-ray projection. For performing the optimization of scanning parameters, the
radiog-raphy module of NDT simulation software CIVA®developed by CEA [35] was used.
Simulated radiographs were acquired at different settings on voltage, current, and filter thickness following a design-of-experiment approach. The minimum, maximum grey levels of the radiograph and their ratio were examined and the parameters satisfying
200
the above-mentioned minimal transmission criteria were chosen. The final optimized parameters for the Inconel 718 metallic lattice structure of 3 × 3 × 3 configuration are provided in Table1as "LR-CT".
Figure 6: The set-up of X-ray CT acquisitions
2.6.2. Data processing and preparation
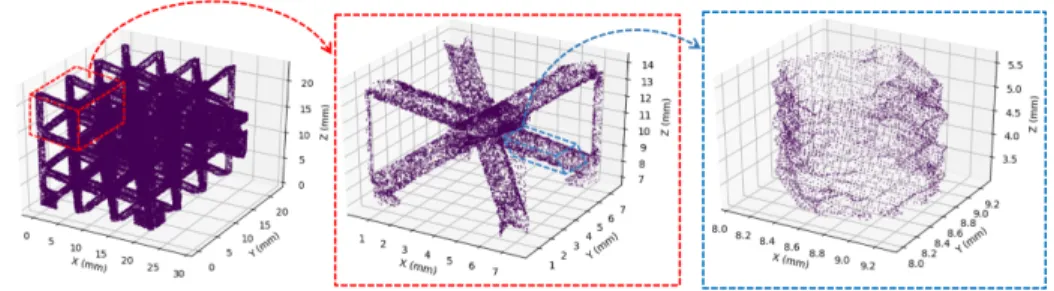
The obtained projections are processed to reconstruct the lattice volumetric dataset,
205
Table 1: CT data acquisition settings Factor LR-CT HR-CT Voltage [kV ] 170 180 Current [µA] 100 50 Exposure time [s] 0.5 2 No. of projections [−] 900 900
Filter thickness (Cu) [mm] 0.6 0.6
Voxel size [µm] 38 10
Source-to-detector distance [mm] 500 800
Source-to-object distance [mm] 100 40
the entire lattice structure; the procedure is illustrated in Fig.7. As already explained in section2.3, the raw point cloud is then treated into separated processes for achieving the set of vertical and inclined strut point clouds respectively. Moreover, each strut length is kept in the range of 3 ± 0.5 mm to avoid outlier points from the nodes.
210
(a) (b) (c)
Figure 7: The data processing steps: projections (a), reconstruction and surface determination (b) and point cloud extraction (c)
2.6.3. Indexing of struts in a 3X3X3 lattice
The (3 × 3 × 3) lattice structure is separated into a cell-type family (inclined struts) and a strut-type family (vertical struts). The structure consists of 216 inclined and 48 vertical strut elements. Considering a large number of struts, it is extremely important to designate them with a unique identification which should represent their spatial
po-215
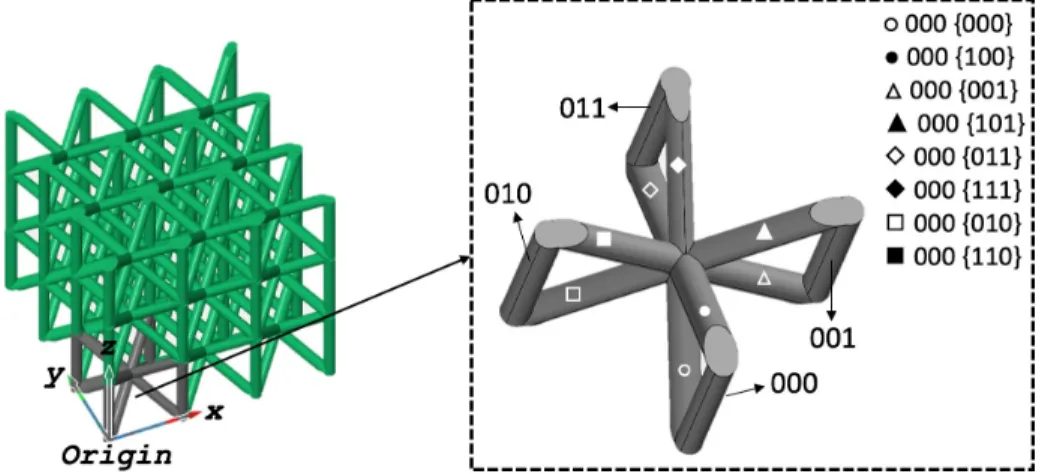
sition and orientation in the lattice space. Furthermore, the indexing is also useful for reporting measurement results and analyses and traceability. Therefore, the designa-tion of inclined struts consists of six indices ([icz][icy][icx][ibz][iby][ibx]), where the first three indices correspond to the cell position and the last three indices correspond to strut position and orientation. On the other hand, the vertical struts can be designated
220
only with three indices ([ibz][iby][ibx]). The indexing corresponds to the registration of the point cloud and thus it starts accordingly from the origin as explained in Fig.8.
Table2contains the information of the indices; the levels vary with the configuration of the lattice.
Figure 8: Indexing of inclined ([icz][icy][icx][ibz][iby][ibx]) and vertical struts ([ibz][iby][ibx])
Table 2: Indexing levels of vertical and inclined struts for 3 × 3 × 3 configuration
Index Levels Inclined Vertical icz 0, 1, 2 -icy 0, 1, 2 -icx 0, 1, 2 -ibz 0, 1 0, 1, 2 iby 0, 1 0, 1, 2, 3 ibx 0, 1 0, 1, 2, 3 2.6.4. Measurement qualification 225
The measurement qualification approach allows having an insight into the accu-racy of the CT measurements as compared to a reference measurement obtained from other measuring techniques. Optical profilometer based measurements have shown a good measurement uncertainty in [27,36,37,38]; hence, it is utilized for our reference measurement. Individual strut elements were measured with an Alicona optical
pro-230
filometer with an objective of 10X. The struts from the center cell (cell designation: 111) were cut precisely from a 3 × 3 × 3 lattice structure using Electrical Discharge Machining (EDM) process. Then, the individual strut elements are extremely small in size, so they were embedded in resin for better handling during CT scanning. Com-pared to previous CT acquisition of the complete part, new parameters are defined (in
235
Table1as "HR-CT") and a higher resolution can be achieved when measuring a single strut. While the voxel size was 38 µm for the lattice scanning, the voxel size is reduced to 10 µm.
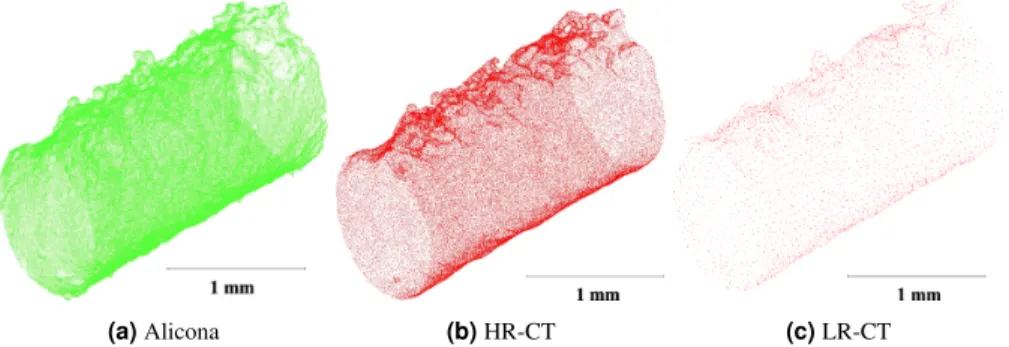
Finally, there were three measurements (in the form of point clouds) of the same strut 111[111] which are: a. Optical reference measurement (Alicona); b. CT
measure-240
ment of single strut scanned after cutting (HR-CT) and c. CT measurement of the strut extracted from the full lattice scan before cutting the lattice (LR-CT) as shown in the Fig.9.
(a) Alicona (b) HR-CT (c) LR-CT
Figure 9: Point clouds of a single strut obtained from optical measurement after cutting and from CT (scanned as a single strut after cutting and scanned as a full lattice structure)
Table 3: Measurement qualification
Factor Alicona X-ray CT HR-CT LR-CT Resolution [µm] 2 10 38 Number of points 131157 52773 4082 Semi-major axis [mm] 0.623 0.611 0.611 Semi-minor axis [mm] 0.485 0.482 0.478 Least sq. error [mm] 0.0015 0.0016 0.0018
The corresponding point clouds were registered with the widely used Iterative Clos-est Point (ICP) algorithm in CloudCompare opensource software [39] which minimizes
245
the difference between there two clouds of points. After the registration, each point on the CT (measured) point cloud has a corresponding point on the Alicona (reference) point cloud which is defined by the shortest distance, and the remaining points are termed as non-corresponding points. The cloud-to-cloud (C2C) distance function is utilized to compute the distance from the measured point cloud relative to the
refer-250
ence point cloud with a height function (quadric) computed on all the neighbors falling in a sphere of specified radius around each point of comparing point cloud. The
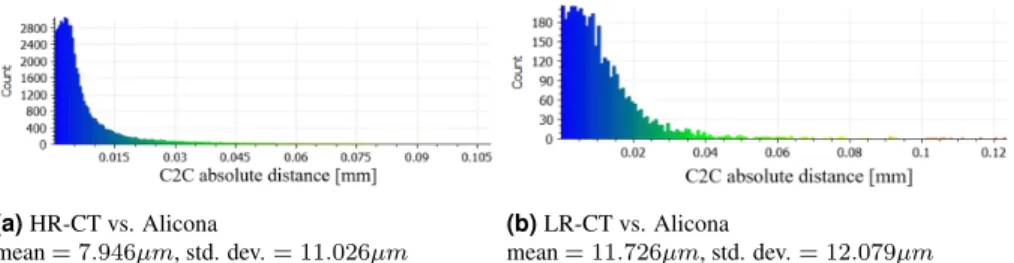
re-sults are presented in Fig.10where part a and b show the C2C distances obtained
on the CT point cloud when compared against the Alicona (as reference) for HR and LR respectively, which is indicated as the relative error in the CT measurements. The
255
mean errors are 8 µm and 12 µm for a voxel size of 10 µm (HR-CT) and 38 µm (LR-CT) respectively; which is relatively smaller with an approximate increment of 1 µm per 10 µm voxel size increment. The higher standard deviation is resulted due to the
higher skewness on the measured distances. Furthermore, the projection-based ellipse fitting results provide very good agreement with the Alicona measurement as visible in
260
Fig.11; the numerical information of all three point clouds is listed in Table3. Nev-ertheless, it is understood that the projection-based measurement results in the loss of variability along the strut axis, which can be studied by assigning other measurement attribute to the strut elements.
(a) HR-CT vs. Alicona
mean = 7.946µm, std. dev. = 11.026µm
(b) LR-CT vs. Alicona
mean = 11.726µm, std. dev. = 12.079µm Figure 10: Histograms of C2C distances obtained by the comparison of CT and Alicona point clouds
(a) Alicona (b) HR-CT (c) LR-CT
Figure 11: The projection of point clouds and the ellipse fit (the dimensions are in mm)
3. Results and discussions
265
The measurement results of the 3×3×3 lattice structure obtained from the proposed methodology are presented and discussed in this section. The lattice structure consists of three identical layers printed in a continuous manner over to each other which are termed as the bottom layer, middle layer, and top layer; however, each layer has two levels (ibz = 0 and ibz = 1) of inclined struts.
270
3.1. Global measurement
The global deviations of the manufactured lattice structure compared to its nominal geometry give an overview of the quality of a part. The volumetric CT data can be com-pared with nominal geometry (CAD model) following a best-fit registration in VGStu-dio Max 3.0 and the results are included in Fig.12. It can be seen in Fig.12a, that
275
inclined strut elements show a positive deviation (red) and negative deviation (blue) in the orthogonal direction, which indicate their tendency to an elliptical cylinder as
(a) (b) (c)
Figure 12: Global deviation of lattice structure from the nominal geometry as obtained with best-fit registra-tion and presented with 3D view (a), front view (b) and virtually secregistra-tioned central cell (c)
compared to the nominal circular cylinder. However, this effect diminishes towards the center as visible in Fig.12band more evidently in Fig.12c, which represents the central cell of the lattice structure. On the other hand, the vertical strut elements are
280
rather regular in form and possess smaller deviations distributed uniformly. This global comparison gives an initial impression of part quality, however, it becomes important to analyze the struts individually in order to perform several measuring operations to characterize them and eventually assess the quality of the lattice structure.
(a) Inclined (b) Vertical
Figure 13: The summary of the ellipse fitting measurements of all the struts consisting the mean and standard deviation
3.2. Measurement with the methodology
285
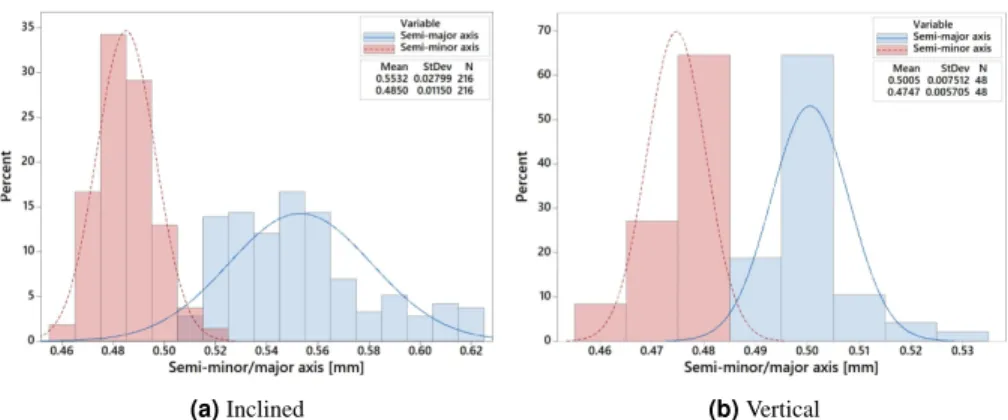
The ellipse fitting parameters (semi-major axis, semi-minor axis and least square error of fitting) have been obtained for all the strut elements in 3×3×3 lattice. Fig.13a
and Fig.13bshow the summary of these measurements for inclined and vertical struts respectively. In general, it can be concluded that the inclined struts exhibit a greater variability (longer range) and contrast (the difference between major and minor axes) in
290
measured ellipse axes as compared to the vertical struts, which was also evident in the global comparison. Therefore, the vertical struts are closer to circular cylindrical shape as the difference between major and minor axes is very small with a mean of 0.03 mm as compared to 0.065 mm for inclined struts. These results are further elaborated to study the repeatability of the manufacturing process and statistical correlations.
295
(a) Semi-minor axis
(b) Semi-major axis
Figure 14: The measurement results of inclined struts along x − z (individual standard deviations were used to calculate the intervals with 95 % confidence (CI))
3.2.1. Repeatability study
The periodicity of the lattice structures makes it possible to study the influences of the spatial position and orientation on the strut measurements thanks to the indexing
strategy of the methodology. Fig.14and Fig.15present the measurement results of
inclined struts, and Fig.16provides the results of vertical struts. Fig.14and Fig.15
300
consist of two parts each where a is the minor axes and b is the major axes plots along x − z and y − z plane respectively. Each figure has three partitions corresponding to the bottom (blue), middle (red) and top (green) layers; each layer is further partitioned into two levels corresponding to the lower and upper cell levels. The circular marker represents the individual point and the mean value is represented by the colored solid
(a) Semi-minor axis
(b) Semi-major axis
Figure 15: The measurement results of inclined struts along y − z (individual standard deviations were used to calculate the intervals with 95 % confidence (CI))
marker; individual standard deviations were used to calculate the intervals with 95 % confidence (CI).
Overall, the measurements of inclined struts show that the minor axis of ellipse fitting is very consistent throughout the lattice irrespective of the levels but the major axis exhibits variations within a level, which could be attributed to the negative surface
310
with a higher roughness level. As depicted in Fig.14band Fig.15b, the variations of major axis measurements within one level are comparatively higher along the y − z plane than that of x − z plane; however, the struts demonstrate good repeatability along the build direction (z) in the x − y plane. Generally, the mean value of the minor axis (0.49 mm) is closer to the nominal radius (0.50 mm) of the strut whereas the mean
315
value of the major axis (0.55 mm) is considerably higher (the ratio of major and minor axes is 1.22), which results in a prominently elliptical shape of the inclined struts.
On the contrary to inclined struts, the vertical struts are more circular in shape as the semi-major and semi-minor axes are very close to each other as evident in Fig.16. The mean value of the minor axis and major axis are (0.47 mm) and (0.50 mm)
respec-320
tively which result in a more circular cylindrical shape (the ratio of major and minor axes is 1.06). The struts show a good consistency in their shape except slight devia-tions observed at the corner locadevia-tions which was also evident in the global comparison in Fig.16. On comparison of the three layers along the build direction, the overall
repeatability seems to be very good in both the x and y directions.
325
(a) Semi-minor axis along x − z plane (b) Semi-major axis along x − z plane
(c) Semi-minor axis along y − z plane (d) Semi-major axis along y − z plane
Figure 16: The measurement results of vertical struts (individual standard deviations were used to calculate the intervals with 95 % confidence (CI))
3.2.2. Strut shape study
The ratio of the semi-major axis to the semi-minor axis can represent the deviation from a circular geometry (= 1), a higher ratio (> 1) means the ellipse gets flattened. The contour plots of the ratio have been obtained for inclined and vertical struts along the build direction of the lattice which are shown in Fig.17and Fig.18. The indices
330
have been combined for inclined struts in all three directions as icx − ibx, icy − iby, and icz − ibz which eventually have six levels (0 − 0, 0 − 1, 1 − 0, 1 − 1, 2 − 0 and 2 − 1) each considering the two levels within one cell and the original indices are used for vertical struts. As evident in Fig.17, the central portion of each level experiences smaller deviations thus struts remain closer to a circular geometry and the deviations
335
are increased in moving away from the center position towards the corners, where the highest deviations from circular geometry (bigger ratio) are observed.
3.2.3. Statistical study
A design-of-experiment scheme was generated based on spatial positions (indices) of the struts as factors and the measurements (ratio of major/minor axes) as a response
Figure 17: Contour plot of ratio (semi-major axis/semi-minor axis) for inclined struts (the X and Y axes correspond to the indices icx − ibx and icy − iby respectively)
Table 4: ANOVA model summary
Strut type S R2 R2(adjusted) R2(predicted)
Inclined 0.0275291 91.32 85.07 74.08
Figure 18: Contour plot of ratio (semi-major axis/semi-minor axis) for vertical struts
(a) (b)
Figure 19: Pareto chart (α = 0.05) of ratio (semi-major axis/semi-minor axis) for inclined struts (a) and vertical struts (b)
variable. For inclined struts, the combination of two indices ic and ib was considered as one direction. Analysis of variance (ANOVA) was used to identify the significance of the spatial position on the morphology of the struts. The results are presented in the forms of Pareto charts for inclined and vertical struts in Fig.19a and Fig. 19b
respectively. The Pareto chart shows the absolute values of the standardized effects
345
from the largest effect to the smallest effect. The standardized effects are the tstatistics which test the null hypothesis that the effect is 0. The chart also plots a reference line to indicate which effects are statistically significant. The reference line for statistical significance depends on the significance level (denoted by α) which equals to 0.05 with a confidence level of 95% for the analysis.
350
It can be seen from the charts, that the most significant direction affecting the ratio is along the Y -axis for both inclined and vertical struts. The interaction (Y · X) and X direction are also significant which indicates that the relative position in the x − y plane affects the strut geometry in addition to their respective x and y position. However, the effects are more prominent for inclined struts as the variation in the ratio for vertical
355
struts has a very narrow range. As it has been demonstrated that the struts show good repeatability along the z direction, thus it resulted insignificant for both types of struts.
The model summary included in Table4interprets the goodness of the ANOVA fitting with high R2. The predictability is also very high for the model of inclined struts but limited for vertical struts.
360
4. Conclusions
A global approach for non-destructive evaluations of AM lattice structures is of great importance to predict their behavior under working conditions. Quantification of the deviations in desired geometry helps in tuning the manufacturing process pa-rameters (direction of the laser, positioning of the lattice on the plate, the grain size
365
of powder, and post heat treatment). Furthermore, the information achieved from such methodology can also be utilized for parametric modeling of the lattice and subse-quently more realistic mechanical simulation. A generalized methodology for global non-destructive evaluations of lattice structures is presented in this work. Thanks to the strut-by-strut measurement approach, this methodology can be applied to various types
370
of lattice structures. The robustness of this methodology can be attributed to the several steps especially the registration and the indexing of the lattice. The indexing strategy allows performing analytical observations of the struts with respect to their spatial posi-tion within the lattice structure. The same has been demonstrated with results obtained from a BCCz type metallic lattice structure of 3×3×3 configuration. All the struts have
375
been divided into two categories as vertical and inclined. In an overview, the vertical struts exhibit minimal deviation from the nominal circular cylindrical geometry, while the inclined struts have a higher deviation from the nominal geometry resulting in an elliptical cylindrical shape. The measurements plots reveal that the struts show signif-icantly high repeatability along the build direction despite local variation of the struts’
380
shape within each z level. The contour plots of the ratio (semi-major/semi-minor) re-port the shape variation is extreme at the corners and reduces towards the center. The most significant direction affecting the shape of the strut is along the Y -axis for both inclined and vertical struts. The interaction (Y · X) and X direction are also significant which indicates that the relative position in the x − y plane affects the strut geometry
385
in addition to their respective x and y position.
As demonstrated, the methodology provides both qualitative and quantitative infor-mation about the geometrical aspects of the lattice structure locally as well as globally. It helps in understanding the preferential occurrence of the geometrical deviations in the lattice building direction/plane. The measurement information can be very useful
390
in optimizing the lattice manufacturing parameters which is envisaged in our future work. Further extension of the work is with numerically modeling the dispersion of the lattice structure which could lead to achieving more realistic mechanical responses.
References
[1] M. Helou, S. Kara, Design, analysis and manufacturing of lattice structures: an
395
overview, International Journal of Computer Integrated Manufacturing 31 (3) (2018) 243–261.
[2] M. K. Thompson, G. Moroni, T. Vaneker, G. Fadel, R. I. Campbell, I. Gibson, A. Bernard, J. Schulz, P. Graf, B. Ahuja, et al., Design for additive manufacturing: Trends, opportunities, considerations, and constraints, CIRP annals 65 (2) (2016)
400
737–760.
[3] T. Maconachie, M. Leary, B. Lozanovski, X. Zhang, M. Qian, O. Faruque, M. Brandt, Slm lattice structures: Properties, performance, applications and chal-lenges, Materials & Design 183 (2019) 108137.
[4] F. Calignano, M. Galati, L. Iuliano, P. Minetola, Design of additively
manufac-405
tured structures for biomedical applications: a review of the additive manufactur-ing processes applied to the biomedical sector, Journal of healthcare engineermanufactur-ing 2019.
[5] C. B. Williams, J. K. Cochran, D. W. Rosen, Additive manufacturing of metal-lic cellular materials via three-dimensional printing, The International Journal of
410
Advanced Manufacturing Technology 53 (1-4) (2011) 231–239.
[6] M. Leary, M. Mazur, H. Williams, E. Yang, A. Alghamdi, B. Lozanovski, X. Zhang, D. Shidid, L. Farahbod-Sternahl, G. Witt, et al., Inconel 625 lattice structures manufactured by selective laser melting (slm): mechanical properties, deformation and failure modes, Materials & Design 157 (2018) 179–199.
415
[7] R. Leach, D. Bourell, S. Carmignato, A. Donmez, N. Senin, W. Dewulf, Geo-metrical metrology for metal additive manufacturing, CIRP annals 68 (2) (2019) 677–700.
[8] P. Lhuissier, C. De Formanoir, G. Martin, R. Dendievel, S. Godet, Geometrical control of lattice structures produced by ebm through chemical etching:
Investi-420
gations at the scale of individual struts, Materials & Design 110 (2016) 485–493. [9] M. Suard, G. Martin, P. Lhuissier, R. Dendievel, F. Vignat, J.-J. Blandin, F. Vil-leneuve, Mechanical equivalent diameter of single struts for the stiffness predic-tion of lattice structures produced by electron beam melting, Additive Manufac-turing 8 (2015) 124–131.
425
[10] K. Kadirgama, W. S. W. Harun, F. Tarlochan, M. Samykano, D. RamasamyMohd Zaidi Azir, H. Mehboob, Statistical and optimize of lattice structures with selec-tive laser melting (slm) of ti6al4v material, The Internation Journal of Advanced Additive Manufacturing 97 (1-4) (2018) 495–510.
[11] J. P. Kruth, M. Bartscher, S. Carmignato, R. Schmitt, L. De Chiffre, A.
Weck-430
enmann, Computed tomography for dimensional metrology, CIRP Annals-Manufacturing Technology 60 (2) (2011) 821–842.
[12] P. Hermanek, J. S. Rathore, V. Aloisi, S. Carmignato, Principles of x-ray com-puted tomography, in: Industrial X-Ray Comcom-puted Tomography, Springer, 2018, pp. 25–67.
[13] N. E. Gorji, P. Saxena, M. R. Corfield, A. Clare, J.-P. Rueff, J. Bogan, P. G. González, M. Snelgrove, G. Hughes, R. O’Connor, et al., A new method for assessing the recyclability of powders within powder bed fusion process. [14] P. Saxena, G. Bissacco, K. Æ. Meinert, A. H. Danielak, M. M. Ribó, D. B.
Peder-sen, Soft tooling process chain for the manufacturing of micro-functional features
440
on molds used for molding of paper bottles, Journal of Manufacturing Processes 54 (2020) 129–137.
[15] P. Saxena, G. Bissacco, C. Gundlach, V. A. Dahl, C. H. Trinderup, A. B. Dahl, Process characterization for molding of paper bottles using computed tomography and structure tensor analysis, E-Journal of Nondestructive Testing & Ultrasonics
445
24 (3).
[16] J. S. Rathore, T. Konopczy´nski, J. Hesser, G. Lucchetta, S. Carmignato, In-vestigation on tomographic-based nondestructive characterization of short glass fiber-reinforced composites as obtained from micro injection molding, Journal of Nondestructive Evaluation, Diagnostics and Prognostics of Engineering Systems
450
3 (2).
[17] A. Thompson, I. Maskery, R. K. Leach, X-ray computed tomography for additive manufacturing: a review, Measurement Science and Technology 27 (7) (2016) 072001.
[18] S. Van Bael, G. Kerckhofs, M. Moesen, G. Pyka, J. Schrooten, J.-P. Kruth,
Micro-455
ct-based improvement of geometrical and mechanical controllability of selective laser melted ti6al4v porous structures, Materials Science and Engineering: A 528 (24) (2011) 7423–7431.
[19] ISOASTM52900, Additive manufacturing - general principles - terminology, In-ternational Organization for Standardization, American Society for Testing and
460
Materials.
[20] C. Yan, L. Hao, A. Hussein, D. Raymont, Evaluations of cellular lattice struc-tures manufactured using selective laser melting, International Journal of Ma-chine Tools and Manufacture 62 (2012) 32–38.
[21] T. B. Kim, S. Yue, Z. Zhang, E. Jones, J. R. Jones, P. D. Lee, Additive
manufac-465
tured porous titanium structures: Through-process quantification of pore and strut networks, Journal of Materials Processing Technology 214 (11) (2014) 2706– 2715.
[22] M. B. Bauza, S. P. Moylan, R. M. Panas, S. C. Burke, H. E. Martz, J. S. Taylor, P. Alexander, R. H. Knebel, R. Bhogaraju, M. O’Connell, et al., Study of
accu-470
racy of parts produced using additive manufacturing, in: ASPE Spring Topical Meeting: Dimensional Accuracy and Surface Finish in Additive Manufacturing, Berkeley, CA, Apr, 2014, pp. 13–16.
[23] S. Moylan, Progress toward standardized additive manufacturing test artifacts, in: Proceedings of the ASPE 2015 Spring Topical Meeting Achieving Precision
475
Tolerances in Additive Manufacturing, Raleigh, NC, USA, 2015, pp. 26–29. [24] G. Pyka, A. Burakowski, G. Kerckhofs, M. Moesen, S. Van Bael, J. Schrooten,
M. Wevers, Surface modification of ti6al4v open porous structures produced by additive manufacturing, Advanced Engineering Materials 14 (6) (2012) 363–370. [25] G. Kerckhofs, G. Pyka, M. Moesen, S. Van Bael, J. Schrooten, M. Wevers,
High-480
resolution microfocus x-ray computed tomography for 3d surface roughness mea-surements of additive manufactured porous materials, Advanced Engineering Ma-terials 15 (3) (2013) 153–158.
[26] F. Zanini, L. Pagani, E. Savio, S. Carmignato, Characterisation of additively man-ufactured metal surfaces by means of x-ray computed tomography and
gener-485
alised surface texture parameters, CIRP annals 68 (1) (2019) 515–518.
[27] A. Thompson, N. Senin, C. Giusca, R. Leach, Topography of selectively laser melted surfaces: a comparison of different measurement methods, CIRP Annals 66 (1) (2017) 543–546.
[28] A. Townsend, L. Blunt, P. J. Bills, Investigating the capability of microfocus
x-490
ray computed tomography for areal surface analysis of additively manufactured parts, in: ASPE Summer Topical Meeting: Dimensional Accuracy and Surface Finish in Additive Manufacturing, 2016, pp. 206–210.
[29] H. Villarraga-Gómez, C. Lee, S. T. Smith, Dimensional metrology with x-ray ct: a comparison with cmm measurements on internal features and compliant
495
structures, Precision Engineering 51 (2018) 291–307.
[30] L. Feldkamp, Practical cone beam algorithm, J. Microsc. 185 (1997) 67–75. [31] G. Lauritsch, W. H. Härer, Theoretical framework for filtered back projection in
tomosynthesis, in: Medical Imaging 1998: Image Processing, Vol. 3338, Interna-tional Society for Optics and Photonics, 1998, pp. 1127–1137.
500
[32] A. W. Fitzgibbon, M. Pilu, R. B. Fisher, Direct least squares fitting of ellipses, Proceedings of 13th International Conference on Pattern Recognition (1996) 253–257.
[33] J. S. Rathore, C. Vienne, Y. Quinsat, C. Tournier, Influence of resolution on the x-ray ct-based measurements of metallic am lattice structures, Welding in the World
505
64 (2020) 1367–1376.
[34] A. Kraemer, E. Kovacheva, G. Lanza, Projection based evaluation of ct image quality in dimensional metrology, Proc. digital industrial radiology and computed tomography (DIR).
[35] CIVA, The simulation and analysis platform for nde,http://www.extende.
510
[36] M.-A. de Pastre, A. Thompson, Y. Quinsat, J. A. A. García, N. Senin, R. Leach, Polymer powder bed fusion surface texture measurement, Measurement Science and Technology 31 (5) (2020) 055002.
[37] A. Townsend, N. Senin, L. Blunt, R. Leach, J. Taylor, Surface texture metrology
515
for metal additive manufacturing: a review, Precision Engineering 46 (2016) 34– 47.
[38] N. Senin, A. Thompson, R. K. Leach, Characterisation of the topography of metal additive surface features with different measurement technologies, Measurement Science and Technology 28 (9) (2017) 095003.
520
[39] CloudCompare, 3d point cloud and mesh processing software open source
List of Figures
1 The most common types of unit cell utilized in AM lattice structures . 3
2 Extraction of a strut in a lattice structure and the extracted strut has its
525
local coordinate system independent of the parent lattice structure . . 5
3 The strut measuring approach: individual strut point cloud (a), projec-tion on orthogonal plane (b) and ellipse fitting (c) . . . 6
4 Schematic diagram of the methodology . . . 7
5 Inconel cubic lattice structures with two configurations (a) and the top
530
view of 3 × 3 × 3 with the nominal dimensions (b) . . . 8
6 The set-up of X-ray CT acquisitions . . . 8
7 The data processing steps: projections (a), reconstruction and surface determination (b) and point cloud extraction (c) . . . 9
8 Indexing of inclined ([icz][icy][icx][ibz][iby][ibx]) and vertical struts
535
([ibz][iby][ibx]). . . 10
9 Point clouds of a single strut obtained from optical measurement after cutting and from CT (scanned as a single strut after cutting and scanned as a full lattice structure) . . . 11
10 Histograms of C2C distances obtained by the comparison of CT and
540
Alicona point clouds . . . 12
11 The projection of point clouds and the ellipse fit (the dimensions are in mm) . . . 12
12 Global deviation of lattice structure from the nominal geometry as ob-tained with best-fit registration and presented with 3D view (a), front
545
view (b) and virtually sectioned central cell (c) . . . 13
13 The summary of the ellipse fitting measurements of all the struts con-sisting the mean and standard deviation . . . 13
14 The measurement results of inclined struts along x−z (individual stan-dard deviations were used to calculate the intervals with 95 %
confi-550
dence (CI)) . . . 14
15 The measurement results of inclined struts along y −z (individual stan-dard deviations were used to calculate the intervals with 95 % confi-dence (CI)) . . . 15
16 The measurement results of vertical struts (individual standard
devia-555
tions were used to calculate the intervals with 95 % confidence (CI)) . 16
17 Contour plot of ratio (semi-major axis/semi-minor axis) for inclined struts (the X and Y axes correspond to the indices icx − ibx and icy − iby respectively). . . 17
18 Contour plot of ratio (semi-major axis/semi-minor axis) for vertical struts 18
560
19 Pareto chart (α = 0.05) of ratio (semi-major axis/semi-minor axis) for inclined struts (a) and vertical struts (b) . . . 18
List of Tables
1 CT data acquisition settings . . . 9
2 Indexing levels of vertical and inclined struts for 3 × 3 × 3 configuration 10
565
3 Measurement qualification . . . 11
![Table 1: CT data acquisition settings Factor LR-CT HR-CT Voltage [kV ] 170 180 Current [µA] 100 50 Exposure time [s] 0.5 2 No](https://thumb-eu.123doks.com/thumbv2/123doknet/12737100.357653/10.918.275.640.212.381/table-data-acquisition-settings-factor-voltage-current-exposure.webp)