HAL Id: emse-00682699
https://hal-mines-albi.archives-ouvertes.fr/emse-00682699
Submitted on 31 Oct 2017
HAL is a multi-disciplinary open access
archive for the deposit and dissemination of
sci-entific research documents, whether they are
pub-lished or not. The documents may come from
teaching and research institutions in France or
abroad, or from public or private research centers.
L’archive ouverte pluridisciplinaire HAL, est
destinée au dépôt et à la diffusion de documents
scientifiques de niveau recherche, publiés ou non,
émanant des établissements d’enseignement et de
recherche français ou étrangers, des laboratoires
publics ou privés.
Multi-criteria performance analysis for decision making
in project management
Guillaume Marquès, Didier Gourc, Matthieu Lauras
To cite this version:
Guillaume Marquès, Didier Gourc, Matthieu Lauras. Multi-criteria performance analysis for decision
making in project management. International Journal of Project Management, Elsevier, 2011, 29 (8),
pp.1057-1069. �10.1016/j.ijproman.2010.10.002�. �emse-00682699�
Multi-criteria performance analysis for decision making in
project management
Guillaume Marques
a,⁎
, Didier Gourc
a, Matthieu Lauras
a,baUniversité de Toulouse, Mines Albi, Centre Génie Industriel, Campus Jarlard, Route de Teillet, F-81013 Albi, France
bToulouse Business School/Department of Industrial Organisation, Logistics and Technology, 20 Boulevard Lascrosses, BP 7010, 31068 Toulouse Cedex 7, France
Abstract
This study is focused on decision support in the context of product and service development projects. Decision support requires the capacity to characterize the current state of the project (performance evaluation) and the decision maker's point of view. However, the different projects’ stakeholders do not have the same needs in terms of performance evaluation to support their decision making processes. Furthermore, in some cases controlling project performance using the elementary components of the Iron Triangle (Cost, Time and Quality) alone seems inefficient. This paper proposes a new multi dimensional Project Performance Measurement System that would enable managers to deal with the volume of data. The proposition integrates the only character of each project (tasks, objectives, decision makers personality and competences), several good practices in terms of universal project management dimensions on the one hand, and in terms of performance analysis on the other hand. Then, we show how an aggregation tool called MACBETH is used to analyze the performance measures according to project managers’ own performance interests. A case study illustrates the proposed system.
Keywords: Project performance; Performance measurement system; Project management; Multiple criteria analysis; Decision support systems
1. Introduction
Decision making in a project context is a complex undertaking! “The term complexity is an increasingly important point of reference when we are trying to understand the managerial demands of modern projects in general, and of the various situations encountered in projects” (Kähkönen, 2008). The definition of complexity has been covered by various contributions and research works but does not form the subject of this study. In summary, complexity can appear in different forms and arise from various sources with different levels of intensity according to the industrial sector or object of the project. Intensities can vary over time, and this variation underlines the dynamic aspect of project complexity. A widely
accepted approach to describe complexity is the distinction between the uncertainty related to the operational activities, or the environment, and the structural complexity related to project organization (management) (Williams, 2002).
On the one hand, a project is a temporary and transient organization surrounded by inherent uncertainty (Turner and Muller, 2003). TheInternational Organization for Standardiza tion (ISO) (2003) defines a project as “a unique process”. In other words, a project is intrinsically unique and strongly subject to its environment (Zwikael et al., 2005).Geraldi (2008) and Geraldi and Adlbrecht (2008) speak of “Complexity of Faith” to describe this kind of project complexity that involves high levels of uncertainty.
On the other hand, the project manager can be confronted with another form of complexity involved in dealing with a large volume of independent information. Geraldi (2008) and Geraldi and Adlbrecht (2008)speak of “complexity of fact” to describe the potentially very great amount of information to analyze and coordinate, linked to the number of people and companies involved.
⁎ Corresponding author.
E-mail addresses:[email protected](G. Marques),
[email protected](D. Gourc),[email protected]
Both practitioners and academics have difficulties accepting and treating projects as complex systems, and tend to reduce the management of projects to the application of tools such as PERT, WBS, earned value, etc. (Geraldi and Adlbrecht, 2008). When complexity becomes too great, the possibilities and interrelations become so fuzzy that the system has to be assisted by appropriate tools and skills. Consequently, managers facing complex project need access to a decision making aid model based on relevant performance evaluation. In this situation modeling plays an important role in project management in supporting “complex” decisions. Modeling is often presented as a simplification of reality (Pidd, 1996) and this simplification is a powerful advantage. This enables us to analyze and come to simplified conclusions about the real world which would be impossible to reach if we had to deal with all the complexity of the real world (Williams, 2002). So, the key purpose of modeling is to help decision makers take a better decision. In a project context, decision making is the point where many management constraints converge from:
senior management: that define general project objectives and success criteria;
the quantity of information stemming from the project execution;
the project manager's own management policy that reflects her/his point of view and the value s/he attributes to each element of information and each objective.
This study is not focused on the objectives definition. For a given project, we suppose they have been defined and adapted to each decisional level (senior managers, project managers, task leaders, etc.). In this paper, we address the problem of modeling project performance in order to support decision making. We face two main questions if we are to achieve this goal: (i) how to build a model that allows a large quantity of information (performance measurements) to be stored and easily available for consultation and/or modification; (ii) which tool or operator to use to analyze data according to decision maker position/perception. For the first question, we propose to design a Project Performance Measurement System (PPMS) that uses good practices from literature in terms of project performance. Then, data from the PPMS cube are analyzed using a tool called MACBETH in order to propose decision aid; that is examined in the second question.
We will start by detailing the scope of the study and the research methodology we used before presenting our problems statement. Second, we will look at the relevant good practices from the literature concerning the main elements to consider for each problem statement we have identified. Third, we will describe our PPMS and the uses made of MACBETH. The proposed system will be implemented using a case study, before finally drawing some conclusions and discussing the limitations and the various perspectives for further research.
2. Scope and research methodology
In the phrase “decision making in a project context”, the term “project” is open to many interpretations. In this study, we pay
particular attention to product and service development projects (we refer to the classification proposed byArchibald (2003)). The proposition described in this article draws on the experience of both practitioners and academics. The model we propose is based on real project management practices in the pharmaceutical and aeronautical industries as well as on academic literature. Our model is focused on a complex project. The notion of complexity is related to the size of project, the number of departments involved, the number and type of stakeholders, the location or the form of contract. Furthermore, it is intended for “mature” project organizations since it requires the organization to be capable of carrying out performance measures and of ensuring circulation of this information within the management process.
Through the management of their projects, project managers have to make decisions. The quality of these decisions depends on the capacity of the decision maker to perform a twin evaluation: (i) the current situation of the project versus the initial objectives What happened until today? and What is the current progression (in a broader sense)? and (ii) the possible evolution of the project according to the decisions and events (past, present and future) What will happen and what are the consequences for the project? Performance evaluation appears as a way to design/ modify a system, or to control an existing system. It is an essential element of effective planning and control as well as decision making (Bagwat and Sharma, 2007). We refer respectively to a priori (i) or a posteriori (ii) evaluations, either to assess the current situation or to assess the quality of possible evolutions. Since knowledge of the current situation is a prerequisite to any prospective approach, in this study we focus on an a posteriori performance evaluation of a particular system, a project.
These performance evaluations constitute the basis of decision making. However, as stated in the Introduction, the decision maker's behavior is another important facet of decision making. In this study we propose supporting decision making by focusing the decision maker's attention on areas of poor performance. The objective consists either in finding the one best solution that respects the perception data, or in comparing different situations that reflect the evaluation sensitivity to the perception data.Nightingale (2008)proposes a dichotomy between the “optimizing” and “skeptical” project managers. Both are compatible with our model but the use is different. Actually, the optimizing project managers will use our model once a time whereas the skeptical project managers who traditionally believe in decision support system where adjust ments during the project are possible, will use our model many times (typically at each milestone).
3. Problems statements and background on project performance
Dweiri and Kablan (2006)claim that standard performance management metrics and tools impact the standard performance management methodology, which in turn influence the project success. So, good project management requires a relevant set of performance metrics. However, it is difficult to define a performance measurement that suits each decision. According toSwink et al. (2006), the effectiveness of a project is the degree
to which the managers of the project make use of techniques which improve the efficiency of project execution. This remark underlines the multi dimensional aspect of performance measurement: a project can be effective and efficient. Managing project involves different kind of performance measurements to make decisions: time or cost progress for each task, resources utilization, etc. There is also the question of the relevance of certain decisions. Our first Problem Statement (PS) is therefore: PS1: What are the different performance measurements that allow a complete analysis of the performance of the project?
Any project performance evaluation supposes the need to analyze the measurements taken. It is a question of considering the impact of each component of a performance. But, which dimension of the performance is relevant? Some authors, such as Xiaoyi Dai and Wells (2004), develop a consensus for determining project failure rather than considering the multiple dimensions for evaluating project performance. The majority of existing project performance tools focus on financial aspects, such as return on investment and profit per unit.Cheung et al. (2004)argued that financial parameters are useful, but there are inadequacies, such as lagging metrics, a lack of strategic focus, and a failure to provide data on quality, relationships and the environment. Barclay and Osei Bryson (2010) propose a Project Performance Development Framework for developing performance criteria and measures for information system projects. Their research is based on the incapacity of the cost time quality iron triangle to sufficiently reflect reality.Lee et al. (2000) emphasize the importance of such variables as the project structure organization, functions integration, key individuals and the competence of project managers. All these points lead to our second problem statement:
PS2: What are the dimensions of project performance needed to obtain a complete overview of the project situation?
Roseneau Milton and Githens (2005) emphasize the trend among project managers to try to circulate a single report between many different recipients. They explain that this is a mistake as senior managers will look for summary status and forecast data, whereas middle managers will look for more specific and tailored information on operational details. They stress the necessity to have a system of Key Performance Indicators (KPIs) which allows visibility of performance at different levels as well as ensuring coherence between these views.Milosevic and Patanakul (2005) or Barclay and Osei Bryson (2010)affirm that measures of project success need to include the diversity of stakeholders’ interests and their varied perception of performance. Each KPI should be examined separately and then in related groups of indicators (Pritchard, 1997). Analysts such as the project manager, task leader or senior manager must simultaneously consider all these factors.
Dweiri and Kablan (2006) note that disparate measurement systems may result in superfluous and incompatible perfor mance measurement frameworks. There is a need for project managers to quantify performance as a whole and to be able to
drill down to different measurements at different levels of detail and time. In other words, production of aggregated indicators adapted to each project's stakeholder decision making seems to be essential to success. Our third problem statement can therefore be formulated as:
PS3: How can project performance measures be aggregated and published to meet different stakeholders’ needs?
This paper suggests an approach that tackles these three problem statements (PS1, PS2 and PS3) in an integrated way. As mentioned earlier, there are several good practices that can support PPMS design regarding the above problems statements. These are discussed in the following.
3.1. Project performance measurement (PS1)
TheInternational Organization for Standardization (ISO) (2003)
defines a project as “a unique process, consisting of a set of coordinated and controlled activities with start and finish dates, undertaken to achieve an objective conforming to specific requirements.” This definition considers projects as business processes. From this standpoint we can associate Project Management with Business Process Management (BPM). Tasks are ordered, and a project can be seen as a sequence of tasks in a similar way to a process which can be seen as a sequence of activities. This allows practices whose origins lie in standard business process Performance Measurement Systems (PMS) to be extended to project management.
A large number of these practices relate to measures needed to capture the relevant characteristics of activities that compose business processes. We can cite the Holistic Process Performance Measurement System, the Integrated Dynamic Performance Measurement System, Earned Value Added, the Fraunhofer approach or, more basically, the Activity Based Costing/Manage ment and the Supply Chain Operations Reference model (Bourne et al., 2003). According to this idea, project tasks should be assimilated to business process activities (International Organiza tion for Standardization (ISO), 2003). Each task can be described accordingly as input(s), output(s), resource(s) and control(s).
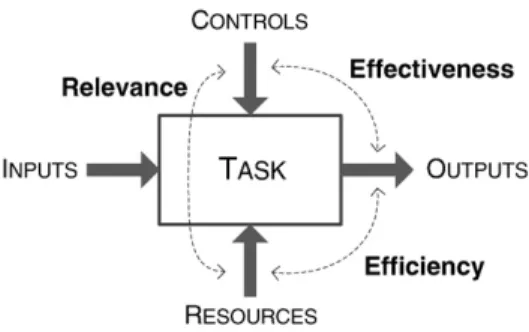
Finally, a Project Performance Management System can be defined as the set of metrics, or performance measures, used to quantify both the efficiency and the effectiveness of actions (Neely et al., 1996). Performance evaluation supposes the need for tools to analyze the measurements taken according to these two dimensions of efficiency and effectiveness. It is a question of considering the impact of each component of the performance. Basically, BPM analysis adds a third component: relevance. Performance analysis could then be made with an approach based on Relevance, Effectiveness and Efficiency (REE) (Jacot, 1990). REE compares the Objectives Results Resources of a business activity (in our case, a project task), and comprises a triptych that aims to describe the activity's performance (see. Fig. 1). Effectiveness measures whether the results of the activity meet the objectives. Efficiency expresses whether the resources were well used to attain the results. Relevance measures the adequacy of the means to the objectives.
3.2. Project performance dimensions (PS2)
The project manager has to maintain the project network and monitor against slippages in cost, time, and quality for the duration of the project (Xiaoyi Dai and Wells, 2004). In achieving this, the project manager heavily counts on a reliable monitoring system that can provide timely signaling of project problems, whether actual or potential. Atkinson (1999), Cooke Davis (2002) or Dweiri and Kablan (2006) show that project management activities using only time, cost or quality measures may fall through the gaps. They explain that using the Iron Triangle (Cost Time Quality) as the criterion of success is not optimal. Particularly,Atkinson (1999)demonstrates that the Iron Triangle is not relevant to control errors which qualify that the task's result is not as good as it could be. Consequently the project performance should be measured through the overall objectives of the project and not only through the widespread and traditional measures of cost, time and quality (Cooke Davis, 2002).
On the other hand, many authors, such as Grey (1995), Pritchard (1997) or Kwak and Laplace (2005)advocate using a risk assessment report to complete a project performance management system. This report provides the information needed to start any action for the correction of potential problems.Chapman and Ward (2004)present risk efficiency as a key aspect of a project's best practice.
Finally, research on project performance shows that it is impossible to generate a universal checklist of project perfor mance criteria. They vary from project to project (Cooke Davis, 2002; Müller and Turner, 2007) and must be different depending on a number of issues, for example size, uniqueness, complexity or the viewpoints (user, stakeholders, engineers, project sponsors, project managers, contractors, etc.). Consequently, areas covered by performance management must be as complete as possible. The Project Management Body of Knowledge (PMI Standards Committee, 1996) proposes nine essential knowledge and management areas to describe project management:
Project Integration: ensure that the various elements of the project are properly coordinated;
Project Scope: ensure that the project includes all the work required to complete the project successfully;
Project Time: ensure timely completion of the project;
Project Cost: ensure that the project is completed according to the approved budget;
Project Quality: ensure that the project will satisfy; Project Human Resource: make the most effective use of the people involved with the project;
Project Communications: ensure timely and appropriate generation, collection, dissemination, storage and ultimate disposition of project information;
Project Risk: identity, analyze and response to project risk; Project Procurement: acquire goods and services outside the performing organization.
According to Westerveld (2003), the PMI's definition of project management is unclear and it is difficult to link areas and project situations. As explained before, the ISO 10006:2003 (International Organization for Standardization (ISO), 2003) standard defines project management as a business process and consequently emphasizes the strong link existing between management behaviors or decisions and the tasks of the Work Breakdown Structure. We could break the project into activities (tasks). We could then apply the PMI's nine knowledge areas to each task. The nine areas appear as nine points of view that we take of the activity being considered. In our case, we could apply this breakdown to tasks which appear in the project WBS. In other words, we can associate nine characters to each task. 3.3. Project performance measures aggregation (PS3)
Korhonen (1992) argues that Decision Making (DM) is to make a choice from a countable set of countable or uncountable alternatives using two or more criteria. Multi Criteria support systems allow us to analyze multiple criteria and incorporate the decision maker's preferences for these criteria into the analysis (Korhonen, 1992). In other words, aggregation models enable us to capture the notion of priorities in the decision maker's strategy (Clivillé et al., 2007). Interval value scores (a crucial part of MCD analysis) are quantitative representations of preferences used to reflect the strength of the decision maker's preferences for one option over another (Bana e Costa and Chagas, 2004). In fact, as
Clivillé (2004)points out, as soon as managers use more than one Key Performance Indicator (KPI), problems of comparison and aggregation of the performance expressions will exist. This is the principal objective of indicator aggregation: to provide an immediate and global overview of the project, interpretable by an entity not conversant with the details of the activities.
Several aggregation methods exist. For more detailed information about these methods we refer to Figueira et al. (2005)who have recently proposed a large survey about multiple criteria decision analysis. To resume, we find three different approaches (called operational approaches byRoy (1996)):
based on a single synthesizing criterion without incompar abilities (operational approach 1). associated methods are weight sum, multi attribute utility theory (maut), MACBETH (measuring attractiveness by a categorical based evaluation technique, Bana e Costa and Chagas (2004)), analytical hierarchy process (ahp), etc. in the project context, for example, Fig. 1. Performance triptych.
Dweiri and Kablan (2006) and Hwang (2004)propose a fuzzy decision making system to quantify a global project manage ment internal efficiency. For his part,Korhonen (1992)presents the notion of multi attribute utility theory (maut) focused on structuring multi criteria or multi attribute alternatives, usually in the presence of risk or uncertainty.Clivillé et al. (2007)use a tool extracted from maut, MACBETH.
based on synthesis by outranking with incomparabilities (operational approach 2). associated methods are ELECTRE (I, II, III, and IV), PROMETHE (I and II), etc.
based on interactive local judgments with trial and error iterations (operational approach 3).
4. Towards a multi-criteria project performance measurement system
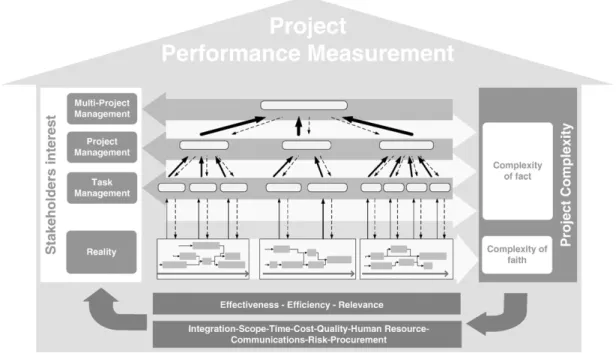
According to a previous part the Project Performance Measurement System design has to allow project complexity to be reported to the stakeholders (PS1 and PS2) and their interests to be integrated (PS3). These two objectives can be situated inFig. 2: the link from right to left between project complexity and stakeholder's interest mainstays (PS1 and PS2), and the different levels inside the stakeholder's interest mainstay (PS3).
4.1. System overview
The idea consists of building a decision support method for different project contexts. This method has to be adaptable to decision makers’ needs, in terms of:
task(s) to follow;
project performance measurement to use; project performance dimensions to observe.
Our model is composed of three dimensions: the tasks followed; the view used to analyze their performance (characters), and the type of performance measurement (elements of the triptych).
Concerning the nine characters that we propose for analysis of each task's performance, we should underline that indepen dence between each character is not total. However, the aim is not to produce a single reductionist evaluation of the project, but to control it. If our evaluation is exclusively time and/or cost centered, we cannot immediately know the origin of a deviation in the performance level. Having a complete vision of all aspects of the project allows faster and better targeted corrective actions. In the particular case of resource leveraging,Martinez et al. (1997)explain that this demands a global vision of the different alternatives to make milestones both feasible and nearly optimal from the performance standpoint.
4.2. A cube as a system to centralize measures and dimensions 4.2.1. Principle of organization
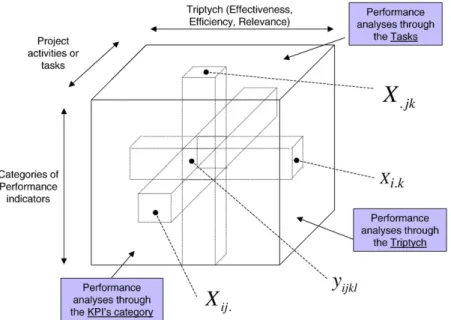
All the performance measures of a project can be arranged into a cube defined by the three dimensions, as cited above (inspired by Lauras and Gourc (2007)). A cell of this cube includes the KPIs of a given project activity (task), considering a given character (knowledge area), and following one point of view of the Effectiveness Efficiency Relevance triptych (Fig. 3). As an example, we can consider a cell that corresponds to the task “Design product A”, considering the “Time” character and with the “Effectiveness” point of view.
4.2.2. Access to measures
Each project task can be modeled as an activity with its inputs, outputs, resources and controls. These tasks represent
the operational and support processes of a project. We associate a set of measurements to each one. In order to ensure that this data will be easily available for consultation and/or modification, we introduce functions based on the notations below. Let,
D, the set of project review dates. There are R review dates during the project. One review date, t, belongs to D = [1; R]
(R∈ℕ⁎)
C, the set of characters (time, cost, etc.). We can analyze the performance of 1 to m characters. One character, i, belongs to C = [1; m] (m∈ℕ⁎)
T, the set of tasks. There are n tracked tasks in the project. One task, k, belongs to T = [1; n] (n∈ℕ⁎)
i = Characters, [1; m] (m≤9) (m=number of characters) j = Elements of triptych, [1,2,3] (for Eft, Efc, Rvc)
k = project activities or tasks [1; n] (n = number of tasks) l = number of the value of the elementary component of a KPI [0; Lkij] (Lkij∈ℕ)
yijkl= measure associated to an elementary component of a
KPI
X be a KPI on a cube's face
At a given t∈D, we can analyze the task k∈T with the character i∈C:
D × T × C→KPI
dateðtÞ; taskðkÞ; characterðiÞ↦Sðt; k; iÞ = E! ft; Efc; Rvc" Effectiveness (Eft), Efficiency (Efc), and Relevance (Rvc) are
not obligatory quantitative values. They could be qualitative or even equal to an empty set. Another function Extcan be defined.
This allows one particular element to be extracted from the triptych: KPI × 1; 2; 3f g→E Sðt; k; iÞ × j↦ExtðS; jÞ = ( Eft if j = 1 Efc if j = 2 Rvc if j = 3
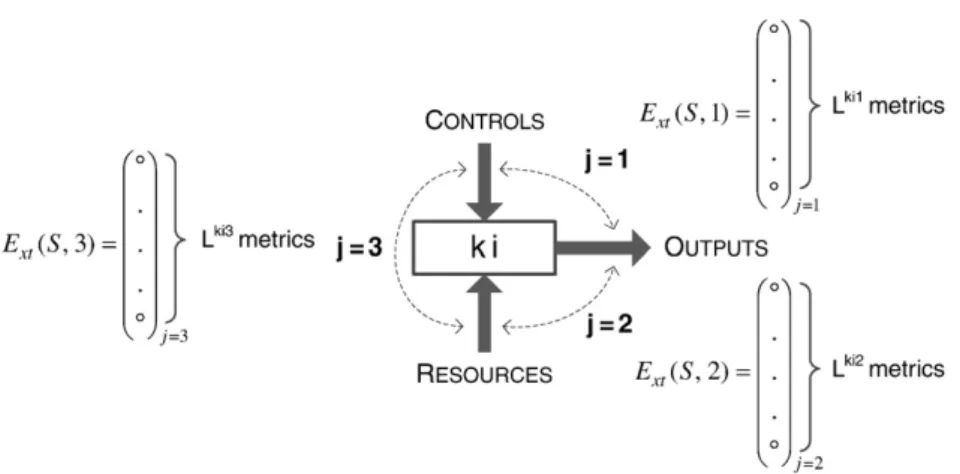
The task ki is then observed using the three views of the triptych {Relevance; Effectiveness; Efficiency}. For one j, i.e. one view (j∈[1; 2; 3]), the manager defines 0 to Lkijmetrics to
measure the performance. Lkijis a parameter previously defined
for all kij. For each j, i.e., each view of the triptych, we have a vector with Lkij× 1 dimension. This is summarized inFig. 4.
E × Ν→L
ExtðS; jÞ; l↦ElxtðS; jÞ
One KPI is defined by the triptych {Effectiveness; Efficiency; Relevance}. According to the way that each view of triptych is built, one KPI will not be a 1 × 3 dimension matrix but a Max Lkij× 3 dimension matrix.
4.2.3. Commensurability and meaningfulness
Each KPI has its own metrics and measures. But we have to consider the commensurability and the meaningfulness of each of them. Performance expressions should ideally be defined without any dimension (units) to ensure commensurability. The calculated values are standardized in order to be comparable. This point is an important assumption of our research work. Our proposition just can give guidelines to support project manager's decision making and cannot substitute to human interpretation or judgement. Actually, the variation of utility of
the different performance criteria of a project can be very large and not necessary rational.
4.3. Analysis… looks into the cube
As explained above, the objective consists in supporting decision makers in terms of project performance control. To achieve this, we stress the need to produce different analysis reports that include different points of view and levels of granularity. The multi dimensional property of the model allows this.
KPIs can be aggregated from different angles. In fact, each project stakeholder should be able to interpret the model from her/his point of view. Consequently, aggregation methodology must be adapted to the different actors’ points of view. According to previously cited constraints, we have constructed three ways of aggregating the values (Fig. 5)
task oriented;
character oriented (ninePMI areas); triptych oriented (Eft, Efc, Rvc).
T1,…, Tn are project tasks. C1,…, C9 are the nine characters.
Table 1shows that these three aggregation orientations are not of equal interest to all project members.
4.4. KPI weighting to analyze
We have an indicator set for each task. For each of these, measurements are taken as the project progresses. To facilitate management, we suggest first computing mean values of these measures. They can be compared and alarm levels can be defined. If we take a non linear aggregation operator, we only obtain a relative comparison between values (and not an absolute comparison). Since the physical direction of aggregate values is important for project managers, we propose using a simple means operator where the:
mean project activity indicator is the mean value of all the categories of indicators of a project activity for a given component of the performance triptych. This allows definition of the visible face of the cube that aggregates all the categories of measures for a given project activity or task: cf. formula(1);
mean indicator type is the mean value of all the activities of this type of indicator for a given component of the performance triptych. This allows definition of the visible face of the cube that aggregates all the measures for a given category of performance indicator (cost, time, risk, quality, etc.): cf. formula(2);
mean performance view is the mean value of all views of the performance triptych for a given task and a given type of indicator (character). This allows definition of the visible face of the cube that aggregates all the measures for a given view of the performance triptych: cf. formula(3).
Fig. 4. Project task model.
Fig. 5. Aggregation tree structures.
Table 1
Intended aggregation models. Orientation Intended for
Task leader Project manager Senior manager
Task + ++ −
Character + ++ +
Xij: = ∑ k ∑ Lkij l 1yijkl ∑ k L kij ð1Þ X:jk = ∑ i ∑ Lkij l 1yijkl ∑ i L kij ð2Þ Xi:k = ∑ j ∑ Lkij l 1yijkl ∑ j L kij ð3Þ
However, the implementation of one of the aggregation methods is subject to constraints. It should be noted that some limits appear on the aggregation criteria of the individual measures. Indeed, all project tasks and, reciprocally, all categories of KPI have the same weight in the final result. It is obvious that a project manager will lend more or less importance to such a task as a function of the aims of the global project or according to her/his own personal preferences.
Roy (1996)argues that the choice of aggregation approach is often difficult and we have no theoretical rules that allow the aggregation approach to be selected. Outranking and interactive approaches (Operational Approaches 2 and 3) are more recent, and are thus less explored and less common in the real world. Furthermore, outranking methods do not always allow discrimination in the set of possible action. Even if the fault of a single criterion approach is the difficulty in validating the choice of the aggregation operator, in this study we seek to propose an ordered list of possible actions without incompar abilities. For example, how can a project manager concentrate resources on one task rather than another if s/he is not able to compare the performance? Furthermore, implementing out ranking methods requires more expert intervention and if the quantity of required information is often stressed when describing the difficulties in applying a single criterion approach, in a project context, information is available. Consequently, we restrict ourselves to an Operational Approach 1, i.e. the approach based on a single synthesizing criterion.
As shown above, the mean value does not allow the complexity of decision maker's points of view to be integrated. AHP method could be better in this regard, but a coherence problem between the scales of criteria could appear because of the structure of the preference scale. The ratio scale used in AHP could be manipulated with more difficulties in the context of project management. Consequently, we prefer methods based on the interval scale to express decision maker's opinions. Furthermore, we want to achieve greater relevance by weighting each elementary criterion. But, in a complex project (with many tasks and categories of indicators) it is quite difficult to quantify the exact weight of each category of performance indicator or the exact weight of each project task. With the orientations previously defined, we have:
task oriented: 9 × 3 = 27 criteria to compare;
character oriented: T × 3 criteria to compare, where T is the number of tasks;
triptych oriented: T × 9 criteria to compare.
It is increasingly difficult to attribute a weight to each criterion. In fact, it is proportional to the project complexity. However, when it is difficult to evaluate one object among a large quantity, it could be easier to evaluate the relative position between two of them. Furthermore, it could be very difficult to quantitatively express this difference.
MACBETH proposes a solution for these two sources of difficulties. It allows a qualitative two by two comparison through a non numerical interactive questioning procedure that compares two stimuli at the same time, requesting only a qualitative judgment about their difference of attractiveness (Bana e Costa and Chagas, 2004). As the answers are given, the consistency is verified, and a numerical scale that is representative of the decision maker's judgments is subse quently generated and discussed. An overview and some applications of MACBETH are presented, for instance, inBana e Costa and Chagas (2004), Roubens et al. (2006), and onwww. m macbeth.com. We therefore intend using a MACBETH approach to weight the aggregation process. It is important to remark here that the MACBETH procedure is light enough to be executed several times during the project (in case of necessity,
for example if the project manager has to add some tasks, characters or indicators to his project).
5. Case study: a project for the manufacture of landing gear doors
In this section, we suggest implementation of our cube proposition by controlling the performance of a product development project. Let us consider a 2nd tier supplier to the aeronautics sector. This supplier produces composite equipment for aircraft manufacturers. The project examined deals with study and industrialization phases of new composite landing gear doors.
5.1. The need
Fig. 6shows project KPIs and their values at a given review date (D6). This figure shows how difficult it is to identify clear trends and, therefore, to define improvement decisions. The most problematic tasks are quite hard to identify.
The target is to supply the decision maker with the best and more accurate information to decide on the corrective action. 5.2. Choice of tasks followed
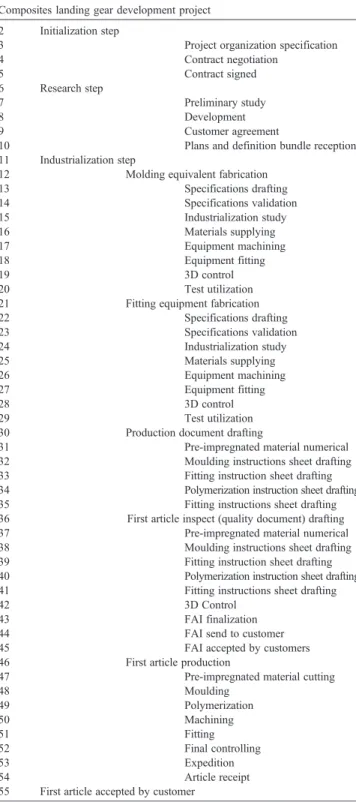
We use the Work Breakdown Structure (Table 2) to identify the project tasks. This allows us to deduce the useful dimensions of the cube. Here, they are numbered from 1 to 55. The numbering does not differentiate between simple and summary tasks. Without these summary tasks we have 45 tasks. Concerning the knowledge areas, we have chosen to focus the project performance analysis only on the Time, Cost, Quality and Risk dimensions. The three performance analysis axes have been retained. In addition, ten review dates are programmed, labeled D1,…, D10. We have monitored this project in its entirety. However, due to space restrictions we have only developed a performance analysis for review date D6. Using the letter notation cited above, the parameters of the cube are for this project: n = 45; m = 4; R = 10.
5.3. Metrics design
When the project manager establishes project dashboards, s/he has to design the project KPIs. The problem here is how to define coherent KPIs for the project. The performance analysis triptych dimensions can be used to guide this step. Because effectiveness compares levels of results against objectives, the effectiveness component of KPIs could express a notion of “achievement progress”. Because efficiency expresses resources bonding to achieve the task, the efficiency component of KPIs could be associated with the “using rate” dimension. Finally, because relevance expresses appropriateness between targets and dedi cated resources, “re estimation level” notions could constitute an appropriate dimension to define the relevance KPIs.
5.4. KPI weighting
This step is dedicated to the representation of the stakeholders’ point of view through different value scales. A first scale for each performance measure allows translation of possible values into preferences. Then, a second scale, allows priority between dimensions to be established.
Table 2
WBS for the landing gear door project. Composites landing gear development project 2 Initialization step
3 Project organization specification
4 Contract negotiation 5 Contract signed 6 Research step 7 Preliminary study 8 Development 9 Customer agreement
10 Plans and definition bundle reception
11 Industrialization step
12 Molding equivalent fabrication
13 Specifications drafting 14 Specifications validation 15 Industrialization study 16 Materials supplying 17 Equipment machining 18 Equipment fitting 19 3D control 20 Test utilization
21 Fitting equipment fabrication
22 Specifications drafting 23 Specifications validation 24 Industrialization study 25 Materials supplying 26 Equipment machining 27 Equipment fitting 28 3D control 29 Test utilization
30 Production document drafting
31 Pre-impregnated material numerical
32 Moulding instructions sheet drafting
33 Fitting instruction sheet drafting
34 Polymerization instruction sheet drafting
35 Fitting instructions sheet drafting
36 First article inspect (quality document) drafting
37 Pre-impregnated material numerical
38 Moulding instructions sheet drafting
39 Fitting instruction sheet drafting
40 Polymerization instruction sheet drafting
41 Fitting instructions sheet drafting
42 3D Control
43 FAI finalization
44 FAI send to customer
45 FAI accepted by customers
46 First article production
47 Pre-impregnated material cutting
48 Moulding 49 Polymerization 50 Machining 51 Fitting 52 Final controlling 53 Expedition 54 Article receipt
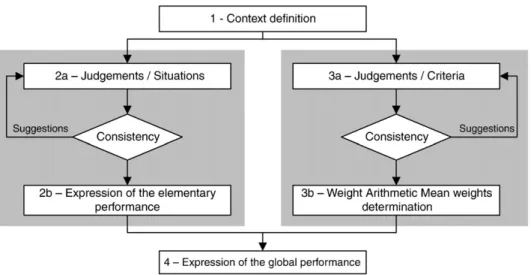
According to the four main steps of the MACBETH procedure, described by Clivillé et al. (2007) (Fig. 7), we begin by identifying criteria and options. Criteria and options defined in MACBETH differ according to the orientation of the study. Table 3 summarizes this difference using the letter notation cited above:
We shall now continue with an explanation of the task oriented case. Results will only be given for the character and triptych orientations.
The target is to compare many options according to the criteria we have defined. At a given t, we identify some tasks which the project manager wants to analyze in order to highlight particular parts of the project which are in difficulty. We introduce these n tasks into the MACBETH software. We then create the value tree (Fig. 8) in which we identify our criteria, i.e. the i j character pairing and triptych views. To be effective, this MACBETH procedure has to be reapplied several times during the project and particularly at each milestone.
As previously stated, values associated to the criteria could be quantitative or qualitative. Furthermore, we seek to aggregate these criteria in order to obtain a ranking for the options. MACBETH therefore starts by creating a value scale for each criterion. The principle is to translate human expertise concerning given situations into quantified elementary perfor mance expressions along an interval scale (Clivillé et al., 2007). A criteria, r, could have many values; these different possibilities are different situations: S1, S2,…, Sv (v∈ℕ⁎).
MACBETH introduces the notion of the degree of strength of
attractiveness between two situations denoted by h; h can take seven values, from 0 for no strength, to 6 for extreme strength. Decision makers provide preferences for each consideration criterion r in the form:
s/he prefers the situation S1to S2with a strength h: S1≻hS2
S1and S2are equivalent: S1≈S2
In Fig. 9, below, which illustrates the decision maker's preference expression for time effectiveness, we compare the main values which could be taken by the KPI. Thanks to a value scale (from “no” to “extreme” difference), the decision maker qualitatively evaluates the difference s/he allocates to each of them.
Fig. 7. MACBETH procedure. (fromClivillé et al., 2007).
Table 3
MACBETH design. Orientation of the analysis
Options Criteria (r) Number of
criteria
Task Task (k) i j m × 3
Character Character (i) k j n × 3
MACBETH translates these relationships into a system of independent equations. It then resolves them and calculates the aggregation using the Choquet integral. An interrogation procedure occurs to validate the consistency of the matrix of qualitative judgments. On this basis, MACBETH creates a numerical scale for each criterion that explains the relative magnitude of the decision maker's judgments.
In line with senior management's performance strategy, we have to determine the respective weight to accord each project performance criteria. We compare one criterion to the other according to the same methodology used to treat values for each measure. By implementing the judgment matrix we indicate existing subordinations that could or should exist between KPIs. A ranking of KPI Categories is then established; information is purely ordinal at this stage. The solutions are then compared on a pair by pair basis for each criterion. Two fictional alternatives are introduced into the comparison process, providing the reference values corresponding to the two extreme degrees of performance (Lauras and Gourc, 2007). The comparison then consists in quantifying the difference of performance degree for
each criterion. The resulting set of constraints defines a linear programming problem. The solution to this problem provides the cardinal scale of performance associated with a criterion. This step is repeated for each criterion; Fig. 7 illustrates this process. The project manager compares all criteria on a pair by pair basis. In our example, Delay Effectiveness and Cost Effectiveness KPIs appear as the most important criteria, whereas Quality Relevance is the least important (Fig. 10). 5.5. Performance analysis
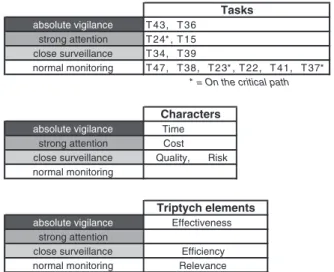
Finally, we obtained the results presented inFig. 11. We can clearly identify which tasks need corrective actions. In this case, tasks 37, 41, 22, 23, 38 and 47 are on track result. Conversely, tasks 43 and 36 have the worst results. Using this information, the project manager would be correct to give top priority to tasks 43 and 36. S/he knows immediately which task is not keeping to predetermined objectives, and so which task leader must be alerted. This classification could also be of help in making decisions about the distribution of additional resources. Furthermore, the project manager has all the data inside the cube Fig. 9. Example of decision-maker's preference expression for a given criterion.
Fig. 10. KPI's relative weight.
absolute vigilance strong attention close surveillance normal monitoring T43, T36 T24* , T15 T34, T39 T47, T38, T23* , T22, T41, T37* Tasks
* = On the critical path
absolute vigilance strong attention
close surveillance Risk normal monitoring Time Cost Quality, Characters absolute vigilance strong attention close surveillance normal monitoring Efficiency Relevance Triptych elements Effectiveness
Fig. 11. Performance aggregated assessment for task, character and triptych orientations.
in order to identify which task character is deficient.
We develop the same approach with KPI categories as options, we can explain which project dimension was particularly deficient (Cost, Quality, Time or Risk), and adapt the decision making process as a result. The project manager has to pay particular attention to time management. A third analysis could consist in aggregating the project performance according to the performance analysis triptych in order to give the improvements a more precise orientation. Through this last analysis, we can envisage detecting trends in the project tending to define eccentric task objectives (Effectiveness) as shown in
Fig. 11, use resources improperly (Efficiency) or allocate insufficient or oversized means (Relevance).
Thus, cross comparison of these three analyses will allow relevant improvement actions to be taken. Finally, we are able to drill down measurements at different levels of detail and time on the one hand, and at different dimensions on the other.
Note also that MACBETH allows robustness and sensitivity analyses to be performed. It well underlines the weight of the decision maker's preferences and constraints on the perfor mance assessment. The final task order will be different. depending on the strength associated with Time Effectiveness. In other words, we will not accord it the same priority and corrective actions will not be the same.
6. Conclusion and future works
Today, project decision makers have to take into account a large amount of variables in their activities. Measuring then evaluating the project progression in all its aspects helps managers to make their decisions. But, in several contexts this evaluation is characterized by the complexity of information, the actors involved and their interrelations.
Basically, project performance reports are based on working level data but are intended to provide an overview of current trends and status. Project status is a snapshot of “where you are now” compared to “where you should be”. Status variation is the gap between actual performance and baseline. The final answer to initially expressed goals is certainly essential, but analysis of the path followed and the choices made are important if we are to be sure of reaching, or at least moving closer to, these goals.
Consequently, we have proposed a multi dimensional PPMS, which integrates the unique character of each project (tasks, objectives, decision makers personality and compe tences), several good practices in terms of universal project management dimensions on the one hand, and in terms of performance analysis on the other hand. By making the assumption of one dimensional utility and using MACBETH techniques our proposition allows to give principal guidance's to project manager to make decisions at each step of project management. This performance analysis can be reapplied as soon as required. The case study illustrates that using our model and MACBETH means that decision makers avoid being swamped in a mass of irrelevant details and information. The information is chosen according to the decision maker's interests and preferences.
However, the case study presented shows that the project has to be of major scope and sufficiently well structured to be of interest when using this method. In addition, we could improve the use of the sensitivity analysis offered by MACBETH. The concrete measures of performance can be attenuated or increased by the sensitivity of the decision maker. In other terms, the “subjectivity” of the model would have been measured and used to support decisions made by “skeptical” project managers. It involves a multi run utilization of the method.
Furthermore, many perspectives arise directly from this work. The four main areas of study that we could explore center on:
the robustness of using MACBETH, especially in projects with many tasks and dimensions to manage;
the impact of performance indicator interdependencies on the proposition;
links between research into project classification and choices for relative KPI weighting;
the possibility of cross aggregated analysis oriented in pairs could be studied. It could be relevant for several functions, such as Risk Manager or Financial Director.
To finish, we would like to add one final perspective. Performance control is a repetitive, cyclic, process (Navon, 2007). It starts with measurement of the actual performance of the project, i.e. determining the progress, measuring the costs engaged, etc. The actual performance is compared to the desired one. When a deviation is detected, the management team analyzes the reasons for it. Initially, the desired performance is the planned one. But, as the project progresses, planned performance may be updated and changed to reflect any decisions taken and/or events that occur. This approach is called adaptive control. Today, the scope of the proposed PPMS is limited to this step (an a posteriori performance evaluation). However, the last step of performance control is the implementation of corrective actions (Navon, 2007). The literature offers several methods for forecasting final project cost, based on actual cost performance at intermediate points in time (Hyväri, 2006). Earned Value, for example, is a quantitative approach to evaluating the true performance of a project both in terms of cost deviation and schedule deviation. Other methods allow forecasts of project status in terms of quality or time (Hyväri, 2006). However, we did not find any references that simultaneously attempt to forecast project outputs for all the dimensions (especially for cost, time and quality). Development could therefore be envisaged as a tool to forecast the global position (considering all dimensions: cost, time and quality factors at a minimum) of a project at the next period. This final prospect clearly points to an evolution of our work towards an a priori project performance evaluation. References
Archibald, R.D., 2003. Managing high-technology programs and projects. John Wiley & Sons.
Atkinson, R., 1999. Project management: cost, time and quality, two best guesses and a phenomenon, its time to accept other success criteria. International Journal of Project Management 17 (6), 337 342.
Bagwat, R., Sharma, M.K., 2007. Performance measurement of supply chain management: a balanced scorecard approach. Computers & Industrial Engineering 53, 43 62.
Bana e Costa, C.A., Chagas, P.M., 2004. A career choice problem: an example of how to use MACBETH to build a quantitative value model based on qualitative value judgments. European Journal of Operation Research, 153, pp. 323 331.
Barclay, C., Osei-Bryson, K.M., 2010. Project performance development framework: an approach for developing performance criteria & measures for information systems (IS) projects. International Journal of Production Economics 124, 272 292.
Bourne, M., Neely, A., Mills, J., Platts, K., 2003. Implementing performance measurement systems literature review. International Journal of Business Performance Management 5 (1), 1 24.
Chapman, C., Ward, S., 2004. Why risk efficiency is a key aspect of best practice projects. International Journal of Project Management 22, 619 632. Cheung, S.O., Suen Henry, C.H., Cheung, K.W., 2004. PPMS: a web based construction project performance monitoring system. Automation in construction, 13, pp. 361 376.
Clivillé, V., 2004. Approche systémique et méthode multicritère pour la définition d'un système d'indicateurs de performance. PhD Thesis, Université de Savoie.
Clivillé, V., Berrah, L., Mauris, G., 2007. Quantitative expression and aggregation of performance measurements based on the MACBETH multi-criteria method. International Journal of Production Economics 105, 171 189.
Cooke-Davis, T., 2002. The “real” success factors on projects. International Journal of Project Management 20 (3), 185 190.
Dweiri, F.T., Kablan, M.M., 2006. Using fuzzy decision-making for the evaluation of the project management internal efficiency. Decision Support System 42 (2), 712 726.
Figueira, J., Greco, S., Ehrgott, M., 2005. Multiple Criteria Decision Analysis: State of the Art Surveys. Springer. 1045 pp.
Geraldi, J., 2008. The thermometer of complexity. Project Perspectives, the annual publication of International Management Association, pp. 4 9. Geraldi, J., Adlbrecht, G., 2008. On faith, fact, and interaction in projects. IEEE
Engineering Management Review 36 (2), 35 49.
Grey, S., 1995. Practical risk assessment for project management. John Wiley & Sons Editor.
Hwang, H.S., 2004. Web-based multi-attribute analysis model for engineering project evaluation. Computers & Industrial Engineering 46, 669 678. Hyväri, I., 2006. Project management effectiveness in project oriented business
organizations. International Journal of Project Management 24 (3), 216 225.
International Organization for Standardization (ISO), 2003. ISO 10006:2003 standard: Quality management systems - Guidelines for quality management in projects.
Jacot, J.H., 1990. A propos de l'évaluation économique des systèmes intégrés de production, ECOSIP Gestion industrielle et mesure économique, Economica.
Kähkönen, K., 2008. Level of complexity in projects and its impacts on managerial solutions. Project Perspectives, the annual publication of International Management Association: Editorial, 3.
Korhonen, P., 1992. Multiple criteria decision support a review. European Journal of Operational Research 63, 361 375.
Kwak, Y.H., Laplace, K.S., 2005. Examining risk tolerance in project-driven organization. Technovation 25, 691 695.
Lauras, M., Gourc, D., 2007. A multi-criteria approach to a more effective management of projects. International Conference on Industrial Engineering and Systems Management; IESM; May 30 June 2, Beijing.
Lee, J., Lee, J., Souder, W.E., 2000. Differences of organizational characteristics in new product development: cross-cultural comparison of Korea and the US. Technovation 20, 497 508.
Martinez, E.C., Duje, D., Perez, A., 1997. On performance modeling of project-oriented production. Computers & Industrial Engineering 32, 509 527. Milosevic, D., Patanakul, P., 2005. Standardized project management may
increase development project success. International Journal of Project Management 23, 181 192.
Müller, R., Turner, R., 2007. The influence of project managers on project success criteria and project success by type of project. European Management Journal 25 (4), 582 594.
Navon, R., 2007. Research in automated measurement of project performance indicators. Automation in Construction 16 (2), 176 188.
Neely, A.D., Mills, J., Platts, K., Gregory, M., Richards, H., 1996. Performance measurement system design: should process based approach be adopted? International Journal of Production Economics 46 47, 423 431. Nightingale, P., 2008. Meta-paradigm change and the theory of a firm. Industrial
and Corporate Change, 17, pp. 533 583.
Pidd, M., 1996. Five simple principles of modelling. Simulation Conference, 1996. Proceedings, pp. 721 728. Winter.
PMI Standards Committee, 1996. A Guide to the Project Management Body of Knowledge. PMI Publishing Division.
Pritchard, C.L., 1997. Risk Management: Concepts and Guidance. ESI International Editor.
Roseneau Milton, D., Githens, G.D., 2005. Successful project management: a step by step approach with practical examples4th edition. John Wiley & Sons Editor.
Roubens, M., Rusinowska, A., de Swart, H., 2006. Using MACBETH to determine utilities of governments to parties in coalition formation. European Journal of Operation Research 172 (2), 588 603.
Roy, B., 1996. Multicriteria Methodology for Decision Analysis. Kluwer Academic Publishers.
Swink, M., Talluri, S., Pandejpong, T., 2006. Faster, better, cheaper: a study of NPD project efficiency and performance tradeoffs. Journal of Operations Management 24 (5), 542 562.
Turner, J.R., Muller, R., 2003. On the nature of the project as a temporary organization. International Journal of Project Management 21, 1 8. Westerveld, E., 2003. The project excellence model: linking success criteria and
critical success factors. International Journal of Project Management 21, 411 418.
Williams, T., 2002. Modelling complex project. John Wiley & Sons. Xiaoyi Dai, C., Wells, W.G., 2004. An exploration of project management
office features and their relationship to project performance. International Journal of Project Management 22, 523 532.
Zwikael, O., Shimizu, K., Globerson, S., 2005. Cultural differences in project management capabilities: a field study. International Journal of Project Management 23, 454 462.