HAL Id: hal-02346764
https://hal.archives-ouvertes.fr/hal-02346764
Submitted on 29 May 2020
HAL is a multi-disciplinary open access
archive for the deposit and dissemination of
sci-entific research documents, whether they are
pub-lished or not. The documents may come from
teaching and research institutions in France or
abroad, or from public or private research centers.
L’archive ouverte pluridisciplinaire HAL, est
destinée au dépôt et à la diffusion de documents
scientifiques de niveau recherche, publiés ou non,
émanant des établissements d’enseignement et de
recherche français ou étrangers, des laboratoires
publics ou privés.
Lucie Blaszczyk, Marlène Maitre, Thierry Leste-Lasserre, Samantha Clark,
Daniela Cota, Stéphane Oliet, Valérie Fénelon
To cite this version:
Lucie Blaszczyk, Marlène Maitre, Thierry Leste-Lasserre, Samantha Clark, Daniela Cota, et al..
Se-quential alteration of microglia and astrocytes in the rat thalamus following spinal nerve ligation.
Journal of Neuroinflammation, BioMed Central, 2018, 15 (1), pp.349. �10.1186/s12974-018-1378-z�.
�hal-02346764�
R E S E A R C H
Open Access
Sequential alteration of microglia and
astrocytes in the rat thalamus following
spinal nerve ligation
Lucie Blaszczyk
1,2, Marlène Maître
1,2, Thierry Lesté-Lasserre
1,2, Samantha Clark
1,2, Daniela Cota
1,2,
Stéphane H. R. Oliet
1,2and Valérie S. Fénelon
1,2*Abstract
Background: Spinal reactive astrocytes and microglia are known to participate to the initiation and maintenance of neuropathic pain. However, whether reactive astrocytes and microglia in thalamic nuclei that process sensory-discriminative aspects of pain play a role in pain behavior remains poorly investigated. Therefore, the present study evaluated whether the presence of reactive glia (hypertrophy, increased number and upregulation of glial markers) in the ventral posterolateral thalamic nucleus (VPL) correlates with pain symptoms, 14 and 28 days after unilateral L5/L6 spinal nerve ligation (SNL) in rats.
Methods: Mechanical allodynia and hyperalgesia (von Frey filament stimulation) as well as ambulatory pain (dynamic weight bearing apparatus) were assessed. Levels of nine glial transcripts were determined by quantitative real-time PCR on laser microdissected thalamic nuclei, and levels of proteins were assessed by Western blot. We also studied by immunohistofluorescence the expression of glial markers that label processes (GFAP for astrocytes and iba-1 for microglia) and cell body (S100β for astrocytes and iba-1 for microglia) and quantified the immunostained surface and the number of astrocytes and microglia (conventional counts and optical dissector method of stereological counting).
Results: Differential, time-dependent responses were observed concerning microglia and astrocytes. Specifically, at day 14, iba-1 immunostained area and number of iba-1 immunopositive cells were decreased in the VPL of SNL as compared to naïve rats. By contrast, at day 28, GFAP-immunostained area was increased in the VPL of SNL as compared to naïve rats while number of GFAP/S100β immunopositive cells remained unchanged. Using quantitative real-time PCR of laser microdissected VPL, we found a sequential increase in mRNA expression of cathepsin S (day 14), fractalkine (day 28), and fractalkine receptor (day 14), three well-known markers of microglial reactivity. Using Western blot, we confirmed an increase in protein expression of fractalkine receptor at day 14. Conclusions: Our results demonstrate a sequential alteration of microglia and astrocytes in the thalamus of animals with lesioned peripheral nerves. Furthermore, our data report unprecedented concomitant molecular signs of microglial activation and morphological signs of microglial decline in the thalamus of these animals. Keywords: Neuropathic pain, Ventral posterolateral thalamic nucleus, Intralaminar thalamic nuclei, Mediodorsal thalamic nucleus, GFAP, S100beta, Iba-1, Astrocytes, Microglia
* Correspondence:valerie.fenelon@inserm.fr
1Bordeaux University, Bordeaux, France 2
Neurocentre Magendie, INSERM U1215, Bordeaux, France
© The Author(s). 2018 Open Access This article is distributed under the terms of the Creative Commons Attribution 4.0 International License (http://creativecommons.org/licenses/by/4.0/), which permits unrestricted use, distribution, and reproduction in any medium, provided you give appropriate credit to the original author(s) and the source, provide a link to the Creative Commons license, and indicate if changes were made. The Creative Commons Public Domain Dedication waiver (http://creativecommons.org/publicdomain/zero/1.0/) applies to the data made available in this article, unless otherwise stated.
Background
Neuropathic pain arises as a direct consequence of a lesion
or disease affecting the somatosensory system [1]. Several
mechanisms underlying neuropathic pain have been pro-posed. Among these, the implication of spinal glial cells in the peripheral neuropathic pain has been increasingly and consistently brought into focus. Spinal glial cells display changes in their morphology and their molecular reper-toire following a peripheral nerve injury. Indeed, astrocytes become hypertrophied (more numerous and thicker pro-cesses as well as an enlarged cell body) with an increased expression of glial acidic fibrillary protein (GFAP) and
S100β for instance [2–10] while microglial cells become
hypertrophied and have increased ionized calcium binding
adaptor molecule 1 (iba-1) expression [7, 11–13]. Under
these morphological changes, astrocytes and microglia have been referred to as reactive or activated. In addition, astrocytes and microglia also release several inflammatory
mediators [14,15] that, in turn, increase spinal nociceptive
neurons excitability while reinforcing glial activation, thereby contributing to neuronal sensitization and behav-ioral hypersensitivity observed in neuropathic pain. Activa-tion of spinal microglia seems to precede activaActiva-tion of
spinal astrocytes in peripheral neuropathic pain model [7,
16, 17]. Furthermore, microglia and astrocytes seem to
play different roles in neuropathic pain. In fact, spinal microglia have been implicated in the initiation phase of
peripheral nerve injury-induced pain [18–21]. Conversely,
spinal astrocytes play a role in the maintenance of
periph-eral nerve injury-induced pain symptoms [10,22].
The spinothalamic tract conveys information from spinal nociceptive neurons to higher order neurons in the contralateral ventral posterolateral thalamic nucleus (VPL), which is involved in sensory-discriminative
aspects of pain processing [23], but also in the
medio-dorsal thalamic nucleus (MD) and the group of intrala-minar thalamic nuclei (IM), which are important in processing affective components of pain. It has been shown that chronic constriction injury (CCI) of the sciatic nerve in rats induces 10 days later an alteration in the Nav1.3 sodium channel mRNA expression within VPL neurons contributing to increased excitability of
VPL neurons and to neuropathic pain [24]. In the same
pain model, microglial activation was found in the VPL and injection into the VPL of a microglial inhibitor was
able to transiently abrogate pain symptoms [25].
How-ever, although VPL neurons sensitize to mechanical stimuli in a well-established peripheral neuropathic pain model in rodents, the spinal nerve ligation (SNL)
model [26], nothing is known about a possible
involve-ment of thalamic glial cells in this sensitization. There-fore, we designed this study in order to explore a possible activation of astrocytes and microglia in thal-amic nuclei involved in pain processing using the SNL
model. Mechanical allodynia and hyperalgesia as well as ambulatory pain were assessed. We explored mRNA levels of up to nine genes of structural and functional glial markers in microdissected thalamic nuclei by using quantitative real-time PCR. We tested whether changes in mRNA were also found at the protein level by using Western blot. We also studied by immunohis-tofluorescence the expression of some astrocytic and microglial markers so to reveal potential glial activa-tion. We aimed at determining whether glial cells were hypertrophied and whether the number of glial cells was altered. Therefore, we used glial markers that label processes (GFAP for astrocytes and iba-1 for microglia)
and cell body (S100β for astrocytes and iba-1 for
micro-glia). These studies were done at two time points after the surgery (day 14 and day 28), to evaluate a possible sequential activation of microglia and astrocytes, as already observed at the spinal cord level.
Materials and methods
Animals and study design
All experiments followed the ethical guidelines of the International Association for the Study of Pain and the European Community Council directive of 22 September 2010 (2010/63/EU). The project was approved by Bordeaux Ethical Committee (CEEA 50) under n° 5012039-A. All efforts were made to minimize the num-ber of animals used. Adult male Wistar rats (150–175 g) obtained from Janvier (France) were used in this study. Animals were housed two per cage in a controlled envir-onment under a 12-h light/dark cycle (lights on 07:00– 19:00, 22 °C) with unrestricted access to water and food. Rats were acclimatized for 4 days to the animal facility and for 3 days to manipulations and devices prior to behavioral studies.
Three groups of animals were used: rats with surgery
and ligation of L5 and L6 spinal nerves (SNL, n = 47),
rats with surgery but no ligation (sham,n = 44), and rats
with no treatment (naïve, n = 34). Seven to eight rats in
each group (n = 7 in sham and n = 8 in naïve and SNL) were used to quantify mRNA on laser microdissected thalamic nuclei at day 14 and eight to nine rats in each
group (n = 8 in sham andn = 9 in naïve and SNL) at day
28. Four naïve, six sham, and six SNL were used to study microglia with immunohistochemical techniques at day 14 while five naïve, four sham, and five SNL were used at day 28. Four naïve, five sham, and six SNL were used to study astrocytes with immunohistochemical ap-proaches at day 14 as well as at day 28 as well as to assess changes in protein expression by using Western blot on formalin-fixed tissues. Behavioral tests were per-formed on all these animals to the exception of four naive. In addition, eight sham and eight SNL at day 14 were only subjected to behavioral tests. The first time
point was set at 14 days after the surgery since pain symp-toms and sensitization of VPL neurons are well
estab-lished at this time in the SNL model [26]. The second
time point was set at day 28 after the surgery since a pre-vious study reported a remote microglial activation within
the VPL 16 and 28 days after sciatic nerve injury [27].
Surgery
The well-established L5–L6 spinal nerve ligation rodent
model of neuropathy was used in this study [28]. Rats
were deeply anesthetized under gaseous anesthesia with
a 1:1 flow ratio of air/O2 (1 L/min) containing 5%
isoflurane (IsoFlo®, Axience, Pantin, France). Once the anesthesia was induced, the maintenance was performed
with a 1:1 flow ratio of air/O2(0.5 L/min) containing 2%
isoflurane. A local anesthesia was also performed with
lidocaine (Lurocaïne®, 20 mg/mL, Vétoquinol N.-A
Incorporation, Lavaltrie, Canada) before skin incision and at the time of wound closing. Briefly, the skin of the back was incised longitudinally, the transverse processes of the sixth lumbar vertebra was excised, and the right L5 and L6 spinal nerves were isolated and tightly ligated with a 6.0 polyamid thread (Ethicon, Issy les Mouli-neaux, France). After complete hemostasis, the incision was closed first by ligating muscular plane with a 4.0 nylon thread (Ethicon) then by using six to seven metal skin clips (AMS, Bordeaux, France). Then, lidocaine was subcutaneously injected in the operated region, and
100μL of antibiotics was injected intramuscularly in the
left thigh (7.5% of Borgal®, Virbac, Carros, France). Rats were housed in an individual cage for 48 h and followed up to quantify their general state and detect the pos-sible presence of surgical complications or abnormal excessive pain. Metal skin clips were removed at day 7 post-surgery under a brief gaseous anesthesia, following the same procedure as before. Sham rats underwent exactly the same procedure, but the exposed spinal nerves were not ligated. Any structure located on the
right operated side will be called “ipsilateral” and any
structure located on the opposite side,“contralateral.”
Behavioral tests
All behavioral tests were done by the same female ex-perimenter and within the same time windows at day 0 (D0) prior to surgical procedure, at day 14 (D14) after surgery (or at age-matched time points for naïve ani-mals), and at day 28 (D28) before sacrifice.
Mechanical allodynia and hyperalgesia were measured at both hind paws of the rats using responses to von Frey filaments (0.008–100 g) stimulation according to the method previously described in Ducourneau et al.
[5]. Each von Frey filament was applied on the plantar
surface of the hind paw five times with at least a 5-s interval and in ascending order. The rat response was
scored by an experimenter blind to the experimental group (except for the naïve group which had no scar) ac-cording to the following elements: (score 1) detection, rats slightly contracts their leg muscles without any ac-tual movement; (score 2) withdrawal reaction; (score 3) escape, rats withdraw and avoid further contact with the stimulus, by moving their body away from the stimulus; and (score 4) licking/biting of the stimulated paw after withdrawal. Score was equal to zero in case of absence of response. A mean score value was then calculated for each von Frey Filament. Since each von Frey filament was applied five times, the first mean score value above detection was 1.2 and was used to calculate the nocicep-tive response-threshold by a simple linear approxima-tion. Accordingly, this score value corresponds to the stimulus intensity at which more than 50% of withdrawal responses could be observed over five responses. To quantify mechanical hyperalgesia, we used a hyperalgesia score calculated as the difference between the areas under the response curve obtained at D14 (or D28) and at D0. In both cases, areas were measured from above the value of the threshold that was measured at day 0 and from above 1.2 behavioral score value. This score was mathematically quantified using an Excel macro for both ipsilateral and contralateral hind paw of each tested animal. When a negative score was obtained, it was set at zero.
Ambulatory pain was evaluated by using the dy-namic weight bearing (DWB, Bioseb, France)
appar-atus as extensively described in Ducourneau et al. [5].
Briefly, a mean value of the weight bore by each limb all over the experiment was calculated for the whole validated testing period and expressed as percentage of the animal weight.
Brain tissue samples
For quantitative real-time PCR approach, rats were deeply anesthetized under gaseous anesthesia with a mixture of
isoflurane (5%) and a 1:1 flow ratio of air/O2 (1 L/min)
and then decapitated. The brain was rapidly frozen on dry
ice and stored at − 80 °C until sectioning was done. For
sectioning, the frozen brain was mounted onto Tisue-Tek® OCT compound on a chuck and the brain was placed in a Leica CM3050S cryostat (Leica Microsystems, Wetzlar, Germany) for 20 min to equilibrate the brain with a
cham-ber temperature of − 20 °C and an object temperature of
− 18 °C. Sixty-micrometer-thick sections of the thalamus region were cut and placed on polyethylene naphthalate membrane slides (Carl Zeiss, Munich, Germany) under RNAse-free conditions. The slides were immediately transferred into ice-cold 95% ethanol (Merck, USA) for 40 s and incubated in 75% ethanol for 30 s and in 50% ethanol for 30 s. Specimens were briefly stained in 1% cresyl violet solution. Tissue sections were dehydrated
through 50% ethanol (30 s), 75% ethanol (30 s), and 95% ethanol (30 s), followed by two 40-s incubation in anhydrous 100% ethanol. Slides were dried for 5 min at room temperature. Immediately after dehydration, laser-assisted microdissections were performed using a P.A.L.M. MicroBeam microdissection system version 4.8 equipped with a P.A.L.M. RoboSoftware (P.A.L.M. Microlaser Technologies AG, Bernried, Germany). Microdissection was performed at × 5 magnification. Samples of VPL on both sides and of the ventral poster-omedian thalamic nucleus (VPM) on the contralateral side were collected in adhesives caps (P.A.L.M. Micro-laser Technologies AG, Bernried, Germany). Both VPL were collected as some bilateral projections have been reported in a model of unilateral hemi section of the
thoracic spinal cord [29]. The contralateral VPM was
chosen as a control thalamic nucleus as it receives only nociceptive information from the head and skull. To limit RNA degradation, samples were collected for up to 30 min per slide, after which the caps were placed on
a sterile microcentrifuge tube containing 350μl of lysis
buffer. The samples were then stored at − 80 °C until
extraction was done.
For Western blot, histochemistry, and immunohisto-chemical detection of glial markers, rats were killed under deep anesthesia with pentobarbital (100 mg/kg i.p.) and perfused transcardially with warm (37 °C) heparinized sa-line (25 IU heparin/mL; 2–3 min) followed by cold (10 °C) phosphate-buffered solution (0.1 M, pH 7.6) containing 4% (for astrocytic markers) or 2% (for microglial marker) paraformaldehyde and 0.4% picric acid for 30 min. Brains were then removed and transferred into 0.05 M Tris buff-ered saline (TBS) containing 30% sucrose for cryoprotec-tion and 0.05% sodium azide for conservacryoprotec-tion and left at
4 °C until use. Coronal sections (30-μm-thick) were cut on
a cryomicrotome (Microm, Germany). Slices were then stored in culture plate wells within the TBS/30% sucrose/ 0.05% sodium azide solution at 4 °C until use. Slices were sequentially deposited in eight wells; therefore, in each
well, slices were 240μm apart. Each sequence of cutting
included animals from different groups to homogenize experimental conditions. The ipsilateral side of the brain cortex was gently notch to determine the side of the brain for the future quantifications.
Quantitative real-time PCR
Total RNA was extracted from microdissected tissues using the RNeasy® micro Kit (Qiagen, Hilden, Germany) according to the manufacturer’s protocol and eluted
with 14μl of RNAse-free water. All samples displayed
RIN greater than or equal to 7.8 as determined using the RNA 6000 Pico Kit and the bioanalyzer 2100 (Agilent Technologies). cDNA was synthesized from 90 ng of total RNA using RevertAid Premium Reverse
Transcriptase (Fermentas) and primed with oligo-dT primers (Fermentas) and random primers (Fermentas). PCR amplification was performed using a LightCycler® 480 Real-Time PCR System (Roche, Meylan, France) with following cycles (95 °C for 5 min followed by 45 cy-cles with 95 °C, 15 s and 61 °C for 30s). Quantitative real-time PCR (Q-PCR) reactions were done in dupli-cate for each sample, using transcript-specific primers, cDNA (1 ng), and LightCycler 480 SYBR Green I
Mas-ter (Roche) in a final volume of 10μl. Due to the small
amount of collected tissue, we were able to explore mRNA expression of only nine genes. Primer sequences
used are reported in Table 1. We choose to study the
mRNA expression of three genes that code for proteins that are usually used as astrocytic markers in immuno-histofluorescence: GFAP and S100β protein that are
enriched in astrocytes [30] and upregulated in reactive
astrocytes [31] as well as the glutamine synthetase that
is an astrocytic enzyme that generates glutamine from glutamate and ammonia. To the best of our knowledge, only a short communication has reported in 1990 a non-astrocytic glutamine synthetase expression in the rat brain based only on shape, size, and location of
nu-cleus of the glutamine synthetase expressing cells [32].
Therefore, as in humans [33], it appears reasonable to
consider the glutamine synthetase as an astrocytic-spe-cific marker in the rat brain, which is not the case in
the mouse brain [34, 35]. For the microglial markers,
we studied the mRNA expression of the genes coding for three proteins that are specifically expressed in microglia and the expression of which has been shown
to be altered in reactive microglia: iba-1 [36, 37], the
cluster of differentiation molecule 11 b (CD11b) [38,
39], and the fractalkine receptor (CX3CR1) [40–43]. As
CX3CR1 is involved in a well-defined microglia-neu-ron-microglia interaction loop, we added the genes of the other protagonists. Indeed, the fractalkine (a
che-mokine named CX3CL1 and reported as“other” among
the astrocytic and microglial markers in the figures) is expressed on neuronal membrane and cleaved by cathepsin S (CTSS), a cysteine protease expressed and secreted by microglia. The obtained soluble form of CX3CL1 acts on the fractalkine receptor expressed on microglia. Finally, we added the toll-like receptor 4 (TLR4) as it is a specific receptor for lipopolysaccharide known as a signal for microglia activation and as microglia is the only central nervous system glial cells
that express TLR4 [44]. PCR data were exported and
analyzed in an informatics tool (Gene Expression Ana-lysis Software Environment) developed at the Neuro-Centre Magendie. For the determination of the reference
gene, the Genorm method was used [45]. Relative
expres-sion analysis was corrected for PCR efficiency and nor-malized against two reference genes: peptidypropyl
isomerase A and succinate dehydrogenase complex sub-unit A genes for microdissected thalamic nuclei at day 14
and valosin-containing protein and β actin genes for
microdissected thalamic nuclei at day 28. The relative level of expression was calculated using the comparative (2−ΔΔCT) method [46], and naïve animals were arbitrarily set at 1. The results are presented as color-coded tables
(for example see Fig.3) showing theΔCt obtained for each
of the tested genes (column, ordered in categories) and for each animal (row, ordered in the three experimental
groups: naïve, sham, SNL). The smaller theΔCt (yellow),
the higher the mRNA expression is; the higher the ΔCt
(deep blue), the smaller the mRNA expression is. The me-dian value of the color code (light blue) corresponds to
the mean of theΔCt obtained in naïve animals for a given
gene. It must be noted that, on average, the difference between high (deep blue) and low value (yellow) is 2.35. When no result was obtained, the cell appears white. When the treatment has a significant effect on the mRNA expression of a given gene, histogram showing the fold change is presented.
Western blot
We used 20 free-floating sections (30-μm-thick) per ani-mal to collect tissue samples. We mounted each section on a glass slide, and by using a disposable biopsy punch (Kai medical, 2 mm diameter, Seki, Japan), we collected a piece of the contralateral thalamus including the VPL.
Therefore, we obtained around 1.88 mm3formalin-fixed
tissue/per animal.
Protein was extracted using the Qproteome FFPE Tis-sue Kit (Qiagen), and then quantified using the Lowry
method (Biorad RC DC Protein Assay Kit, France) fol-lowing the manufacturer’s instructions.
Thirty microgram of protein was loaded onto 4–15% precast polyacrylamide gels and transferred to PVDF membranes (Biorad) using the Transblot Turbo System (Biorad). The resulting blot was blocked for 1 h at room temperature with 5% fat-free milk in Tris-buffered saline containing Tween 20 then incubated overnight at 4 °C with the following primary antibodies: rabbit anti-CX3CR1 (1/1000; catalog n° TP501; Torrey Pines Bio-labs, Secaucus, USA; RRID: AB_10892355) or rabbit anti-beta actin (1/1000; catalog n° 4967; Cell Signaling, France; AB_330288) diluted in 5% bovine serum albumin in Tris-buffered saline containing Tween 20.
After washing, membranes were incubated with a horse-radish peroxidase-conjugated secondary antibody (goat anti-rabbit 1/2000; catalog n°7074; Cell Signaling; AB_ 2099233). Immunoreactive bands were visualized using enhanced chemiluminescence (Western Lightning ECL plus, PerkinElmer, France) and detected using the Biorad Chemidoc Touch imaging system.
Between antibodies, membranes were stripped with a
solution containing β-mercaptoethanol and re-blocked
with fat-free milk. Quantitative analysis was performed by densitometry with ImageJ software (NIH, Bethesda, MA) and normalized with the loading control beta-actin.
Histochemistry
We used a histochemical method for localizing acetyl-cholinesterase activity via acetylthiocholine in order to
properly delineate thalamic nuclei (see Figs.6a and7a).
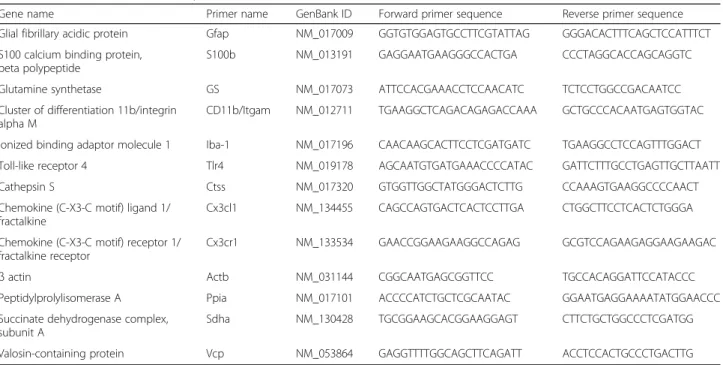
Table 1 Quantitative real time PCR primers
Gene name Primer name GenBank ID Forward primer sequence Reverse primer sequence
Glial fibrillary acidic protein Gfap NM_017009 GGTGTGGAGTGCCTTCGTATTAG GGGACACTTTCAGCTCCATTTCT S100 calcium binding protein,
beta polypeptide
S100b NM_013191 GAGGAATGAAGGGCCACTGA CCCTAGGCACCAGCAGGTC
Glutamine synthetase GS NM_017073 ATTCCACGAAACCTCCAACATC TCTCCTGGCCGACAATCC
Cluster of differentiation 11b/integrin alpha M
CD11b/Itgam NM_012711 TGAAGGCTCAGACAGAGACCAAA GCTGCCCACAATGAGTGGTAC Ionized binding adaptor molecule 1 Iba-1 NM_017196 CAACAAGCACTTCCTCGATGATC TGAAGGCCTCCAGTTTGGACT
Toll-like receptor 4 Tlr4 NM_019178 AGCAATGTGATGAAACCCCATAC GATTCTTTGCCTGAGTTGCTTAATT
Cathepsin S Ctss NM_017320 GTGGTTGGCTATGGGACTCTTG CCAAAGTGAAGGCCCCAACT
Chemokine (C-X3-C motif) ligand 1/ fractalkine
Cx3cl1 NM_134455 CAGCCAGTGACTCACTCCTTGA CTGGCTTCCTCACTCTGGGA Chemokine (C-X3-C motif) receptor 1/
fractalkine receptor
Cx3cr1 NM_133534 GAACCGGAAGAAGGCCAGAG GCGTCCAGAAGAGGAAGAAGAC
β actin Actb NM_031144 CGGCAATGAGCGGTTCC TGCCACAGGATTCCATACCC
Peptidylprolylisomerase A Ppia NM_017101 ACCCCATCTGCTCGCAATAC GGAATGAGGAAAATATGGAACCC
Succinate dehydrogenase complex, subunit A
Sdha NM_130428 TGCGGAAGCACGGAAGGAGT CTTCTGCTGGCCCTCGATGG
Sections (from an adjacent well of the one treated for the immunohistofluorescent detection of glial markers) were incubated in sodium acetate buffer (0.2 M, pH 5.9) for 5 min and then for 15 min in a pre-incubation solution under gentle agitation (100 ml 0.2 M sodium acetate buf-fer at pH 5.9, 0.25 g copper sulfate pentahydrate and 0.375 g glycine). Acetylcholinesterase incubating medium (100 mg acetylthiocholine iodide in the pre-incubation so-lution) was prepared immediately before use, and slides were incubated for 4 h at room temperature under gentle agitation and then washed in sodium acetate buffer for 5 min. To visualize the sites of acetylcholinesterase activity, the sections were subjected to a 1% ammonium sulfate solution (in sodium acetate buffer) for 2 min. The sections were then rinsed three times in sodium acetate buffer for 5 min, mounted on gelatin-coated slides, coverslipped using Vectashield (Vector Laboratories, Inc., Burlingame, CA), and then stored at 4 °C until use.
Immunohistochemistry
All immunofluorescence steps were performed under gentle agitation at room temperature. Slices were rinsed three times in 0.05 M TBS for 10 min and then incubated with primary antiserum overnight. After in-cubation, slices were washed again three times in TBS for 10 min and incubated in secondary antibody solu-tion for 2 h in obscurity. Primary antibodies were diluted in TBS containing 0.25% Triton X-100 and normal goat serum (10% for immunohistochemical de-tection of astrocytes or 1% for immunohistochemical detection of microglia). Secondary antibodies were diluted in TBS containing 0.25% Triton X-100 and the nuclear marker 4′,6′-diamidino-2-phenylindol (DAPI; 1:10,000; catalog n° D1306, Molecular Probes, Life Technologies, Carlsbad, California, USA). Slices were mounted on gelatin-coated slides and coverslipped using Vectashield (Vector Laboratories, Inc., Burlingame, CA), then stored at 4 °C until use. All animals and all groups were run simultaneously: one well per animal, all animals per condition.
For visualization of microglia, we used a single immu-nohistofluorescent technique. Sections were incubated in a rabbit antiserum raised against a synthetic peptide corresponding to the C-terminus of iba-1 (1:2000; cata-log n° 019-19741; Wako, Osaka, Japan; AB_839504) and then in a goat anti-rabbit secondary antibody conjugated to Alexa 488 (1:2000; Jackson Immunoresearch Labora-tories, West Grove, USA).
For visualization of astrocytes, we used a double immu-nohistofluorescent technique. We incubated sections in a rabbit antiserum against GFAP (1:1000; catalog n° Z0334; AB_10013382; Dako, Trappes, France) and a monoclonal
mouse antibody against protein S100β-subunit (S100β;
1:10,000; clone SH-B1; catalog n° S2532; AB_477499;
Sigma-Aldrich, St-Louis, MO, USA). Then, species-spe-cific secondary antibodies which have been raised in goat (anti-rabbit conjugated to cyanine 3 diluted 1:300 and anti-mouse conjugated to Alexa 488 diluted 1:2000) were used and were supplied by Jackson Immunoresearch La-boratories (West Grove, USA).
Imaging and analysis of stained sections
Quickly after histochemistry or the immunofluorescence treatment, stained sections were examined with a Leica DMI6000 spinning disk microscope (Leica Microsys-tems, Wetzlar, Germany) and digital images were cap-tured with a HQ2 CCD camera (Photometrics, Tucson, USA) under a × 20 objective (HC PL APO CS, 0.7 NA, Leica Microsystems, Wetzlar, Germany). The diode lasers used were at 408 nm (for DAPI), 491 nm (for Alexa 488), and 561 nm (for cyanine 3). The technique of scan slide was used in order to visualize and recon-struct all areas of interest. The mosaics were done with a motorized stage Scan IM (Märzhäuser, Wetzlar, Germany). This system was controlled by MetaMorph software (Molecular Devices, Sunnyvale, USA). Parame-ters were determined at the beginning of the acquisition and were maintained for all acquisitions of the same experiment. For each animal, three non-adjacent slices were randomly selected and acquired. For each slice, two images (ipsilateral and contralateral side) of the lat-eral thalamus containing the VPL and the VPM were captured as well as an image of the central thalamus containing the MD and the IL.
For GFAP and iba-1, morphometric analysis was per-formed with the Metamorph 7.8.1.0 program. The procedure consisted of three steps: (1) background sub-straction, (2) thresholding, and (3) morphometric cal-culations in delineated areas (ipsi- and contralateral VPL as well as its subregion, contralateral VPM, MD, and IL). As the VPL presents a fine topographic map of
the fore- and hindlimbs [47], we delineate the
sub-region of the VPL (see Fig. 6A) that receives
informa-tion from the hindlimb (we call it VPL subregion). Thresholding of images was made to obtain positive versus negative pixel in a 0-65535 gray scale. Delinea-tion of regions of interest was performed using
stereo-taxic coordinates [48] and cytoarchitectonic boundaries
gathered on sections treated to reveal the activity of the
acetylcholine esterase (see Figs. 6a and 7a). For each
section, the total surface of each delineated area as well as the total immunostained surface within each delin-eated area was calculated. Values of immunostained surface were expressed in percent, and for each rat, the mean of percent values obtained on three different slices was calculated for each area of interest.
For astrocytes and microglia conventional counts,
cells in ipsi- and contralateral VPL subregion was per-formed with the Metamorph 7.8.1.0 program following the previously described determination of immunostained surface. Microglia were identified based on having rami-fied labeled fibers (green) emanating from a iba-1-stained cell body (green) displaying a DAPI-iba-1-stained nucleus (deep blue resulting in a turquoise part of the cell
body; see Fig. 6B). Astrocytes were identified based on
having at least two thick GFAP-labeled fibers (red) eman-ating from a S100β-stained cell body (green) displaying a DAPI-stained nucleus (deep blue resulting in a turquoise
part of the cell body; see Fig.9a). Therefore, for each rat,
we calculated the mean of the GFAP/S100β/DAPI-positive or iba-1/DAPI-positive cell number per surface area unit
(μm2
) obtained in the three different sections.
In order to verify that our conventional method of count-ing did not introduce any bias, we performed an optical dis-ector method of stereological counting on Nanozoomer acquired iba-1 immunostained sections. The slide scanner was a Nanozoomer 2.0HT with fluorescence imaging mod-ule (Hamamatsu Photonics France) using objective UPS APO 20× NA 0.75 combined to an additional lens × 1.75, leading to a final magnification of × 35. Virtual slides were acquired with a TDI-3CCD camera. Fluorescent acquisi-tions were done with a mercury lamp (LX2000 200 W - Ha-mamatsu Photonics, Massy, France) and the set of filters adapted for Alexa 488 fluorescence. Iba-1 immunopositive cell density was determined using the optical disector with the stereological module of Mercator (Explora Nova, La Rochelle, France) on six images of sections that were at least
210μm apart, for each animal. Within the delineated VPL,
the computer program automatically generates counting
frames, which measured 50μm × 50 μm (width × height)
and are spaced in X- and Y-axis by 30 μm. The disector
frame consists of two in-bound green lines (inclusion lines) and two out-of-bounds red lines (exclusion lines). To the exclusion of the cells that touched the red lines, the investi-gator counted cells within each counting frame. The total number of counted iba-1 immunopositive cells was then divided by the total volume of the counting frames to
deter-mine iba-1 immunopositive cell density (number/mm3).
All analyses were performed by an experimenter who was blinded to the experimental group. To the exception of the optical disector method of stereological counting, all analyses were performed on a single focal plane.
For preparing illustrations, selected images were proc-essed using Adobe Photoshop CS (Adobe Systems, Mountain View, CA). Only brightness and contrast were adjusted for the whole frame, and no part of a frame was enhanced or modified in any way.
Statistical analysis
All data were analyzed using a scientific graphing and data analysis software GraphPad Prism 5 (GraphPad
Software). When the KS normality test failed, a Kruskal-Wallis one-way analysis of variance (ANOVA) on ranks was performed followed by an all pairwise multiple com-parison procedures (Dunn’s method). When the KS normality test passed, one-way ANOVA followed by Tukey’s post hoc test was used. Linear relationships were assessed using Pearson’s correlation test. A p level of 0.05 was set as the level of statistical significance. As naïve animals were arbitrarily set at 1 in the figures of PCR results, all other data (behavior and immunohisto-chemistry) were also presented as percentage of naïve. All data are expressed as mean ± SEM.
Results
Pain behavior following spinal nerve ligation
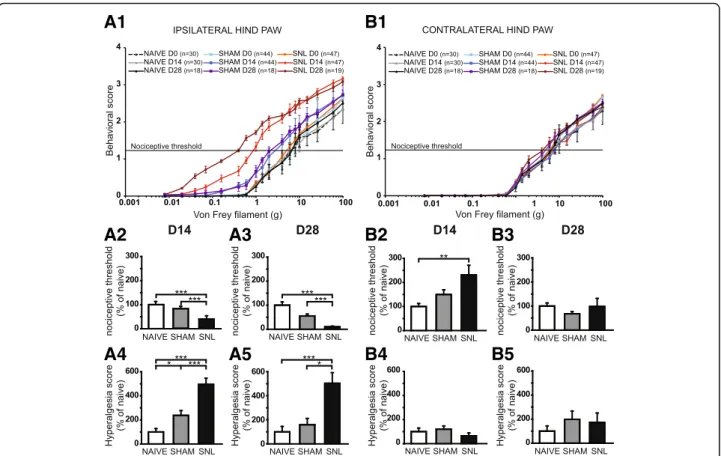
Overall, SNL rats display a progressive (D14 and then D28) and dramatic reduction in nociceptive threshold to von Frey hair stimulation on the ipsilateral hind paw
(Fig. 1A1). Indeed, SNL curves displayed a shift to the
left between D0 and D14 and also between D0 and D28: previously non painful stimuli became painful, a process known as allodynia. Consistently, the nociceptive thresh-old of the ipsilateral hind paw of SNL rats was
signifi-cantly reduced at D14 (Fig. 1A2) and also at D28
(Fig. 1A3) compared to that of the naïve (60 and 90%
decrease respectively) and of the sham rats (51% and 80% decrease respectively). The decrease of nociceptive threshold was paralleled by an increase in the intensity of the behavioral responses to von Frey hair stimulation above and below the initial nociceptive threshold
(Fig. 1A1). Indeed, SNL curves displayed a shift to the
top between D0 and D14 and also between D0 and D28: a previously painful stimulus produced a more painful reaction, a process known as hyperalgesia. Accordingly, the hyperalgesia score of the ipsilateral hind paw of SNL rats was dramatically and significantly increased at D14
(Fig. 1A4) but also at D28 (Fig. 1A5) compared to that
of the naïve (5 times greater at both time points) and of the sham rats (2 and 3 times greater respectively). It is of interest to note that the hyperalgesia score of the ipsilateral hind paw of sham rats is significantly higher compared to that of the naïve rats at D14 (2.4 times
greater; Fig.1A4).
For the contralateral hind paw, no obvious shifts to the left or to the top of the SNL curves were observed
(Fig. 1B1). Accordingly, the analysis of the variance of
the nociceptive threshold at D28 (Fig. 1B3) as well as of
the hyperalgesia score at D14 (Fig. 1B4) and D28
(Fig. 1B5) revealed no effect of the treatment.
Surpris-ingly, the nociceptive threshold of the contralateral hind paw of SNL rats at D14 was significantly higher com-pared to that of the naïve rats (2.3 times greater;
Fig.1B2). Therefore, a previously painful stimulus at D0
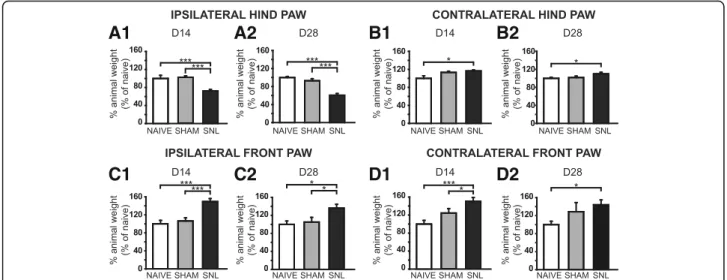
DWB evaluation showed a reduced use of the ipsilateral
hind paw in SNL rats at D14 (Fig.2A1) and D28 (Fig.2A2)
with a significant drop of the weight borne compared to that of naïve (28% and 41% decrease respectively) and sham rats (28% and 37% decrease). The load was redistributed to
the contralateral hind paw (Fig.2B1, B2) as well as the front
paws (Fig.2C1, C2, D1, and D2) with a significant increase
of the weight borne compared to that of the naïve rats at D14 and D28 (1.2 times greater for the contralateral hind paw and around 1.5 times greater for the front paws). The difference between the weight borne in sham and SNL rats only reached statistical significance for the ipsilateral front
paw at D14 (1.5 times greater; Fig.2C1) and D28 (1.2 times
greater; Fig. 2C2) and for the contralateral front paw at
D14 (1.2 times greater; Fig.2D1).
In conclusion, SNL animals display mechanical static allodynia and hyperalgesia as well as a reduced use of the ipsilateral hind paw 14 days as well as 28 days after
the L5–L6 spinal nerve ligation. The surgery by itself
(without the nerve ligation) produces a transient mech-anical static hyperalgesia 14 days after the surgery. Alteration in thalamic mRNA expression 14 and 28 days after spinal nerve ligation
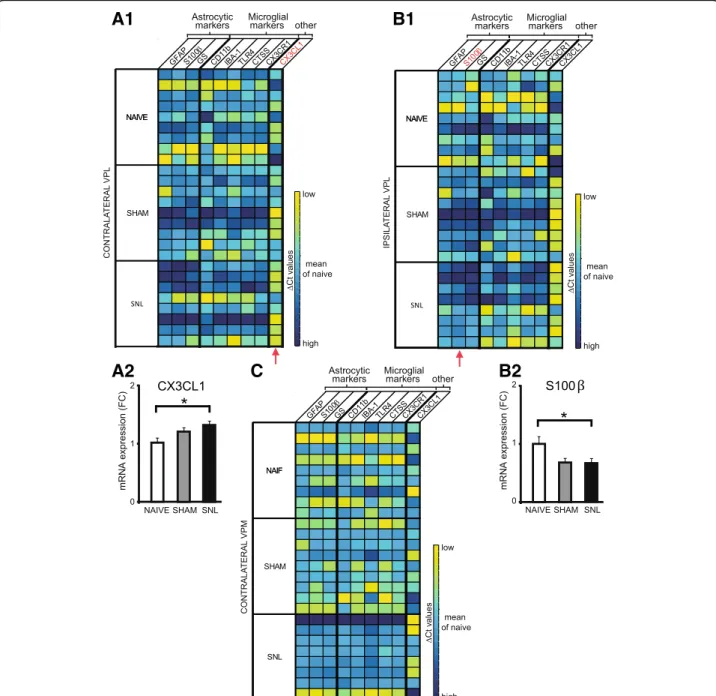
We performed Q-PCR on microdissected contralateral
(Fig.3A1) and ipsilateral (Fig.3B) VPL as well as
contra-lateral VPM (Fig. 3C) of naïve, sham, and SNL animals
collected 14 days after the beginning of the experiment. The amount of tissue collected allowed exploring the
mRNA expression of nine genes (see Table1). We found
A1
A2
A3
B1
B2
B3
A4
A5
B4
B5
Fig. 1 Mechanical static allodynia and hyperalgesia impairment 14 and 28 days after spinal nerve ligation. The mean behavioral score in response to five stimuli applied on the plantar surface of the ipsilateral (A1) and contralateral (B1) hind paw of naïve, sham, and spinal nerve-ligated (SNL) animals at day 0 (D0), day 14 (D14), and day 28 (D28) is plotted against the strength of the applied von Frey hair. Note that the curves of SNL at D14 and D28 for the ipsilateral hind paw are dramatically shifted to the left and to the top compared to D0 (A1). Bar histograms show mean nociceptive threshold (expressed as percentage of naïve values) of the ipsilateral hind paw at D14 (A2) and D28 (A3) and of the contralateral hind paw at D14 (B2) and D28 (B3) as well as the hyperalgesia score of the ipsilateral hind paw at D14 (A4) and D28 (A5) and of the contralateral hind paw at D14 (B4) and D28 (B5). The nociceptive threshold of the ipsilateral hind paw of the SNL rats at D14 and D28 was significantly reduced compared to the ones of the naïve and of the sham rats (A2: Kruskal-Wallis testH(2) = 44.45, p < 0.0001; A3: Kruskal-Wallis test H(2) = 33.79, p < 0.0001). For the contralateral hind paw, the nociceptive threshold of SNL rats was significantly increased at D14 compared to the one of the naïve rats (B2: Kruskal-Wallis testH(2) = 11.87, p = 0.0026) but not at D28 (B3: Kruskal-Wallis testH(2) = 3.95, p = 0.14). The hyperalgesia score (expressed as percentage of naïve values) of the ipsilateral hind paw of the SNL rats at D14 and D28 was significantly increased compared to the ones of the naïve and of the sham rats (A4: Kruskal-Wallis testH(2) = 37.34, p < 0.0001; A5: Kruskal-Wallis testH(2) = 18.30, p = 0.0001). Note that the hyperalgesia score of the ipsilateral hind paw of the sham rats is significantly higher than the one of the naïve rats at D14 (A4). No hyperalgesia was detected on the contralateral hind paw (B4: Kruskal-Wallis testH(2) = 5.36, p = 0.0683; B5: Kruskal-Wallis test H(2) = 1.328, p = 0.51). Post hoc test (Dunn’s multiple comparison test): *p < 0.05; **p < 0.01; ***p < 0.001
that in the contralateral VPL, mRNA expression of the
CTSS gene (Fig.3A2) and of the C×3CR1 gene (Fig.3A3)
was significantly increased in SNL animals compared to naïve rats (1.3 times greater). Moreover, the expression of these two genes was correlated to the ambulatory pain. The less weight the animal bore on its ipsilateral hind paw, the higher the mRNA expression of the CTSS
(Fig. 3A4) and the CX3CR1 (Fig. 3A5) genes was. No
significant difference was observed in the mRNA
expres-sion of the tested genes in the ipsilateral VPL (Fig. 3B)
and contralateral VPM (Fig.3C). It should be noted that,
due to low amount of mRNA collected from VPM, only five genes were tested on the microdissected VPM tissues.
We also performed Q-PCR on microdissected
contra-lateral (Fig. 4A1) and ipsilateral (Fig. 4B1) VPL as well
as contralateral VPM (Fig.4C) of naïve, sham, and SNL
animals collected 28 days after the beginning of the ex-periment. We found that in the contralateral VPL, mRNA expression of the C×3CL1 gene was significantly increased in SNL animals compared to naïve rats (nearly
1.3 times greater; Fig.4A2), while in the ipsilateral VPL,
mRNA of the S100β gene was significantly decreased in
SNL animals compared to naïve rats (33% decrease;
Fig. 4B2; surgery alone (sham animals) also tended to
decrease mRNA of the S100β gene compared to naïve
rats, post hoc test:p = 0.054).
In conclusion, we found a specific increase in mRNA expression of cathepsin S and fractalkine receptor 14 days after the beginning of the experiment and then a specific increase in mRNA expression of fractalkine 28 days after the beginning of the experiment within the laser microdissected contralateral VPL of SNL animals
compared to naïve animals (see summary Fig.12). These
are well-known markers of microglial reactivity.
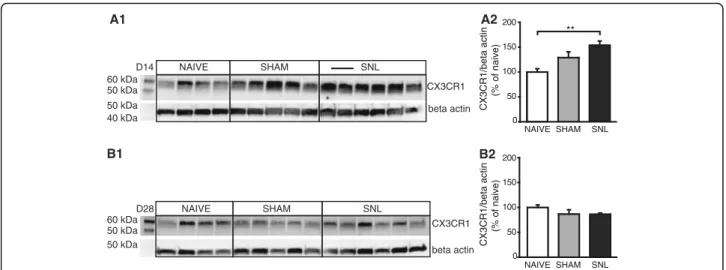
Altered fractalkine receptor protein levels 14 days after spinal nerve ligation
To determine whether altered mRNA expression
resulted in altered protein expression, we examined pro-tein expression by Western blotting extracts from formalin-fixed lateral thalamus including the cVPL of naïve, sham, and SNL rats collected 14 or 28 days after the beginning of the experiment. The CX3CR1 anti-serum recognized a single band with an apparent
molecular weight of 55 kDa (Fig.5A1, B1). Western blot
quantification revealed that at D14, CX3CR1 protein level in the contralateral thalamus was significantly increased in SNL animals compared to naïve rats (1.5
times greater; Fig. 5A1, A2) while no significant
differ-ence was observed in the CX3CR1 protein level at D28
(Fig.5B1, B2).
A1
A2
B1
B2
C1
C2
D1
D2
Fig. 2 Weight-bearing impairment 14 and 28 days after spinal nerve ligation. Bar histograms show the percentage of animal weight (expressed as percentage of naïve values) distributed on the ipsilateral (A1 and A2) and contralateral (B1 and B2) hind paws as well as the ipsilateral (C1 and C2) and contralateral (D1 and D2) front paws in naïve, sham, and SNL rats at D14 (A1, B1, C1 and D1) and D28 (A2, B2, C2 and D2). The percentage of the animal weight borne on the ipsilateral hind paw in SNL animals was significantly decreased at D14 (A1: Kruskal-Wallis testH(2) = 35.73, p < 0.0001) and D28 (A2: Kruskal-Wallis testH(2) = 28.87, p < 0.0001) compared to sham and naïve rats while the percentage of the animal weight borne on the ipsilateral front paw was significantly increased at D14 (C1: Kruskal-Wallis testH(2) = 27.89, p < 0.0001) and D28 (C2: Kruskal-Wallis test H(2) = 9.832, p = 0.0073) compared to sham and naïve rats. The percentage of the animal weight borne on the contralateral hind paw in SNL animals was significantly increased at D14 and D28 (B1: Kruskal-Wallis testH(2) = 7.449, p = 0.0241; B2: Kruskal-Wallis test H(2) = 8.024, p = 0.0181) compared to naïve animals. This was also true for the contralateral front paw (D1: Kruskal-Wallis testH(2) = 14.39, p = 0.0007; D2: Kruskal-Wallis test H(2) = 6.682, p = 0.03). In addition, the percentage of the animal weight borne on the contralateral hind paw in SNL animals was also significantly increased at D14 compared to naïve animals. Post hoc test (Dunn’s multiple comparison test): *p < 0.05; ***p < 0.001
In conclusion, in addition to the specific increase in mRNA expression of the fractalkine receptor, we also found an increase in the fractalkine receptor protein level in the contralateral thalamus of SNL animals compared to naïve animals 14 days after the beginning of the experiment.
Decreased iba-1 immunostaining and decreased number of iba-1 positive cells in the VPL 14 days after spinal nerve ligation
To further determine whether spinal nerve ligation leads to microglia activation in the thalamus that receives
A1
B
A2
A3
A4
A5
C
Fig. 3 Upregulation of microglial markers’ mRNA expression in microdissected contralateral VPL 14 days after spinal nerve ligation. Tables summarize the expression of up to nine genes on microdissected contralateral (A1) and ipsilateral (B) VPL as well as contralateral VPM (C) of naïve (n = 8), sham (n = 7), and SNL animals (n = 8) collected 14 days after the beginning of the experiments, with high expression level appearing in yellow and low expression level in dark blue. Red arrows indicate genes for which mRNA expression is significantly altered by the experimental conditions. For these genes, the mean fold change is presented on bar histograms. In the contralateral VPL, mRNA expression of the CTSS gene (A2: one-way ANOVAF(2, 13) = 8.103, p = 0.0052) and of the CX3CR1 gene (A3: one-way ANOVAF(2, 13) = 4.043, p = 0.0431) is significantly increased in SNL animals compared to naïve rats. The expression of these two genes is correlated to the ambulatory pain. The less weight the animal bears on its ipsilateral hind paw, the higher the mRNA expression of the CTSS (A4) and the CX3CR1 (A5) genes is. No significant difference was observed in the mRNA expression of the tested genes in the ipsilateral VPL (B) and contralateral VPM (C). It must be noted that, due to technical problems, only five genes were tested on the contralateral VPM. Post hoc test (Tukey’s multiple comparison test): *p < 0.05; **p < 0.01
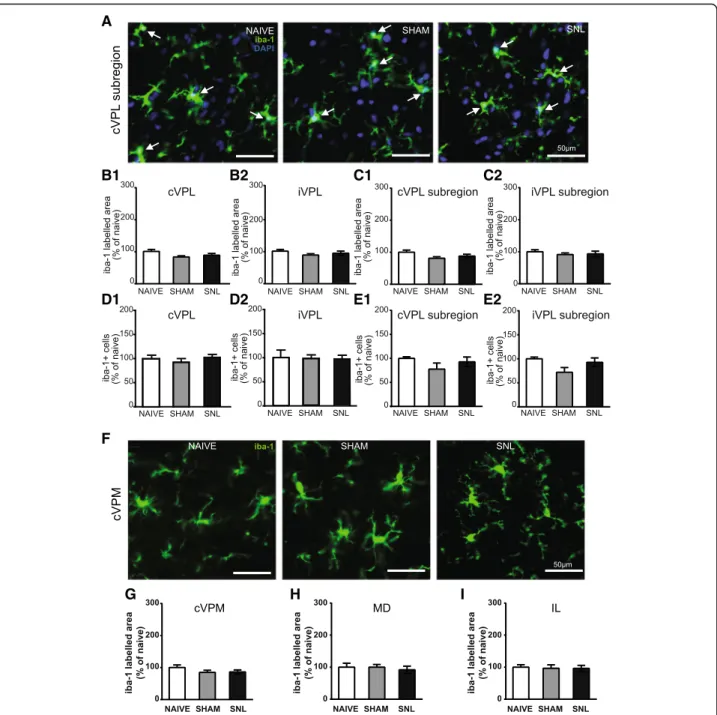
projections from ascending pain pathways, we used mor-phometric analysis of iba-1 immunostaining as well as iba-1/DAPI-positive cell counts. Representative micro-photographs of iba-1 immunostaining in the VPL
(delin-eated in Fig. 6A) of naïve, sham, and SNL animals
14 days after the beginning of the experiments are
displayed in Fig. 6B1 and B2. Morphometric analysis
of the iba-1-immunolabeled surface was performed in
the entire VPL (Fig. 6C1 and C2), but also more
spe-cifically in the VPL subregion (Fig. 6D1 and D2) that
receives information from the hindlimb (delineated in
Fig. 6A). This analysis led to the same results in the
A1
A2
C
B2
B1
Fig. 4 Altered mRNA expression in the microdissected VPL 28 days after spinal nerve ligation. Tables summarize the expression of up to nine genes on microdissected contralateral (A1) and ipsilateral (B1) VPL as well as contralateral VPM (C) of naïve (n = 9), sham (n = 9), and SNL animals (n = 8) collected 28 days after the beginning of the experiments, with high expression level appearing in yellow and low expression level in dark blue. Red arrows indicate genes for which mRNA expression is significantly altered by the experimental conditions. In the contralateral VPL, mRNA expression of the CX3CL1 gene is significantly increased in SNL animals compared to naïve rats (A2: one-way ANOVAF(2, 23) = 4.243, p = 0.027) while in the ipsilateral VPL mRNA of the S100β gene is significantly decreased in SNL animals compared to naïve rats (B2: one-way ANOVA F(2, 23) = 3.972,p = 0.033). Even though mRNA expression of the tested genes appears low in the contralateral VPM of SNL animals (C), no significant difference is found. Post hoc test (Tukey’s multiple comparison test): *p < 0.05
contralateral VPL and contralateral VPL subregion. In-deed, in both regions, iba-1 immunostaining occupied a significantly smaller area in SNL animals than in naïve
and sham rats (35% decrease; Fig.6B1, C1, and D1). This
tendency was also found in the ipsilateral VPL (Fig.6C2)
and VPL subregion (Fig. 6D2), but iba-1-immunostained
surface was only significantly smaller in the ipsilateral VPL
of SNL rats compared to the one of naïve rats (Fig.6C2).
By performing stereological counting in the whole VPL, we found that iba-1/DAPI-positive cell density was signifi-cantly lower in SNL animals compared to naïve animals on
the contralateral side (31.5% decrease; Fig.6E1).
Further-more, iba-1/DAPI-positive cell density was correlated to ambulatory pain. Indeed, the less weight the animal bore on its ipsilateral hind paw, the lower the density of iba-1/
DAPI-positive cells was in the contralateral VPL (Fig.6E3).
By using conventional counts in the VPL subregion, we found that the iba-1/DAPI-positive cell number per surface area unit was significantly lower in SNL animals compared to naïve animals on the contralateral side (21% decrease;
Fig.6F1). Both counting methods revealed that the
experi-mental conditions did not significantly alter the iba-1/
DAPI-positive cell number in the ipsilateral VPL (Fig.6E2)
and ipsilateral VPL subregion (Fig. 6F2). Therefore, both
counting methods led to the same results.
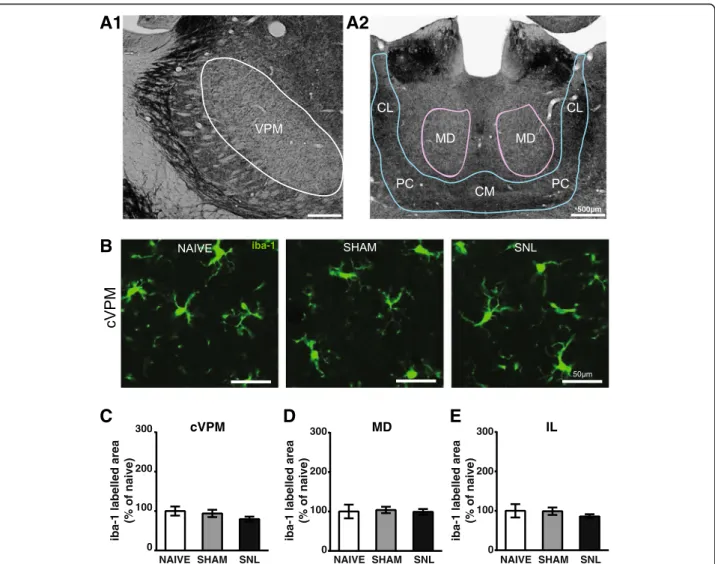
Changes in iba-1-immunostained surface upon ex-perimental conditions were not found 14 days after the beginning of the experiments in the contralateral
VPM (delineation: Fig. 7A1; representative pictures:
Fig. 7B; quantification: Fig. 7C), in the MD
(delinea-tion: Fig. 7A2; quantification: Fig. 7D), and in the IL
(delineation: Fig. 7A2; quantification: Fig. 7E). Indeed no
difference was found between experimental conditions. Twenty eight days after the beginning of the experi-ments, iba-1-immunostained area (representative
pic-tures in Fig. 8A) was not altered upon experimental
conditions in the contralateral (Fig. 8B1) and ipsilateral
(Fig. 8B2) VPL and in the contralateral (Fig. 8C1) and
ipsilateral (Fig. 8C2) VPL subregion. Likewise, iba-1/
DAPI-positive cell number per volume unit was un-changed upon experimental conditions in the
contralat-eral (Fig.8D1) and ipsilateral (Fig. 8D2) VPL, and iba-1/
DAPI-positive cell number per surface area unit was un-changed upon experimental conditions in the
contralat-eral (Fig. 8E1) and ipsilateral (Fig. 8E2) VPL subregion.
In the same way, iba-1-immunostained surface remained unchanged upon experimental conditions 28 days after the beginning of the experiments in the contralateral
VPM (representative pictures: Fig. 8F; quantification:
Fig.8G), in the MD (Fig.8H), and in the IL (Fig.8I).
In conclusion, we found that the iba-1 immunostain-ing area and the number of iba-1 immunopositive cells were specifically decreased in the contralateral VPL of SNL as compared to the one of naïve rats 14 days after
the beginning of the experiment (see summary Fig.12).
Increased GFAP immunostaining in the thalamus 28 days after spinal nerve ligation
To determine whether spinal nerve ligation leads to astrocytic activation in the thalamus that receives projections from as-cending pain pathways, we used morphometric analysis of GFAP immunostaining as well as GFAP/S100β/DAPI-positive
60 kDa 50 kDa 50 kDa 40 kDa CX3CR1 beta actin NAIVE SHAM SNL D14 60 kDa 50 kDa 50 kDa CX3CR1 beta actin NAIVE SHAM SNL D28 A1 B1 NAIVE SHAM SNL 0 50 100 150 200 CX3CR1/beta actin (% of naive) B2 NAIVE SHAM SNL 0 50 100 150 200 CX3CR1/beta actin (% of naive) ** A2
Fig. 5 Increased fractalkine receptor protein level in the contralateral thalamus only 14 days after spinal nerve ligation. Western blot (A1 and B1) and densitometric analysis (A2 and B2) were performed on contralateral thalamic protein extracts from naïve (n = 4), sham (n = 5), and SNL (n = 6) animals 14 (A1 and A2) or 28 (B1 and B2) days after the beginning of the experiments. CX3CR1 (fractalkine receptor) protein level is significantly increased in SNL animals compared to naïve rats 14 days after the beginning of the experiment (A2: one-way ANOVA F(2, 12) = 7.877, p = 0.0065) while no significant difference is found 28 days after the beginning of the experiment (B2: one-way ANOVA F(2, 12) = 1.645, p = 0.2336). Post hoc test (Tukey’s multiple comparison test): **p < 0.01
A B1 B2 C1 C2 D1 D2 E1 E3 E2 F1 F2
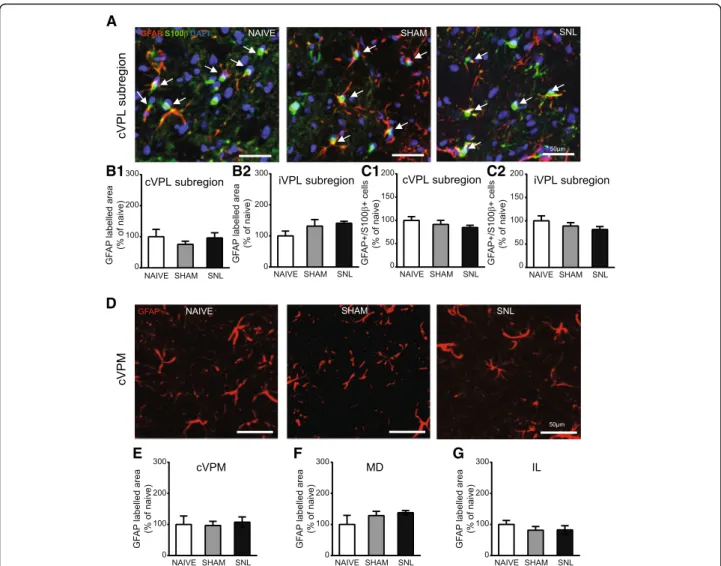
cell counts. Both stereological counting and conven-tional counts led to the same results for the iba-1-positive cells 14 and 28 days after the beginning of the experiments. Consequently, we only performed conventional counts in the VPL subregion for the GFAP-S100β-positive cells.
Representative microphotographs of GFAP and S100β immunostaining in the contralateral VPL subregion of naïve, sham, and SNL animals 14 days after the beginning
of the experiments are displayed in Fig.9A. Morphometric
analysis revealed that the GFAP-immunolabeled area remained unchanged upon experimental conditions in the
contralateral (Fig.9B1) and ipsilateral (Fig.9B2) VPL
sub-region. Same results were obtained when the analysis was performed in the whole VPL (data not shown). Likewise, the GFAP/S100β/DAPI-positive cell number was un-affected by the experimental conditions in the
contralat-eral (Fig. 9C1) and ipsilateral (Fig. 9C2) VPL subregion.
Similarly, GFAP-immunostained surface remained un-changed upon experimental conditions 14 days after the beginning of the experiments in the contralateral VPM
(representative pictures: Fig. 9D; quantification: Fig. 9E),
in the MD (Fig.9F), and in the IL (Fig.9G).
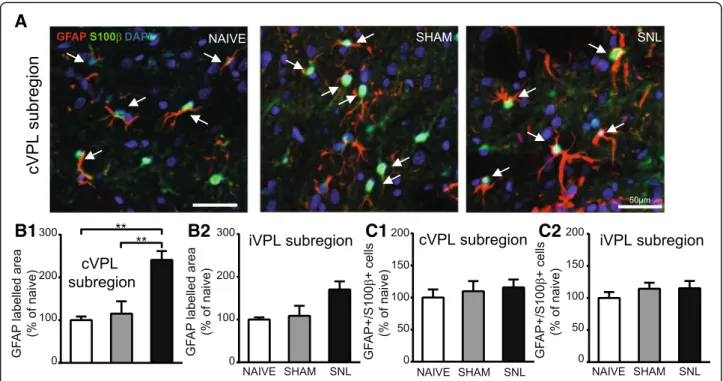
By contrast, 28 days after the beginning of the experi-ments, the GFAP-immunostained area was significantly increased in the contralateral VPL subregion of SNL ani-mals compared to naïve and sham rats (nearly 2.5 times
greater; representative pictures in Fig.10A and
quantifi-cation in Fig.10B1). Even though a similar tendency was
found in the ipsilateral VPL subregion, this did not reach
a statistical significance (Fig. 10B2). However, GFAP/
S100β/DAPI-positive cell number remained unchanged
upon experimental conditions in the contralateral
(Fig. 10C1) and ipsilateral (Fig.10C2) VPL subregion. A
significant increase in GFAP-immunostained area 28 days
after the beginning of the experiments was also found in the contralateral VPM (2.75 times greater; representative
pictures: Fig. 11A1; quantification: Fig. 11A2), in the
MD (3.1 times greater; representative pictures: Fig.11B1;
quantification: Fig. 11B2), and in the IL (2.3 times
greater; representative pictures: Fig.11C1; quantification:
Fig. 11C2) of SNL animals compared to naïve rats. In
the contralateral VPM, GFAP-immunostained area was also significantly higher in SNL rats compared to sham
rats (1.9 times greater; Fig.11A2).
In conclusion, we found that GFAP immunostaining area was broadly increased in thalamic nuclei of SNL an-imals as compared to the one of naïve rats 28 days after the beginning of the experiment. In the VPL, this was not accompanied by an increased number of GFAP/
S100β immunopositive cells (see summary Fig.12).
Discussion
The main goal of this study was to investigate the involvement of thalamic astrocytes and microglia in the onset and maintenance of neuropathic pain. By correlating pain behavior with changes in astrocytes and microglia morphology, number and molecular repertoire 2 and 4 weeks after a unilateral L5/L6 spinal nerve ligation, we found an early transient and spatially restricted microglial alteration in VPL followed by a late and widespread
astro-cytic activation in the thalamus of SNL animals (Fig.12).
New insights in SNL pain behavior
We found that SNL animals developed static mechanical allodynia and hyperalgesia as well as reduction in body weight borne on the ligated limb. These symptoms were accompanied by a redistribution of the body load on the unoperated hind limb as well as the front limbs. In
(See figure on previous page.)
Fig. 6 Decreased iba-1 immunostaining and decreased number of iba-1-positive cells in the contralateral VPL 14 days after spinal nerve ligation. Panel A illustrates the delineation of the ventral posterolateral thalamic nucleus (VPL; outlined in red) with its subregion that receives information from the hind limb (VPL subregion; outlined in yellow) on a rat brain section treated for visualizing acetylcholinesterase activity. The outlines were then applied on an adjacent section treated for the immunohistofluorescent detection of the iba1. Microphotographs in B1 and B2 are examples of iba-1 immunostaining (green) and DAPI staining (deep blue) in the contralateral (cVPL, B1) and ipsilateral (iVPL, B2) subregion of the VPL in naïve, sham, and SNL animals 14 days after the beginning of the experiments. White arrows point at iba-1/DAPI-positive cells (part of the cell body appears in turquoise, that is to say mix of green and deep blue). Note that there is less iba-1 immunostaining and less iba-1/DAPI-positive cells in the cVPL subregion of SNL rats. Morphometric analysis conducted on the VPL (C1 and C2) and on the VPL subregion (D1 and D2) reveals that iba-1 immunofluorescent surfaces (expressed as percentage of naïve values) are significantly decreased in the cVPL (C1: one-way ANOVAF(2, 13) = 5.151,p = 0.0225) as well as in the cVPL sub-region (D1: one-way ANOVA F(2, 13) = 4.716, p = 0.0288) in the SNL rats (n = 6, 3 slices per animal) compared to naïve (n = 4, 3 slices per animal) and sham (n = 6, 3 slices per animal) rats. This decrease is also found in on the ipsilateral side (C2 and D2) but only reaches statistical significance in the iVPL of SNL rats compared to naïve rats (C2: one-way ANOVAF(2, 13) = 4.183, p = 0.0396). Quantification of iba-1/DAPI-positive cells in the VPL (E1 and E2; cell number per volume unit expressed as percentage of naïve values) by using an optical disector method of stereological counting and in the VPL subregion by using a conventional method (F1 and F2; cell number per surface area unit expressed as percentage of naïve values) reveals that the number of iba-1/DAPI-positive cells is significantly reduced in the cVPL (E1: one-way ANOVAF(2, 13) = 6.669, p = 0.0102) as well as in the cVPL subregion (F1: one-way ANOVA F(2, 13) = 4.679, p = 0.0295) of SNL rats compared to the one of naïve rats. No significant difference is found in the iVPL (E2: one-way ANOVAF(2, 13) = 3.784, p = 0.0507) and the iVPL subregion (F2: one-way ANOVAF(2, 13) = 2.878, p = 0.0923). The number of iba-1/DAPI-positive cells in the cVPL is correlated to the ambulatory pain. The less weight the animal bears on its ipsilateral hind paw, the lower the number of iba-1/DAPI positive cells is (E3). Post hoc test (Tukey’s multiple comparison test): *p < 0.05; **p < 0.01
addition to these classical pain symptoms, we revealed a previously undescribed compensatory mechanism. In-deed, a transient pronounced increase of pain threshold was observed on the unoperated hind limb of SNL ani-mals 2 weeks after surgery. As it has been suggested that the mechanism involved in the onset of neuropathic
pain may differ from those involved in maintenance [10,
20,22], it is tempting to speculate that, in our model, a
compensatory mechanism linked/related to the initiation of neuropathic pain takes place to decrease the pain sen-sitivity of this limb. Once the switch has been operated between initiation and maintenance, this compensatory hypoalgic behavior would disappear.
Since the initial description of the SNL model [28],
SNL and sham groups were mainly used in the litera-ture. As sham animals underwent surgery including re-moval of L6 transverse process and isolation of L5 and L6 spinal nerves, we also included naïve rats in order to assess the impact of the surgery on the pain behavior. Indeed, it is well known that incision that includes skin and muscles is able to cause a mechanical hyperalgesia
lasting for up to 3 days after surgery [49]. In our study,
we found a transient mechanical static hyperalgesia on the operated hind paw of sham rats 2 weeks after the be-ginning of the experiments. Therefore, the hyperalgesia lasts longer than following a simple incision. Indeed, our
A1
B
C
D
E
A2
Fig. 7 Unaltered iba-1 immunostaining in the contralateral VPM (cVPM) and MD and intralaminar thalamic nuclei (IL) 14 days after spinal nerve ligation. Microphotographs in A1 and A2 illustrate the delineation of the ventral posteromedian thalamic nucleus (VPM; outlined in white in A1) and the mediodorsal thalamic nucleus (MD; outlined in purple in A2) and the group of the intralaminar thalamic nuclei (outlined in blue in A2) that includes the central medial thalamic nucleus (CM), the paracentral thalamic nucleus (PC), and the central lateral thalamic nucleus (CL) on a rat brain section treated for visualizing acetylcholinesterase activity. The outlines were then applied on an adjacent section treated for the immunohistofluorescent detection of the iba1. Microphotographs in B are examples of iba-1 immunostaining (green) in the cVPM of naïve, sham, and SNL animals 14 days after the beginning of the experiments. Morphometric analysis (SNL and sham:n = 6; naïve: n = 4; 3 slices per animal) reveals that the treatment does not alter the iba-1 immunofluorescent surfaces in the cVPM (C: one-way ANOVAF(2, 13) = 4.244, p = 0.0381 but no significant differences with the Tukey’s multiple comparison test), MD (D: one-way ANOVA F(2, 13) = 0.07, p = 0.9322), and IL (E: one-way ANOVA F(2, 13) = 0.6494, p = 0.5385)
A
F
G H I
B1 B2 C1 C2
D1 D2 E1 E2
Fig. 8 Unaltered iba-1 immunostaining in the VPL, cVPM, MD, and IL as well as unaltered number of iba-1-positive cells in the VPL 28 days after spinal nerve ligation. Microphotographs are examples of iba-1 immunostaining (green) and DAPI staining (deep blue) in the cVPL (A) in naïve, sham, and SNL animals 28 days after the beginning of the experiments. White arrows point at iba-1/DAPI-positive cells (part of the cell body appears in turquoise, that is to say a mix of green and deep blue). Morphometric analysis conducted on the VPL (contralateral, B1: one-way ANOVAF(2, 11) = 0.489, p = 0.626; ipsilateral, B2: one-way ANOVAF(2, 11) = 0.7396, p = 0.4996) and on the VPL subregion (contralateral, C1: one-way ANOVA F(2, 11) = 0.3216, p = 0.7316; ipsilateral, C2: one-way ANOVAF(2, 11) = 0.6745, p = 0.5293) reveals that iba-1 immunofluorescent surfaces are unchanged under treatment (naïve and SNL:n = 5, sham: n = 4, 3 slices per animal). Quantification of iba-1/DAPI-positive cells in the VPL (contralateral, D1: one-way ANOVA F(2, 11) = 0.5755, p = 0.5785; ipsilateral, D2: one-way ANOVAF(2, 11) = 0.1196, p = 0.8884) by using an optical disector method of stereological counting (cell number per volume unit) and in the VPL subregion (contralateral, E1: one-way ANOVAF(2, 11) = 0.4605, p = 0.6426; ipsilateral, E2: one-way ANOVA F(2, 11) = 3.934, p = 0.0514) by using a conventional method (cell number per surface area unit) reveals no significant difference between experimental conditions. Microphotographs in F are examples of iba-1 immunostaining (green) in the cVPM in naïve, sham, and SNL animals twenty eight days after the beginning of the experiments. Morphometric analysis reveals that the treatment does not alter the iba-1 immunofluorescent surfaces in the cVPM (G: one-way ANOVAF(2, 11) = 0.04787, p = 0.9535), MD (H: one-way ANOVA F(2, 11) = 0.1803, p = 0.8375), and IL (I: one-way ANOVA F(2, 11) = 0.05713,p = 0.9447)
result is in agreement with the study of Kosta and col-laborators in which they described a hyperalgesia in ani-mals 2 weeks after a L5-S1 laminectomy including removal of L6 transverse and L5-L6 spinous processes
without ganglionectomy [50]. Therefore, we show that,
in addition to incision, removal of L6 transverse process is able to induce a static mechanical hyperalgesia that is no longer present 4 weeks after the surgery. It should be noted that we could not detect any allodynia or ambula-tory pain in sham animals compared to naïve, arguing
for the development of a moderate pain in sham ani-mals. However, the fact that sham animals display mech-anical hyperalgesia at day 14 suggests that potential glial impairment resulting from surgical procedures (i.e., even skin and muscle incisions are able to induce activation
of spinal astrocytes and microglia [51]) may preclude the
detection of further changes due to spinal nerve ligation. This may be further amplified by the fact that individual marker of glial impairment may reach their expression plateau at different levels of pain severity.
A
D
E F G
B1 B2 C1 C2
Fig. 9 Unaltered GFAP immunostaining in the VPL, cVPM, MD, and IL and unaltered number of GFAP/S100β-positive cells in the VPL 14 days after spinal nerve ligation. Microphotographs in A are examples of GFAP (red) and S100β (green) immunostaining as well as DAPI staining (deep blue) in the cVPL subregion in naïve, sham, and SNL animals 14 days after the beginning of the experiments. White arrows point at GFAP/S100 β/DAPI-positive cells (part of the cell body appears in turquoise (green and deep blue) and is closed to at least two thick GFAP-labeled fibers). Morphometric analysis conducted on the contralateral (B1: Kruskal-Wallis testH(2) = 1.256, p = 0.5337) and ipsilateral (B2: one-way ANOVA F(2, 12) = 1.906, p = 0.1911) VPL subregion reveals that GFAP immunofluorescent surfaces are unchanged under treatment (naïve:n = 4; sham: n = 5; SNL: n = 6; 3 slices per animal). Quantification of GFAP/S100β/DAPI-positive cells in the contralateral (C1: one-way ANOVA F(2, 12) = 1.402, p = 0.2838) and ipsilateral (C2: one-way ANOVAF(2, 12) = 1.087, p = 0.3684) VPL subregion reveals no significant difference between experimental conditions. Microphotographs in D are examples of GFAP immunostaining (red) in the cVPM of naïve, sham, and SNL animals 14 days after the beginning of the experiments. Morphometric analysis reveals that the treatment does not alter the GFAP immunofluorescent surfaces in the cVPM (E: Kruskal-Wallis testH(2) = 1.148, p = 0.5634), MD (F: one-way ANOVAF(2, 12) = 1.384, p = 0.2879), and IL (G: one-way ANOVA F(2, 12) = 0.5574, p = 0.5869)
Complex microglial alteration in the VPL of SNL animals Concerning the microglia, our immunohistochemical re-sults show that the number of iba-1 immunopositive cells and the iba-1-immunostained area are specifically decreased in the VPL 2 weeks after the spinal nerve ligation. These results are particularly interesting, as they go against some previously published evidence. Indeed, it has been shown that mRNA expression or immunore-activity for some microglial markers is, on the contrary, increased in the VPL following sciatic nerve transection
[27] or chronic constriction injury of the sciatic nerve
[25,52, 53]. It is important to note that microglial
acti-vation was found in the thalamus 14, 16, 28, or 34 days
after the peripheral nerve injury compared to naïve [27,
52] or sham animals [53]. Furthermore, a study
examin-ing patients sufferexamin-ing from lumbar chronic pain since at least 2 years has reported evidence for microglial
activa-tion in the thalamus [54]. Therefore, even if we could
not definitively rule out the possibility that we missed an early time point of microglial activation at the thalamic level by assessing glial reactivity at 2 and 4 weeks after the spinal nerve ligation, our results clearly provide evi-dence for a new type of VPL microglial alteration in
neuropathic condition. We are confident in our results for three main methodological reasons: (1) cells were counted using two distinct methods (conventional count and an optical dissector method) that lead to the same results, (2) the decreased number of microglial cells was found within the VPL as well as within the subregion of the VPL that receives nociceptive information from the operated hind limb, and (3) the decreased number of microglial cells was paralleled by the decreased munostained area. Furthermore, the decreased iba-1-im-munostained area was specifically found in the VPL (not in the VPM, DM, and IL) suggesting that this microglial alteration was not generalized to the whole thalamus. Fi-nally and more interestingly, the number of microglial cells was negatively correlated with the ambulatory pain, suggesting a possible link between the number of micro-glial cells and pain symptoms.
Our results raise intriguing issues. For instance, the decreased microglial immunoreactivity is not found any more after 4 weeks of spinal nerve ligation. Such a tran-sient decrease in microglial cell number may be ex-plained if we postulate (i) a transient downregulation of iba-1 expression (below the immunohistochemichal
A
B1
B2
C1
C2
Fig. 10 Increased GFAP immunostaining and unaltered number of GFAP/S100β-positive cells in the VPL 28 days after spinal nerve ligation. Microphotographs are examples of GFAP (red) and S100β (green) immunostaining as well as DAPI staining (deep blue) in the cVPL subregion (A) in naïve, sham, and SNL animals 28 days after the beginning of the experiments. White arrows point at GFAP/S100β/DAPI-positive cells (part of the cell body appears in turquoise (green and deep blue) and is closed to at least two thick GFAP-labeled fibers). Note that the GFAP-labeled fibers are thicker in the cVPL subregion of SNL rats but that there is the same amount of GFAP/S100β/DAPI-positive cells. Morphometric analysis reveals that GFAP immunofluorescent surfaces are significantly increased in the cVPL subregion (B1: one-way ANOVAF(2, 12) = 12.62, p = 0.0011) of SNL rats (n = 6, 3 slices per animal) compared to the ones of naïve (n = 4, 3 slices per animal) and sham (n = 5, 3 slices per animal) rats but that is not the case in the iVPL subregion (B2: one-way ANOVA F(2, 12) = 4.246, p = 0.0403, but no significant differences with the Tukey’s multiple comparison test). Quantification of GFAP/S100β/DAPI-positive cells in the contralateral (C1: one-way ANOVAF(2, 12) = 0.5752, p = 0.5763) and ipsilateral (C2: one-way ANOVA F(2, 12) = 0.285, p = 0.7566) VPL subregion reveals no significant difference between experimental conditions. Post hoc test (Tukey’s multiple comparison test): **p < 0.01