Desalination of brackish groundwater to
improve water quality and water supply
The MIT Faculty has made this article openly available.
Please share
how this access benefits you. Your story matters.
Citation
Ahdab, Yvana D. and John H. Lienhard. "Desalination of brackish
groundwater to improve water quality and water supply." Global
Groundwater: Source, Scarcity, Sustainability, Security and
Solutions, edited by Abhijit Mukherjee et al, Elsevier, forthcoming. ©
2021 Elsevier
As Published
https://www.elsevier.com/books/global-groundwater/
mukherjee/978-0-12-818172-0
Publisher
Elsevier
Version
Author's final manuscript
Citable link
https://hdl.handle.net/1721.1/126566
Terms of Use
Creative Commons Attribution-Noncommercial-Share Alike
Desalination of brackish groundwater to improve water
quality and water supply
Yvana D. Ahdaba, John H. Lienharda
aRohsenow Kendall Heat Transfer Laboratory, Massachusetts Institute of Technology, 77
Massachusetts Avenue, Cambridge, MA 02139, United States
Abstract
Brackish groundwater desalination has and will continue to play a critical role in improving
water quality and water supply in many parts of the world. While numerous methods exist for
desalination, membrane-based desalination technologies are used without exception in treating
brackish groundwater. The two most widely adopted processes are reverse osmosis
(pressure-driven desalination) and electrodialysis (electric potential-(pressure-driven desalination). Selection of
the appropriate technology is made based on feedwater and target product water composition
for a particular application, as well as environmental and cost considerations. This
chap-ter outlines the key components of a typical brackish groundwachap-ter desalination facility that
uses reverse osmosis or electrodialysis, including required pretreatment of source water and
post-treatment of product water. Desalination plant energy consumption and economics are
discussed. Brine disposal is highlighted as a critical cost driver for inland brackish
ground-water desalination. Environmentally-friendly alternatives to current brine disposal methods
and conventional energy sources are considered. Because geography is a key consideration in
desalination decision-making, regional and national trends in desalination capacity, spending,
technology, and source water type are also investigated. The national trends focus on the
1. Introduction
Water scarcity around the world is leading to a greater dependence on groundwater to meet freshwater demand [1]. Despite the fact that most ground-water resources are brackish (500 mg/L ≤ total dissolved solids (TDS) ≤ 5,000 mg/L) [2], brackish groundwater remains a largely untapped resource in many parts of the world. In the U.S., for example, the volume of BGW (1,000 mg/L ≤ TDS ≤ 10,000 mg/L) was measured to be over 35 times the amount of fresh groundwater used annually [3]. Increased exploitation of brackish groundwater may relieve some of the mounting pressure on freshwater supplies, particularly in drier landlocked regions. Desalination can be employed to reduce the salt concentration in brackish groundwater to meet the needs of freshwater applica-tions.
1.1. Brackish groundwater composition
All naturally occurring waters contain some level of total dissolved solids (TDS), a measure of the concentration of all inorganic and organic dissolved substances, including salts, minerals and metals. TDS determines whether a surface water or groundwater resource is fresh or brackish. Brackish groundwa-ter contains a TDS greagroundwa-ter than freshwagroundwa-ter but less than seawagroundwa-ter. A variety of classification schemes are used to categorize waters with different TDS. Brackish groundwater falls within the 500 mg/L - 20,000 mg/L TDS range, with some classifications placing the upper TDS limit at 10,000 mg/L [3]. In comparison, seawater typically contains a TDS greater than 25,000 mg/L.
Unlike seawater, both the TDS and major ion constituents of brackish water vary greatly with depth of the well below the land surface and with geographic loca-tion, as a result of local geologic, hydrologic and climactic conditions. Ground-waters containing higher TDS are more often drawn from greater depth below the land surface [3]. These variations are critical in determining the feasibility, required treatment and associated cost of brackish groundwater usage. Because
a specific location may correspond to a particular BGW composition, location is crucial in water resource planning and treatment system selection and design.
Brackish groundwater must be treated before use in applications that require high water quality, such as drinking water and irrigation. Water used for public supply, which fulfills the majority of the population’s daily water needs, must not include high dissolved solids concentration or significant concentrations of specific constituents: the U.S. Environmental Protection Agency recommends that drinking water contain less than 500 mg/L of TDS to ensure public health [4]. Water used for irrigation of agricultural crops, the largest consumer of our water supplies globally, is limited by dissolved solids concentration, the relative amount of solutes, and specific constituents that can be damaging to crops.
1.2. Desalination
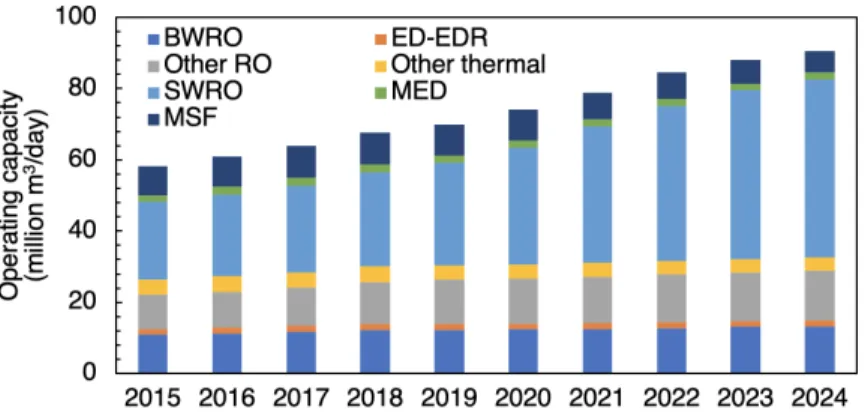
Desalination is a water treatment that removes dissolved solids and other minerals from a water resource that would otherwise be unsuitable for use in freshwater applications. Desalination has been on the rise since the 1960s, and this trend is expected to continue into the 2020s (Figure1). Today, the global desalination operating capacity is approximately 70 million m3/day [5]. It is
primarily used in treating seawater (61% of desalinated water) and brackish water (21% of desalinated water), the majority of which is groundwater [5,6]. Its various end uses include municipal (e.g., drinking water), industry, power, and irrigation. Brackish water desalination requires less energy and can recover more product water for a given amount of feedwater than seawater desalination.
Commercial desalination technologies can be divided into two main categories: thermal and membrane. Thermal technologies, most commonly multi-stage flash distillation (MSF) and multiple-effect distillation (MED), mimic the hy-drological cycle of evaporation and condensation by heating salty water to form water vapor that is then condensed into fresh water. Membrane processes, such as reverse osmosis (RO) and electrodialysis (ED, EDR), use a semi-permeable
membrane that prevents or allows the passage of certain salt ions. The driving force for transport can be a pressure, electrical potential, temperature or concen-tration gradient. Due to their increased energy efficiency and cost effectiveness, membrane processes have surpassed the once dominant thermal processes in terms of desalination capacity (Figure1).
To treat brackish groundwater, membrane desalination technologies, primar-ily RO and ED, are used without exception [7, 8, 9]. Thermal processes are not utilized, primarily because their energy requirements are independent of salinity, unlike membrane processes in which energy requirements decrease with salinity. RO is overwhelmingly the dominant desalination technology, including for brackish water treatment. In 2019, RO and ED produced 76% and 2.4%, re-spectively, of desalinated water globally [5]. Around a quarter of RO generated water and well over half of ED generated water originated from brackish water [5,6].
Figure 1: Operating desalination capacity from 2015–2019 and expected operating desalination capacity from 2020–2024. A breakdown of operating capacity by plant (RO, ED or EDR, MSF, MED, Other) and feedwater (brackish water = BW, seawater = SW) is shown. Data is from DesalData online database [5].
The remainder of this chapter is divided into two sections. The first section focuses on brackish groundwater desalination technologies, including associated
energy consumption, cost and environmental impact. The second section exam-ines regional and national variations in desalination capacity, technology, feed-water type, and expenditure. In particular, trends in the U.S., Saudi Arabia, Australia, China, Spain, and India are investigated.
2. Desalination process
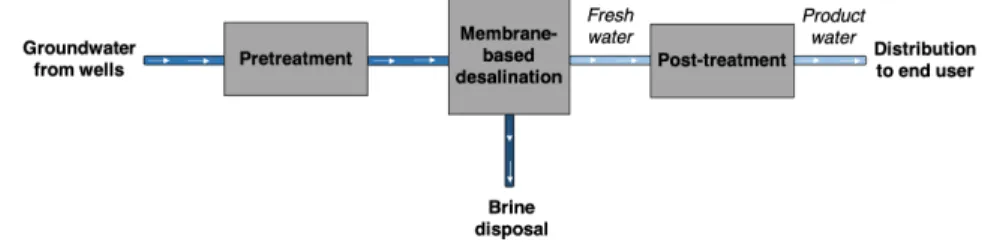
A brackish groundwater desalination plant is typically composed of six key stages (Figure2): 1) groundwater is pumped from wells; 2) the raw water under-goes pretreatment, depending on its composition, to reduce membrane fouling; 3) the pretreated water is fed into the desalination stage (RO, ED), which yields desalinated water (low in salinity) and brine (concentrated in salinity); 4) the brine is disposed of or further concentrated and dried to achieve Zero Liquid Discharge; 5) the desalinated water is post-treated; and 6) final product water is distributed to the end consumer or a storage tank using service pumps.
This section provides a detailed overview of these desalination plant stages. Membrane fouling, RO and ED systems, including corresponding pre-treatment and post-treatment, plant energy consumption and cost data, bring manage-ment, emerging desalination technologies, and renewable coupled desalination are discussed.
Figure 2: A process diagram for a typical brackish groundwater plant comprises: groundwater pumping, pretreatment, electricity-driven (e.g., pump or power supply) desalination, brine disposal, post-treatment, and distribution stages.
2.1. Membrane fouling and pretreatment
Depending on feedwater composition and membrane type, several constituents can result in membrane contamination, which is referred to as fouling. Fouling reduces membrane efficiency, resulting in a shorter membrane lifetime, more fre-quent cleaning and a decrease in recovery rate. Recovery rate is defined as the fraction of freshwater produced from a given amount of feedwater. The primary types of fouling in membrane desalination systems are scaling and biofouling. Scaling occurs due to the precipitation of inorganic salts, such as carbonate, sulfates, and silica, from the feedwater onto the membrane surface. Brackish water RO is especially prone to membrane scaling [7,9]. Biofouling arises from the growth of bacteria on the membranes, which depends on temperature, pH, dissolved oxygen and composition of feedwater. In some cases, high concen-trations of suspended and colloidal matter in the feedwater block the feed flow channels in the membrane elements. Pretreatment of desalination source wa-ter before it enwa-ters a membrane is required to minimize the fouling potential, extend membrane life and maximize recovery rate. Pretreatment can involve chemical processes, physical processes or a combination of the two. The extent of pretreatment required in brackish desalination facilities is less than that of seawater, due to the lower fouling potential of many groundwater sources.
2.2. Reverse Osmosis
Reverse osmosis (RO) uses a semipermeable membrane that enables the pas-sage of water, while rejecting salts, under an applied pressure. It represents the state-of-the-art desalination technology for brackish water applications, because it can reject a variety of contaminants in a single process with lower energy con-sumption. Aside from raw water intake and product water conveyance, an RO facility is comprised of pretreatment; desalination modules with RO membranes; a high pressure pump to drive desalination; post-treatment; and, in some cases, an energy recovery device that depressurizes the brine leaving the system.
of organics, algae, bacteria, particulates and other foulants. The most common pretreatment method is the chemical addition of antiscalants and acid to pre-vent the formation of pH-dependent membrane scaling, followed by cartridge filters to remove particulates that will plug or foul membranes. In some cases, more pretreatment may be necessary to control iron and manganese, using oxi-dation/filtration pretreatment, or to reduce sand loading from wells, using sand separators or strainers.
Desalination mechanism. A schematic drawing of the RO desalination mech-anism is shown in Figure3. The natural osmotic pressure of a saline solution will drive water from the low to high solute (salt) concentration side of a semiper-meable membrane. RO uses a high-pressure pump to apply a hydraulic pressure greater than the osmotic pressure to the saltier side. The applied pressure re-quired for brackish water typically ranges from 17–27 bars (seawater: 55–82 bar) [8]; water higher in salinity will require a higher hydraulic pressure and will consume more energy to overcome the osmotic pressure. Under the applied pressure, water is forced through the membrane to the low solute concentration side. Salt ions almost entirely remain on the high concentration side, although some salt leakage from high to low solute concentration will occur due to diffu-sion that results from the salinity gradient across the membrane. RO yields a freshwater stream (permeate) and a concentrated solution (brine or concentrate) on the high-pressure side of the membrane.
Figure 3: A schematic drawing of the RO desalination mechanism. An applied pressure forces water to flow from the high to the low solute concentration side.
Membranes. RO membranes can be broadly categorized as low pressure elements (brackish water) and high pressure elements (seawater). Several types of membranes are available on the market. The two most commonly used membrane configurations are hollow fiber1 and spiral wound2 in a cross-flow
filtration. In cross-flow, the pressurized water flows parallel to, rather than perpendicular to, the membrane surface in order to assist in the removal of con-centrated salts from the surface; this configuration reduces the rate of fouling and salt leakage into the permeate from diffusion. Key RO membrane param-eters include permeability (i.e., the rate of salt diffusion across the membrane) and rejection (i.e., the quantity of salt rejected from the feedwater). These vary significantly with membrane type. Current brackish RO membranes remove be-tween 98 and 99.2% of TDS from the feedwater and are designed to produce a permeate of approximately 500 mg/L [9]. They have a life expectancy of 2-5 years [7, 9]. Improvements in these membranes continue to simultaneously re-duce desalination energy requirements and the rate of fouling.
System design. Typically six to eight membrane modules are placed in series within a fiberglass pressure vessel. RO plants are often composed of two to three stages in order to maximize recovery rate. In these multi-stage configurations, the brine from two first-stage pressure vessels will serve as feedwater to a single second stage and so on. The recovery rate of brackish water RO systems ranges from 75% to 85% [11], resulting in a concentrated brine stream that must be disposed of (see Section2.6for details). Almost all systems are single pass (i.e., the feedwater is sent through the RO unit once), with the exception of facilities treating highly brackish water.
1Hollow fiber modules are comprised of bundles of fibers with diameters of 200 - 2500 µm
[10]. The ends of these bundles are potted in an epoxy or polyurethane resin and cut open to expose the lumens of the fibers.
2Spiral wound modules consist of multiple flat sheet membranes separated by a porous
Energy recovery devices. Applying an external pressure in excess of the osmotic pressure requires a significant amount of energy, some of which remains in the pressurized brine stream leaving the last RO stage. Energy recovery de-vices (ERDs) can be used to recover energy from this pressurized brine. While ERDs are used in almost all seawater facilities, their implementation in brackish facilities is not commonplace. Brackish water RO has a lower pressure require-ment and a higher recovery rate than seawater RO, which results in a smaller amount of recoverable energy in the brine stream. However, recent develop-ments in ERDs for low pressure applications suggest that even a small amount of energy recovery would result in positive returns for brackish RO plants [7]. Consequently, ERDs are increasingly incorporated into brackish water facilities. The devices are either positive displacement, e.g., pressure exchangers, or cen-trifugal, e.g., the directly couple turbocharger, which is the most widely adopted ERD in brackish water facilities.
Post-treatment. Following the desalination process, the product water is often low in alkalinity, hardness and pH. Post-treatment may be required to re-move dissolved gases (e.g., hydrogen sulfide), stabilize the product water, and/or further disinfect the product water. pH control minimizes corrosion of piping, tanks, and pumps in distribution networks. Air-stripping towers, also known as degasifiers or decarbonators, increase pH through the removal of dissolved carbon dioxide and remaining sulfides. The addition of lime or calcium chloride or blending with raw water provides stable hardness in the product water. Chlo-rine gas is used for primary disinfection and sodium hypochlorite for secondary disinfection.
2.3. Electrodialysis
Electrodialysis reversal (referred to as ED or EDR throughout this chap-ter) is an electrochemical separation process that removes salt ions from a given feedwater, unlike RO which strives to keep salt ions in the feedwater. It relies on semipermeable, ion-exchange membranes that enable the passage of ions with a
particular charge. Aside from source water intake and product water distribu-tion, an EDR plant consists of pretreatment; a membrane stack for desalination; a direct-current power supply to drive desalination; a low-pressure circulation pump to flow water through the desalination system; and post-treatment. While RO is used across the brackish groundwater salinity range, EDR is typically lim-ited to brackish waters containing a TDS that is less than 5,000 mg/L for cost reasons [7,8]. In recent years, the market share of EDR brackish water desali-nation has diminished due to improvements in RO performance and decreases in RO membrane cost.
Pretreatment. Because EDR systems allow for salt transport and the rever-sal of the direction of such transport, they are generally more robust to fouling than RO. The polarity of the applied voltage potential, which determines the direction of ion transport, is periodically reversed (3 to 4 times per hour) to flush scalants from the membrane surface on the concentrating side. This re-versal lessens the need for continuous chemical feeds and cleanses alternating electrodes (during anodic operation) of acid formation. EDR can also tolerate high concentrations of silica, which are present in many brackish groundwaters, without a significant effect on recovery, unlike RO. However, the addition of ansticalants to control the formation of inorganic scale and cartridge filters to remove suspended solids that can foul the membranes are still required. Depend-ing on source water quality, there may be a need for additional pretreatment, such as conventional coagulation, sedimentation, and filtration.
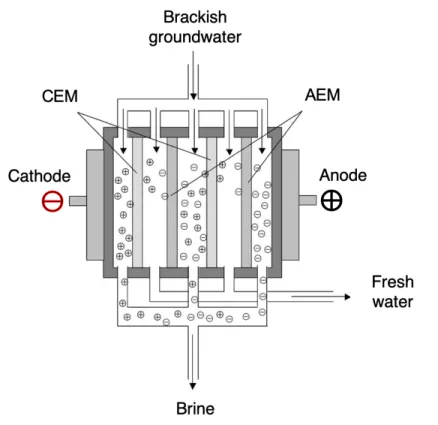
Desalination mechanism. Figure 4 shows an EDR membrane stack com-prised of two membrane pairs (number of membrane pairs in an actual EDR system is usually much larger than two). Each pair consists of two types of ion-exchange membranes in order of alternating charge between two electrodes. Cation-exchange membranes (CEMs) enable the passage of cations, or positively charged ions such as calcium and sodium. Conversely, anion-exchange mem-branes (AEMs) enable the passage of anions, or negatively charged ions such
as sulfate and chloride. Spacers are placed between the membranes, as well as the membranes and electrodes. A voltage potential difference, rather than a pressure as in RO, drives the desalination process. Ion transport through the membrane is induced, with cations and anions migrating towards the cathode and anode, respectively. The alternating membranes trap cations and anions in the brine channel. Caution must be taken in choosing an operating voltage and current for an EDR process below the operating limit that will cause water dissocation. 3
3The dissociation of water occurs when a higher driving voltage must be applied to maintain
a higher current density (applied current per membrane area). This phenomenon arises when ion depletion on the feedwater side of the membrane increases electrical resistance.
Figure 4: A simplified EDR stack comprising two electrodes, two CEMs and two AEMs with brackish groundwater as the feedwater. An applied voltage across the electrodes yields a brine stream and a freshwater stream.
Membranes. EDR systems use flat sheet membranes, reinforced with syn-thetic fiber, that are stacked in a module between electrodes. The number of membranes varies depending on the target membrane area for a given applica-tion. The key EDR membrane properties are charge-based ion selectivity (i.e., selection of specific ions for removal) and electrical conductivity. The mem-branes have a particularly high removal efficiency for multivalent ions, such as calcium and magnesium, although they also remove monovalent ions, such as sodium and chloride under a sufficient applied voltage. Ion selectivity is best at lower salinities (greater than 90% removal of TDS) and decreases at higher salinities, which hampers EDR performance for more saline feedwaters. Mem-branes with low electrical resistance are desired in order to consume less energy
during the desalination process. The life expectancy of EDR membranes far exceeds that of RO, with an average of 10 years for AEMs and 15 years for CEMs [7].
System design. Similar to RO, staging provides the opportunity to achieve the desired level of desalination and to increase recovery rate. ED typically operates with three stages, in which brine from the first stage serves as feed to the subsequent stage. The first stack achieves approximately 60% salt removal, the second 85% and the third up to 94% [7]. ED systems can operate at high water recoveries of 85% to 94% [11].
Post-treatment. Post-treatment requirements for EDR depend on whether the product water will be used for industrial or potable purposes. In indus-trial applications, mixed-bed ion exchange units serve as polishers by removing any remaining ions in the product water. In municipal or potable water ap-plications, disinfection through a small chlorinator or corrosion control is often implemented.
2.4. Energy consumption using conventional energy sources
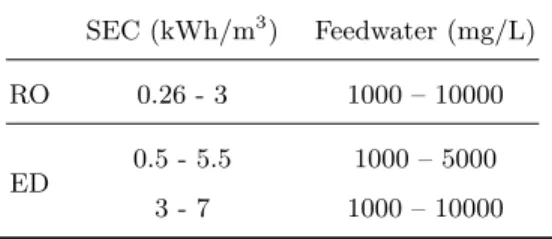
Electricity is the only form of energy required in RO and EDR. Table 1 compiles specific energy consumption (SEC) data in kWh/m3 of produced
wa-ter for RO and EDR brackish wawa-ter facilities. SEC includes the energy required for groundwater pumping, pretreatment, desalination, post-treatment and con-veyance. SEC depends on feedwater salinity and temperature, membrane prop-erties, age of the facility, conveyance of the raw and treated water, and pre-treatment requirements. For example, higher salinities require a greater energy consumption to achieve desalination. For groundwaters containing a TDS of less than 10,000 mg/L and conventional energy sources, the SEC range for RO in the surveyed literature is 0.26 kWh/m3to 3 kWh/m3and for ED is 0.5 kWh/m3to
7 kWh/m3. The SEC of ED for lower salinity groundwaters (1000–5000 mg/L)
a SEC of 0.5 kWh/m3 to 1.8 kWh/m3. SEC greatly increases with TDS in EDR systems. Up to a TDS of 1500 mg/L, EDR SEC is comparable to that of RO. At higher TDS concentrations, EDR energy consumption is significantly greater than that of RO. As a result, EDR is not typically used for brackish waters containing a TDS greater than 5,000 mg/L. Conversely, RO can be used across salinities spanning the brackish and seawater ranges.
Table 1: Specific energy consumption in kWh/m3 of produced water for RO and ED
de-salination of brackish groundwater containing 1000 ≤ TDS ≤ 10000 mg/L. The data is obtained from review papers and reports that compile these values from numerous sources [7,8,12,13,14,15,16,17,18,19,20,21,22,23,24].
SEC (kWh/m3) Feedwater (mg/L)
RO 0.26 - 3 1000 – 10000
ED 0.5 - 5.5 1000 – 5000
3 - 7 1000 – 10000
The breakdown of plant SEC varies on a case-by-case basis depending on plant parameters, such as system design and size and fouling propensity of feed-water. Figure5 reflects the differences in the SEC breakdown of two brackish groundwater RO plants in California. Pretreatment, RO and post-treatment, which are lumped together in available datasets, dominate SEC relative to pumping and conveyance. It should be noted that groundwater pumping en-ergy requirements may increase as fresher and shallower groundwater sources continue to be over-extracted, demanding that wells be deeper. Moreover, con-veyance SEC will vary depending on the distance the water must be pumped to the end user.
Figure 5: SEC breakdown of the Richard A. Reynolds and Chino I brackish groundwater RO plants in California (data from [7]).
The typical SEC of brackish water plants far exceeds the theoretical mini-mum energy required for desalination. Depending on the desalination process used, SEC is usually 5 to 26 times greater than the theoretical minimum [25]. Figure6shows a comparison between least work of separation (LWS), which is equivalent to the theoretical minimum energy required for desalination based on a given input water, and plant SEC for various brackish water RO plants in the U.S. Becdause LWS accounts for the minimum energy required by only the desalination phase, the differences in plant SEC and LWS are likely over-estimated. Nonetheless, the disparity shows that much room still remains for improvement in terms of desalination energy efficiency.
Figure 6: LWS compared to SEC of 10 brackish groundwater RO plants with complete feed-water composition data [7].
2.5. Economics of desalination
The total desalination cost ($/m3 of produced water) is a function of the
capital cost (CAPEX) and operating cost (OPEX) needed to produce one unit (1 m3) of freshwater. CAPEX is comprised of construction (direct capital) and
non-construction (indirect capital) project costs. OPEX includes costs for op-eration and maintenance, energy, labor, chemicals, brine disposal, and plant management. As mentioned previously, RO production costs have decreased in recent years due to membrane advancements, and ED is generally not believed to be cost-effective in treating feedwater with TDS greater than 5,000 mg/L un-less maximizing recovery rate is the priority. ED has some economic potential for partially desalting high salinity feeds, if a pure product is not required [26] or in hybrid RO-ED arrangements [27].
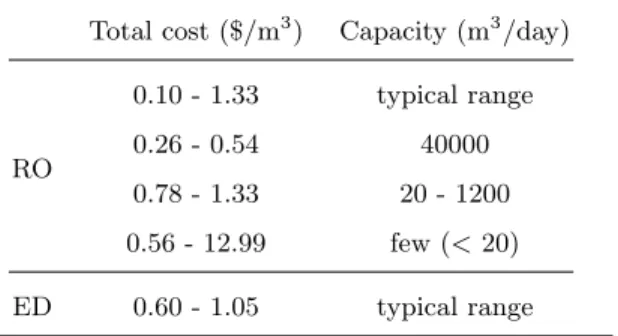
Table2 includes cost data for brackish water RO and ED from the literature. Cost largely depends on feedwater salinity and desalination production capacity. Total RO plant expenses range from 0.20–1.33 $/m3in the surveyed literature.
systems (capacity of 20–1200 m3/day) cost 0.78–1.33 $/m3. This cost increases drastically for RO systems operating at a capacity less than 20 m3/day. Total ED plant expenses range from 0.6–1.05 $/m3, where larger capacity plants also correspond to lower cost.
Table 2: Total cost of brackish groundwater (1000 ≤ TDS ≤ 10000 mg/L) desalination in $/m3
of produced water, using RO and ED and conventional energy sources for a comprehensive range of desalination capacities unless otherwise specified in the capacity column [7,8,12,13,
14,15,16,17,18,19,20,21,22,28,29,30,31,32].
Total cost ($/m3) Capacity (m3/day)
RO 0.10 - 1.33 typical range 0.26 - 0.54 40000 0.78 - 1.33 20 - 1200 0.56 - 12.99 few (< 20) ED 0.60 - 1.05 typical range
Fixed costs (e.g., capital amortization and insurance) dominate the total cost to produce water from brackish groundwater, whereas SEC dominates the cost to produce water from seawater. Greenlee et al. [30] outline a typical cost distribution of brackish water RO plants: capital recovery (54%), SEC (11%, compared to seawater 44%); maintenance (9%), membrane replacement (7%), labor (9%), and chemicals (10%). Veerapaneni et al. [7] report the following cost breakdown: capital recovery (27%), SEC (17%), maintenance (17%), membrane replacement (11%), labor (17%) and chemicals (10%). A key cost driver for inland brackish desalination plants is brine disposal (see Section2.6for details). A comparison of these cost breakdowns is shown in Figure7.
Figure 7: Typical brackish water RO plant cost breakdown from studies conducted by Veer-paneni et al. [7] and Greenlee et al. [30].
2.6. Brine management
Brine is the high salinity byproduct of the desalination process. Its charac-teristics and volume depend on source water and desalination technology used. For example, RO brackish groundwater desalination generates a brine stream that is 4 to 10 times as concentrated in salinity as the feedwater. Current brine disposal methods negatively impact the environment and are limited by high capital costs. The cost of brine disposal is 5% to 33% of the total cost of desali-nation, with inland brackish desalination plants lying in the upper echelon of this range [6, 33]. Consequently, cost-effective and efficient brine management is critical to address environmental pollution. A desirable alternative to liquid brine disposal is fully dewatering the brine to a solid product, so as to achieve Zero Liquid Discharge (ZLD). Table 3 includes information on these disposal and treatment methods, including the treatment principle and the cost. This section elaborates on the results in this table.
Table 3: Brine disposal and treatment principles and cost ($/m3of rejected brine) [30,31,34].
Method Principle Cost ($/m3)
Surface water discharge Discharged into surface water
0.03 - 0.30
Sewer discharge Discharged into existing sewage collection system
0.30 - 0.66
Deep-well injection Injected into porous subsurface rock formations
0.33 - 2.65
Evaporation ponds Evaporated, resulting in salt accumulation at pond bottom
1.18 - 10.04
Land application Irrigates salt-tolerant crops and grasses
0.74 - 1.95
ZLD Concentrated and evaporated to yield freshwater and solid
0.66 - 26.41
2.7. Brine disposal
Current methods for disposing of desalination brine are surface water dis-charge, sewer disdis-charge, deep-well injection, evaporation ponds and land ap-plication. A method is selected depending on a variety of factors, including: brine composition and quantity; geographic location; availability of receiving site (e.g., surface body); and capital and operating costs. Over 90% of seawater desalination plants use surface water discharge back into the ocean, while sewer discharge, deep-injection wells and land application are almost exclusively used by brackish water desalination plants.
The most common practice for inland brackish groundwater facilities is to dis-pose to surface water bodies (47%), sewer discharge (42%) and deep well injec-tion (9%) [7]. The remaining 1% includes other methods, such as evaporation
ponds and thermal treatment. Surface water discharge is proving to have very detrimental environmental effects. For example, annual economic damage due to increased salinity from brine disposal in the Central Arizona Valley and South-ern California coastal plain basin has been estimated to be $15 to $30 million and $95 million, respectively, for each 100 mg/L increase in product water TDS [7]. Even if the brine is diluted using large wastewater effluent flows prior to discharge, the increase in surface water salinity over time results in saliniza-tion of surrounding land, which has economic and environmental repercussions. Deep-well injection, land application and evaporation ponds may be suitable al-ternatives to surface water discharge, largely depending on the local climate and brine volume. Deep well-injection is cost-effective, but risks groundwater pollu-tion. Evaporation ponds are very pricey and can only be used in dry climates with high evaporation rates and land availability. For example, this approach has been used in the U.A.E. and Oman [33]. Land application may be useful for the disposal of small brine volumes to irrigate plants and grasses with high salinity tolerance [34].
2.8. Brine treatment
ZLD combines desalination technologies to produce freshwater and achieve zero liquid waste from a desalination plant. This approach consists of a con-centration stage (membrane technologies), as well as evaporation and crystal-lization stages (thermal technologies). Together, they yield a pure water stream that can be used for drinking water, irrigation, etc., and a compressed solid waste for environmentally-friendly disposal or further processing into a useful material. However, as shown in Table3, the ZLD approach is by far the most costly method and may have indirect environmental impact as a result of its large energy requirements. Further research is being conducted on reducing en-ergy consumption of and incorporating renewable enen-ergy sources and low-grade waste heat in ZLD.
2.9. Desalination using renewable energy sources
Desalination processes typically rely on fossil fuel power plants, which emit greenhouse gases, to meet their energy intensive needs. Rahuy et al. reports that energy consumption accounts for 89% to 99% of desalination’s total envi-ronmental load [7]. Renewable energy sources (wind, solar thermal, geothermal) provide alternatives to mitigate the environmental impact of desalination.4
Despite its promise, renewable energy powered desalination accounted for 1% of the total global installed desalination capacity as of 2016 [36], with photovoltaics (PV) leading at 43%, followed by solar thermal 27%, wind turbine 20% and hy-brid 10% sources [37]. The biggest barrier to adoption has historically been the high capital cost of renewable energy systems in comparison to conventional energy systems. A 2011 study [38] reports water production costs of 2.17–2.41 $/m3for select brackish PV-RO systems (10 m3/day) in Australia, Tunisia,
Jor-dan and the U.S. A 2013 review paper [8] finds that PV-RO (< 100 m3/day),
PV-ED (< 100 m3/day) and wind-RO (50–2000 m3/day) systems require a SEC of 1.5–4 kWh/m3 and water production costs of 6.50–9.10 $/m3, 10.40–11.70 $/m3, and 1.92–5.20 $/m3, respectively. In comparison, RO (20–1200 m3/day) powered by fossil fuels required a SEC of 1.5–2.5 kWh/m3 and water
produc-tion cost of 0.78–1.33 $/m3. ED (“small capacity”) required a SEC of 2.64–5.5
kWh/m3and cost of 0.60 $/m3[8]. According to a 2014 study [39], PV-ED can
cost significantly less than PV-RO for small-scale systems (6–15 m3/day)
us-ing lower salinity feedwater (e.g., 50% cost reduction for 2,000 mg/L feedwater).
However, the variability of energy prices over the past decade is quickly changing
4A 30 kW wind turbine coupled with an RO unit, with an SEC of 4.38 kWh/m3and water
recovery of 30%, can reduce CO2emissions by 80,028 tons annually. Similarly, an analysis by
the U.S. National Renewable Energy Laboratory of a small PV-RO system (5 m3/day driven
by 5 kW PV system) in a remote region of Iraq has shown a 8170 kg reduction in CO2 and
the desalination landscape, as the electricity generated by new solar and wind power projects is becoming cheaper than the electricity generated by new coal and gas power plants around the world. According to a 2019 report from the business intelligence company Bloomberg NEF [40], recent onshore wind and solar power plants have achieved parity with average wholesale prices in parts of Europe, California and China, some of the world’s largest markets. The ex-pected levelized cost of electricity (LCOE) of recently financed solar projects ranges from 0.027–0.036 $/kWh in India, Chile, and Australia [40] and is less than 0.020 $/kWh in California, the U.A.E. and Portugal [41]. In the U.S., the average LCOE of wind power dropped from 0.070 $/kWh in 2009 to less than 0.020 $/kWh in 2017 [42]. The cost-competitiveness of wind and solar power has motivated increased development of large-scale desalination plants powered by renewable energy, in addition to the already implemented small-scale systems5 [35]. Brazil’s Agua Doce Program consists of brackish water desalination sys-tems powered by PV that aim to provide high quality water to 500,000 people in the semi-arid region of Brazil [37]. The Arabian Gulf is increasingly shifting its entire desalination infrastructure to PV, with such RO plants operating at up to 100,000 m3/day in Saudi Arabia [36]. Australia contains wind-powered RO
plants with even larger desalination capacities (e.g., Kurnell-Sydney seawater RO plant with a capacity of 250,000 m3/day [36]).
Renewable energy coupled desalination at small and large scales is expected to only become more economically attractive as the price of fossil fuels continues to increase and that of renewable technologies continues to decline. The Inter-national Desalination Association has set a 2020–2025 target of using renewable energy in 20% of new desalination plants [43].
5Locally available renewable energy sources for desalination can provide a cost-effective
alternative in remote areas that have low population density and weak water and electricity infrastructure.
2.10. Emerging desalination technologies
In addition to the development of new generation membrane materials for de-salination, several desalination technologies that improve water recovery and/or energy consumption are emerging. These technologies are typically variations of RO, including nanofiltration and semi-batch RO.
2.11. Nanofiltration
Nanofiltration (NF) membranes and RO membranes are similar in many ways. Both are pressure-driven membrane desalination technologies that foul easily. Their differences stem from the size and charge of contaminants that each technology is capable of removing. RO membranes effectively remove most ions from product water, with the exception of dissolved gases and some weakly charged molecules that are low in molecular weight. NF is able to reject larger, strongly charged ions (e.g., 90% calcium removal), but it enables more passage of monovalent and smaller molecular weight ions (e.g., 70% sodium removal). The salt rejection of NF membranes is often inadequate in treating brackish groundwater. However, NF requires less energy than RO and consequently has been widely adopted in some parts of the U.S. for brackish groundwater desalination. NF is also often used for softening, i.e., to remove calcium and magnesium (hardness) from a given solution.
2.12. Semi-batch reverse osmosis
The RO systems discussed thus far operate in a continuous mode. In other words, the membranes are treating the same feedwater, so the applied pres-sure to overcome the osmotic prespres-sure is fixed. In semi-batch RO, also known as closed-circuit RO, the brine is recirculated and mixed with the pressurized feedwater in order to reduce the osmotic pressure of the feed over time and the overall energy consumption required for desalination. A variable operating pressure is applied as the feed pressure changes. Brine recirculation allows for over 90% recovery rate for brackish water desalination systems. A SEC of 0.64 – 0.76 kWh/m3has been reported in the literature [44]. Desalitech, LLC, which
has commercialized this technology, claims a 20% energy consumption reduction in semi-batch RO compared to continuous RO [44].
3. Global and national trends in desalination
Location is of the utmost importance in desalination system design and se-lection for a variety of reasons, including the geographic variation in BGW composition and differences in regional water needs and in local costs of energy or electricity. For example, in much of the Middle East (e.g., Saudi Arabia, Israel), desalination is the primary, if not only, option to provide the required water supply. In other countries (e.g., China, Australia, U.S.), desalination provides a water supply that is more reliable, albeit more expensive, than tradi-tional river and aquifer systems. For island users of desalination, such as in the Caribbean, energy is often very expensive compared to the energy costs in large oil-producing countries. This section explores global and national differences in operating and contracted desalination capacities by plant type, feedwater type, and target end use and in capital and operating desalination expenditures an-nually. Results are based on the most up-to-date data from the Global Water Intelligence desalination database [5].
3.1. Global trends
Figure8 shows annual operating capacity and contracted capacity by plant type from 2015 to 2024. The desalination market as a whole is expected to continue on an upward trajectory. Brackish water RO (BWRO) and ED-EDR together comprised 20% of the total operating desalination capacity in 2019. BWRO operating capacity has been and is expected to continue growing from year-to-year, although 2019 experienced a decrease in the annual growth rate from 4.3% (2018 vs. 2017) to 0.9% (2019 vs. 2018). Similarly, BWRO contracted capacity in 2019 reached the lowest level since 2015 (0.37 million m3/day). This
drop may be caused by market changes in China and Saudi Arabia, which are both major players in the desalination space; China is pivoting towards
wastewater reuse, while Saudi Arabia is pivoting towards enhanced transmission and storage infrastructure. ED-EDR annual growth rate in terms of operating capacity was positive in 2015–2018 and negative in 2018–2019. Its growth rate is expected to remain negative, as RO becomes more energy efficient and cost-effective.
(a)
(b)
Figure 8: Annual desalination (a) operating capacity and (b) contracted capacity by plant type from 2015 to 2024.
3.1.1. Annual desalination expenditures
Annual desalination capital and operating expenditures by plant type from 2015 to 2024 can be found in Figure9. In 2019, BWRO and ED CAPEX was $276 million and $54.8 million, respectively; BWRO and ED OPEX was $1,455
million and $216 million, respectively. The OPEX of both technologies remains relatively constant, while the CAPEX varies, across the surveyed time period.
(a)
(b)
Figure 9: Annual desalination (a) capital expenditures and (b) operating expenditures by plant type from 2015 to 2024.
3.1.2. Geographic region
Large numbers of desalination facilities are located in the Middle East and North Africa (MENA), Arab States of the Gulf, Asia/Pacific, Europe, and North America, while relatively few are based in Latin America, Caribbean, and Sub-Saharan Africa (Figure 10). Desalination plants are concentrated on or near the coastline for seawater desalination. Inland desalination plants tend to be smaller in capacity than coastal desalination plants. Today, the MENA and
Arab States of the Gulf contain almost half of global desalination capacity, with Saudi Arabia, U.A.E. and Kuwait serving as major regional and global leaders. The Asia/Pacific region has the next largest desalination regional capacity as a result of China’s market share, followed by North America, almost entirely due to U.S. capacity, and Europe, where Spain is the leader.
Figure 10: The breakdown of operating desalination capacity by geographic region from 2015 to 2024.
3.1.3. Target end use
Desalination provides water for the following sectors in decreasing order: mu-nicipal (e.g., drinking water), industry, power, irrigation and military. Mumu-nicipal desalination plants are located worldwide, particularly in MENA. Compared to MENA, North America, Western Europe, and East Asia and Pacific regions contain a larger proportion of non-municipal desalination plants, because in-dustrial and power sectors constitute large market shares. The few desalination plants in South America and Africa are primarily for industrial use. In Eastern Europe and Central Asia, Sub-Saharan Africa, and Southern Asia, desalination plants are predominantly designed to produce water for industrial and private applications. Figure11 demonstrates the sectoral use of desalinated water an-nually from 2015 to 2024 in terms of industry and utility/other, which includes municipal, power, irrigation, and military.
Figure 11: Sectoral use of desalinated water annually from 2015 to 2024 in terms of industry and utility/other, which includes municipal, power, irrigation, and military.
3.2. National trends
The U.S., China, Saudi Arabia, Australia, and India are the top markets by contracted brackish water capacity (Figure12(a)), while the U.S., Saudi Arabia, China, Spain and Australia are the top markets by brackish water desalination expenditure (Figure 12(b)). Consequently, these six countries are considered leaders in brackish water desalination. The contracted brackish water capacity is expected to decrease in India, Saudi Arabia and China and increase in Australia and the U.S., with the largest projected capacity in the U.S. The annual OPEX from 2020 to 2024 is projected to range from 67% to 97% of the total annual desalination expenditure for brackish water desalination in Australia, Spain, China, Saudi Arabia, and the U.S..
(a)
(b)
Figure 12: Top national markets by (a) contracted brackish water desalination capacity and (b) brackish water desalination CAPEX and OPEX.
Figure13shows the national operating desalination capacities of Australia, Spain, China, Saudi Arabia, U.S. and India as a function of (a) feedwater type, (b) plant type and (c) target end use in 2019. Together, the desalination capac-ity, independent of feedwater, of these nations constitutes over 45% of the global capacity: Saudi Arabia (15.8%), U.S. (11.4%), China 98.8%), Spain (6.1%), India (2.9%) and Australia (1.2%). Feedwater type is divided into three cat-egories: seawater (20,000–50,000 mg/L), brackish water (3,000–20,000 mg/L),
and other (< 3,000 mg/L). The “other” category includes freshwater (< 500 mg/L), wastewater and low salinity brackish water (500–3,000 mg/L). The de-salination freedwater breakdown varies from country to country. For instance, desalinated water in the U.S. predominantly originates from brackish water (500–20,000 mg/L), the majority of which is groundwater, while desalinated water in Saudi Arabia primarily originates from seawater. Across the consid-ered countries, RO is overwhelmingly the dominant technology for both brackish water and seawater, with the exception of Saudi Arabia in which thermal sys-tems play a substantial role. India, China, and Australia primarily use their desalinated water for industrial purposes, while Spain, Saudi Arabia and U.S. primarily use it for other purposes (e.g., municipal, agriculture).
(a)
(b)
(c)
Figure 13: The national operating desalination capacities of the U.S., China, Saudi Arabia, Spain, India and Australia as a function of (a) feedwater type, (b) plant type and (c) target end use in 2019.
4. Acknolwedgments
The authors would like to thank the Bureau of Reclamation under Agreement Number R17AC00135 for funding much of this work and Tom Pankratz from Global Water Intelligence for helpful discussions.
References
[1] A. Mukherjee, B. Scanlon, A. Aureli, S. Langan, H. Guo, A. McKenzie, Global Groundwater: Source, Scarcity, Sustainability, Security and Solu-tions, 1st Edition, Elsevier, 2020, ISBN 9780128181720.
[2] Y. D. Ahdab, G. P. Thiel, J. B¨ohlke, J. Stanton, J. H. Lien-hard, Minimum energy requirements for desalination of brackish groundwater in the united states with comparison to interna-tional datasets, Water Research 141 (2018) 387–404. doi:https: //doi.org/10.1016/j.watres.2018.04.015.
URL http://www.sciencedirect.com/science/article/pii/ S0043135418302999
[3] J. S. Stanton, D. W. Anning, C. J. Brown, R. B. Moore, V. L. McGuire, S. L. Qi, A. C. Harris, K. F. Dennehy, P. B. McMahon, J. R. Degnan, et al., Brackish groundwater in the united states, Tech. rep., US Geological Survey (2017).
[4] Office of Water of the U.S. Environmental Protection Agency, 2018 edition of the drinking water standards and health advisories, Tech. rep., EPA 822-F-18-001, Washington, DC (2018).
[5] Global Water Intelligence, Desaldata online database(2020). URLhttps://www.desaldata.com/
[6] E. Jones, M. Qadir, M. T. van Vliet, V. Smakhtin, S. mu Kang, The state of desalination and brine production: A global out-look, Science of The Total Environment 657 (2019) 1343–1356.
doi:https://doi.org/10.1016/j.scitotenv.2018.12.076.
URL http://www.sciencedirect.com/science/article/pii/ S0048969718349167
[7] S. Veerapaneni, B. Klayman, S. Wang, R. Bond, Desalination Facility De-sign and Operation for Maximum Efficiency, Water Research Foundation Denver, 2011.
[8] A. Al-Karaghouli, L. L. Kazmerski, Energy consumption and water pro-duction cost of conventional and renewable-energy-powered desalination processes, Renewable and Sustainable Energy Reviews 24 (2013) 343–356. doi:https://doi.org/10.1016/j.rser.2012.12.064.
URL http://www.sciencedirect.com/science/article/pii/ S1364032113000208
[9] C. Q. He, R. G. Bond, Inland desalination and concentrate management, American Water Works Association, 2019.
[10] C.-C. Ho, Chapter 7 - membranes for bioseparations, in: S.-T. Yang (Ed.), Bioprocessing for Value-Added Products from Renewable Resources, Elsevier, Amsterdam, 2007, pp. 163–183. doi:https://doi.org/10.1016/B978-044452114-9/50008-6.
URL http://www.sciencedirect.com/science/article/pii/ B9780444521149500086
[11] S. D. Faust, O. M. Aly, Chemistry of water treatment, CRC press, 2018. [12] P. Rao, A. Aghajanzadeh, P. Sheaffer, W. R. Morrow, S. Brueske,
C. Dollinger, K. Price, P. Sarker, N. Ward, J. Cresko, Volume 1: survey of available information in support of the energy-water bandwidth study of desalination systems, Tech. rep., Lawrence Berkeley National Laboratory (2016).
[13] R. Semiat,Energy issues in desalination processes, Environmental Science & Technology 42 (22) (2008) 8193–8201, pMID: 19068794. doi:10.1021/
es801330u.
URLhttps://doi.org/10.1021/es801330u
[14] T. Mezher, H. Fath, Z. Abbas, A. Khaled, Techno-economic assessment and environmental impacts of desalination technologies, Desalination 266 (1-3) (2011) 263–273. doi:10.1016/j.desal.2010.08.035.
[15] S. Avlonitis, K. Kouroumbas, N. Vlachakis, Energy consumption and membrane replacement cost for seawater ro desalination plants, Desali-nation 157 (1) (2003) 151–158, desaliDesali-nation and the Environment: Fresh Water for all. doi:https://doi.org/10.1016/S0011-9164(03)00395-3. URL http://www.sciencedirect.com/science/article/pii/ S0011916403003953
[16] J. R. Ziolkowska, Desalination leaders in the global market – cur-rent trends and future perspectives, Water Supply 16 (3) (2015) 563–578. arXiv:https://iwaponline.com/ws/article-pdf/16/3/563/ 412113/ws016030563.pdf,doi:10.2166/ws.2015.184.
URLhttps://doi.org/10.2166/ws.2015.184
[17] United Nations, Escwa water development report 3 role of desalination in addressing water scarcity (2009).
[18] K. Quteishat, Desalination and water affordability, in: SITeau International Conference, Casablanca, Morocco, 2009.
[19] A. M. Lopez, M. Williams, M. Paiva, D. Demydov, T. D. Do, J. L. Fairey, Y. J. Lin, J. A. Hestekin, Potential of electrodia-lytic techniques in brackish desalination and recovery of indus-trial process water for reuse, Desalination 409 (2017) 108–114. doi:https://doi.org/10.1016/j.desal.2017.01.010.
URL http://www.sciencedirect.com/science/article/pii/ S0011916416310463
[20] A. Al-Karaghouli, L. Kazmerski, Economic and technical analysis of a reverse-osmosis water desalination plant using deep-3. 2 software, Journal of Environmental Science and Engineering, A 1 (3) (2012) 318–328. [21] E. Fatima, M. Elazhar, M. Hafsi, A. Elmidaoui, Performances of
electro-dialysis process in desalination of brackish waters at various salinities and voltage, International Journal of Advanced Chemistry 2 (2) (2014) 49–52. doi:10.14419/ijac.v2i2.1741.
URL https://www.sciencepubco.com/index.php/IJAC/article/view/ 1741
[22] R. Singh, Analysis of energy usage at membrane water treatment plants, Desalination and Water Treatment 29 (1-3) (2011) 63–72. doi:10.5004/ dwt.2011.2988.
URLhttps://doi.org/10.5004/dwt.2011.2988
[23] J. P. MacHarg, Energy optimization of brackish groundwater reverse os-mosis desalination, Texas Water Development Board, 2011.
[24] T. Qiu, P. A. Davies, Comparison of configurations for high-recovery inland desalination systems, Water 4 (3) (2012) 690–706.doi:https://doi.org/ 10.3390/w4030690.
[25] G. Gude, Sustainable desalination handbook: plant selection, design and implementation, Butterworth-Heinemann, 2018.
[26] R. K. McGovern, S. M. Zubair, J. H. Lienhard,The cost effectiveness of electrodialysis for diverse salinity applications, Desalination 348 (2014) 57–65. doi:https://doi.org/10.1016/j.desal.2014.06.010.
URL http://www.sciencedirect.com/science/article/pii/ S0011916414003312
[27] R. K. McGovern, S. M. Zubair, J. H. Lienhard,The benefits of hybridising electrodialysis with reverse osmosis, Journal of Membrane Science 469 (2014) 326–335. doi:https://doi.org/10.1016/j.memsci.2014.06.
040.
URL http://www.sciencedirect.com/science/article/pii/ S0376738814004918
[28] K. Zotalis, E. G. Dialynas, N. Mamassis, A. N. Angelakis, Desalination technologies: Hellenic experience, Water 6 (5) (2014) 1134–1150. doi: https://doi.org/10.3390/w6051134.
[29] I. C. Karagiannis, P. G. Soldatos, Water desalination cost literature: review and assessment, Desalination 223 (1-3) (2008) 448–456.
[30] L. F. Greenlee, D. F. Lawler, B. D. Freeman, B. Marrot, P. Moulin, Reverse osmosis desalination: Water sources, technology, and today’s challenges, Water Research 43 (9) (2009) 2317–2348. doi:https://doi.org/10.1016/j.watres.2009.03.010.
URL http://www.sciencedirect.com/science/article/pii/ S0043135409001547
[31] J. E. Miller, et al., Review of water resources and desalination technolo-gies, Sandia National Laboratories, Albuquerque, NM 49 (2003) 2003–0800. doi:10.2172/809106.
[32] J. Arroyo, S. Shirazi, Cost of brackish groundwater desalination in Texas, Tech. rep. (2012).
[33] M. Ahmed, W. H. Shayya, D. Hoey, J. Al-Handaly, Brine dis-posal from reverse osmosis desalination plants in oman and the united arab emirates, Desalination 133 (2) (2001) 135–147. doi:https://doi.org/10.1016/S0011-9164(01)80004-7.
URL http://www.sciencedirect.com/science/article/pii/ S0011916401800047
[34] A. Panagopoulos, K.-J. Haralambous, M. Loizidou, Desalina-tion brine disposal methods and treatment technologies - a re-view, Science of The Total Environment 693 (2019) 133545.
doi:https://doi.org/10.1016/j.scitotenv.2019.07.351.
URL http://www.sciencedirect.com/science/article/pii/ S0048969719334655
[35] R. Klaimi, S. Y. Alnouri, M. Al-Hindi, F. Azizi,Optimization techniques for coupling renewable/hybrid energy options with desalination systems for carbon footprint reduction, Chemical Engineering Research and Design 151 (2019) 270 – 290.doi:https://doi.org/10.1016/j.cherd.2019.09.010. URL http://www.sciencedirect.com/science/article/pii/ S0263876219304253
[36] G. Gude, Renewable Energy Powered Desalination Handbook: Application and Thermodynamics, Butterworth-Heinemann, 2018.
[37] R. G. Cavalcante J´unior, M. A. Vasconcelos Freitas, N. F. da Silva, F. R. de Azevedo Filho, Sustainable groundwater exploitation aiming at the re-duction of water vulnerability in the brazilian semi-arid region, Energies 12 (5) (2019) 904. doi:https://doi.org/10.3390/en12050904.
[38] A. M. Bilton, R. Wiesman, A. Arif, S. M. Zubair, S. Dubowsky, On the feasibility of community-scale photovoltaic-powered reverse osmosis de-salination systems for remote locations, Renewable Energy 36 (12) (2011) 3246–3256. doi:https://doi.org/10.1016/j.renene.2011.03.040. URL http://www.sciencedirect.com/science/article/pii/ S0960148111001674
[39] N. C. Wright, A. G. Winter, Justification for community-scale photovoltaic-powered electrodialysis desalination systems for in-land rural villages in india, Desalination 352 (2014) 82–91. doi:https://doi.org/10.1016/j.desal.2014.07.035.
URL http://www.sciencedirect.com/science/article/pii/ S0011916414004160
[40] M. Maisch,Solar electricity can retail for $0.027–0.036/kwh as renewables close in on global grid parity(2019).
URL https://www.pv-magazine.com/2019/11/01/
solar-electricity-can-retail-for-0-027-0-036-kwh-as-renewables-close-in-on-global-grid-parity/ [41] D. Dudley, Race heats up for title of cheapest solar energy in the world
(2019).
URL https://www.forbes.com/sites/dominicdudley/2019/10/17/ cheapest-solar-energy-in-the-world/#1a1418c34772
[42] R. Wiser, M. Bolinger, 2017 wind technologies market report, Tech. rep., U.S. Department of Energy’s Office of Energy Efficiency and Renewable Energy (2017).
[43] M. Isaka, Water desalination using renewable energy, Tech. rep., Interna-tional Renewable Energy Agency (2013).
[44] A. Subramani, J. G. Jacangelo, Emerging desalination technologies for water treatment: A critical review, Water Research 75 (2015) 164–187. doi:https://doi.org/10.1016/j.watres.2015.02.032.
URL http://www.sciencedirect.com/science/article/pii/ S0043135415001050

![Figure 5: SEC breakdown of the Richard A. Reynolds and Chino I brackish groundwater RO plants in California (data from [7]).](https://thumb-eu.123doks.com/thumbv2/123doknet/14676542.558109/16.918.259.658.192.418/figure-breakdown-richard-reynolds-chino-brackish-groundwater-california.webp)
![Figure 6: LWS compared to SEC of 10 brackish groundwater RO plants with complete feed- feed-water composition data [7].](https://thumb-eu.123doks.com/thumbv2/123doknet/14676542.558109/17.918.251.677.190.458/figure-compared-brackish-groundwater-plants-complete-water-composition.webp)

![Table 3: Brine disposal and treatment principles and cost ($/m 3 of rejected brine) [30, 31, 34].](https://thumb-eu.123doks.com/thumbv2/123doknet/14676542.558109/20.918.209.705.233.606/table-brine-disposal-treatment-principles-cost-rejected-brine.webp)
