HAL Id: hal-02066691
https://hal.sorbonne-universite.fr/hal-02066691
Submitted on 13 Mar 2019
HAL is a multi-disciplinary open access archive for the deposit and dissemination of sci-entific research documents, whether they are pub-lished or not. The documents may come from teaching and research institutions in France or abroad, or from public or private research centers.
L’archive ouverte pluridisciplinaire HAL, est destinée au dépôt et à la diffusion de documents scientifiques de niveau recherche, publiés ou non, émanant des établissements d’enseignement et de recherche français ou étrangers, des laboratoires publics ou privés.
radiomics texture features
Loïc Duron, Daniel Balvay, Saskia Vande Perre, Afef Bouchouicha, Julien
Savatovsky, Jean-Claude Sadik, Isabelle Thomassin-Naggara, Laure Fournier,
Augustin Lecler
To cite this version:
Loïc Duron, Daniel Balvay, Saskia Vande Perre, Afef Bouchouicha, Julien Savatovsky, et al.. Gray-level discretization impacts reproducible MRI radiomics texture features. PLoS ONE, Public Library of Science, 2019, 14 (3), pp.e0213459. �10.1371/journal.pone.0213459�. �hal-02066691�
Gray-level discretization impacts reproducible
MRI radiomics texture features
Loïc DuronID1,2*, Daniel Balvay2, Saskia Vande Perre2, Afef Bouchouicha2,
Julien Savatovsky1, Jean-Claude Sadik1, Isabelle Thomassin-Naggara2,3, Laure Fournier2,4, Augustin Lecler
ID1,2
1 Department of Radiology, Fondation Ophtalmologique Adolphe de Rothschild, Paris, France, 2 Universite´ Paris Descartes Sorbonne Paris Cite´, INSERM UMR-S970, Cardiovascular Research Center—PARCC, Paris, France, 3 Sorbonne Universite´ s, UPMC Univ Paris 06, Institut Universitaire de Cance´rologie, Assistance Publique-Hoˆpitaux de Paris (AP-HP), Hoˆpital Tenon, Service d’Imagerie, 4 rue de la Chine, Paris, France, 4 Universite´ Paris Descartes Sorbonne Paris Cite´, Assistance Publique-Hoˆpitaux de Paris, Hoˆpital Europe´ en Georges Pompidou, Radiology Department, Paris, France
Abstract
Objectives
To assess the influence of gray-level discretization on inter- and intra-observer reproducibil-ity of texture radiomics features on clinical MR images.
Materials and methods
We studied two independent MRI datasets of 74 lacrymal gland tumors and 30 breast lesions from two different centers. Two pairs of readers performed three two-dimensional delineations for each dataset. Texture features were extracted using two radiomics soft-wares (Pyradiomics and an in-house software). Reproducible features were selected using a combination of intra-class correlation coefficient (ICC) and concordance and coherence coefficient (CCC) with 0.8 and 0.9 as thresholds, respectively. We tested six absolute and eight relative gray-level discretization methods and analyzed the distribution and highest number of reproducible features obtained for each discretization. We also analyzed the number of reproducible features extracted from computer simulated delineations represen-tative of inter-observer variability.
Results
The gray-level discretization method had a direct impact on texture feature reproducibility, independent of observers, software or method of delineation (simulated vs. human). The absolute discretization consistently provided statistically significantly more reproducible features than the relative discretization. Varying the bin number of relative discretization led to statistically significantly more variable results than varying the bin size of absolute discretization. a1111111111 a1111111111 a1111111111 a1111111111 a1111111111 OPEN ACCESS
Citation: Duron L, Balvay D, Vande Perre S,
Bouchouicha A, Savatovsky J, Sadik J-C, et al. (2019) Gray-level discretization impacts reproducible MRI radiomics texture features. PLoS ONE 14(3): e0213459.https://doi.org/10.1371/ journal.pone.0213459
Editor: Yong Fan, University of Pennsylvania
Perelman School of Medicine, UNITED STATES
Received: October 11, 2018
Accepted: February 21, 2019
Published: March 7, 2019
Copyright:© 2019 Duron et al. This is an open access article distributed under the terms of the Creative Commons Attribution License, which permits unrestricted use, distribution, and reproduction in any medium, provided the original author and source are credited.
Data Availability Statement: All relevant data
required to reach the conclusions drawn in the manuscript are within the manuscript and its Supporting Information files. MR Raw Data cannot be shared publicly because of privacy issues. Data are available from the Rotschild Foundation Data Access (contact via Laurence Salomon, Head of Service, Department of Clinical Research, Foundation A.Rothschild Hospital, Paris, France; [email protected]) for researchers who meet the criteria for access to confidential data.
Conclusions
When considering inter-observer reproducible results of MRI texture radiomics features, an absolute discretization should be favored to allow the extraction of the highest number of potential candidates for new imaging biomarkers. Whichever the chosen method, it should be systematically documented to allow replicability of results.
Introduction
Medical imaging is progressively shifting from conventional visual image analysis to quantita-tive personalized medicine thanks to the recent development of data-driven analysis methods like radiomics [1]. Radiomics is a high-throughput mining of quantitative features from medi-cal imaging that enables data to be extracted and applied within clinimedi-cal-decision support sys-tems to improve diagnostic, prognostic, and predictive accuracy [2]. The potential of
radiomics-based phenotyping in precision medicine is encouraging [2–4] but the diversity of the implementation methods of the radiomics pipeline and the absence of widespread stan-dards result in a high variability of the possible approaches that may lead to non-replicable results. More specifically, one of the steps in the radiomics process is feature reduction, to decrease data dimensionality and allow correlation of imaging features to predict outcome. Feature reduction can be performed in a number of ways, but a frequently-used method is based on the selection of the most reproducible features, based on the hypothesis that reducibility is a mandatory quality for an imaging biomarker derived from the radiomics pro-cess. This feature-reduction step will therefore impact the results of a radiomics study, and may lead to potentially discard a highly informative feature because it is not reproducible enough to be used in clinical routine. However, there are no current recommendations or standardization of this step.
Radiomics texture features are calculated from gray-level co-occurrence matrices and from other derived matrices that are computed on images after a level discretization. The gray-level discretization consists in clustering pixels according to intensity values to facilitate the calculation of texture features [5]. Two approaches to discretization are commonly used. The first, called relative discretization, involves clustering of the pixels in the image to a fixed num-ber of bins (FBN method); the other, called absolute discretization, uses a fixed bin size (FBS method). The gray-level discretization has been shown to substantially impact feature values extracted from PET [6] and CT [7,8] images. However, few studies have addressed the effect of gray-level discretization of clinical MR images [9]. Particularly, its effect on texture feature reproducibility is unknown.
In this context, the purpose of this work was to investigate how pre-processing of images, and specifically gray-level discretization methods, could impact the number and type of repro-ducible texture features extracted from clinical MR images.
Materials and methods
Study design
This study was performed on two datasets: the DATASET 1 was prospectively acquired in a tertiary referral center specializing in ophthalmic diseases with the approval of the Institutional Research Ethics Board, of the Ile-De-France Ethics Committee (France) and adhered to the tenants of the Declaration of Helsinki (IRB 2015-A00364-45, NCT02401906); signed informed
Funding: A.Bouchouicha was funded by the
Fondation pour la Recherche Me´dicale (project number DBI20131228564).
Competing interests: The authors have declared
consent was obtained from all subjects. The DATASET 2 was retrospectively built in a tertiary referral center specializing in breast lesions with the approval of the local Ethics Committee of Tenon Hospital (Paris, France) and the Institutional Review Board (IRB “blinded”), which waived the necessity for informed consent. Information was given to all patients.
Datasets description and MRI acquisition protocol
Two datasets of medical MR images were acquired in two distinct centers:
• The DATASET 1 consisted in multi-parametric MR images of 74 lacrymal gland lesions pro-spectively collected from December 2015 to April 2017 in a tertiary referral center specializ-ing in ophthalmic diseases, usspecializ-ing a 3 Tesla Philips INGENIA device with a 32-channel head coil (Philips Medical Systems, Best, Netherlands). The MRI protocol, which included 6 MR sequences, is detailed inS1 Table.
• The DATASET 2 consisted in MR images of 30 breast lesions prospectively collected from November 2017 to April 2018 on a 1.5 Tesla General Electric MR scanner using a phased array dedicated breast coil covering both breasts. Patients were imaged in the prone position. The sequence of interest was an ultrafast dual-echo 3D spoiled gradient recalled acquisition sequence called DISCO (Differential Subsampling With Cartesian Ordering), with pseudo-random variable density space segmentation, with an elliptical model where the central k-space regions were acquired more frequently than the peripheral region and a view-sharing reconstruction. The MRI acquisition parameters are detailed inS1 Table. This sequence was performed before and eleven times during one minute and twenty second after bolus injec-tion of Gadolinium chelate (Dotarem; Guerbet, France) (0,1mmol.kg-1 body weight) given by a power injector (Medrad, Maastrich, Netherlands) at a rate of 2ml.s-1 followed by 20ml of saline flush. The fifth post-injection series was arbitrarily chosen for radiomics feature extraction.
Manual segmentation
DATASET 1. Two readers reviewed the whole imaging DATASET 1, a senior
neuro-radi-ologist specialized in orbital imaging with 8 years of experience (�blinded�) and a junior radi-ologist with 6 months of experience (�blinded�), blinded to patient ID, medical history, lab
results and pathological results. Each reader independently performed a 2D manual delinea-tion of the two lacrimal glands of each patient on each MR sequence. The slice of delineadelinea-tion was independently chosen by each reader, considered as the slice where the lesion had the larg-est diameter. The delineation included both the tumor and the normal glands. A total of 444 ROIs were drawn by each reader (2 lacrimal glands per patient on 6 MR sequences for 37 patients). One reader (�blinded�) performed a second segmentation session to assess the
intra-observer reproducibility. The segmentations were performed using an in-house software developed on Matlab (Matlab R2013b, The Mathworks, Natick, MA, USA) and dedicated to the radiomics analysis [10].
DATASET 2. Two junior radiologists reviewed the whole imaging DATASET 2
(�blinded�,�blinded�, both 6 months of experience) blinded to patient ID, medical history, lab results and pathological results. Each reader independently performed a 2D manual delinea-tion of the breast lesions on the DISCO sequence. The slice of delineadelinea-tion was independently chosen by each reader, considered as the slice where the lesion had the largest diameter. One reader (�blinded�) performed a second segmentation session to assess the intra-observer reproducibility. The segmentations were performed using the ITK-SNAP software (Yushke-vich et al., version 3.6.0) [11].
Computer-simulated segmentation
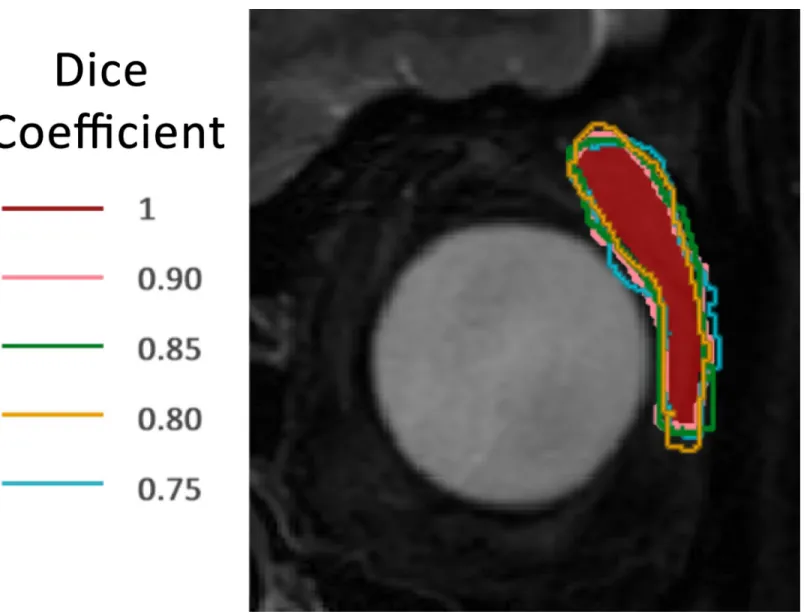
To overcome the potential bias of the small number of readers that may not represent the true inter- and intra-observer segmentation variability, we developed a computer simulation of a high number of delineations (5000) based on morphological binary openings, closings and elastic transforms applied to a manual reference delineation for each ROI of DATASET 1. The Dice coefficient, which is a measurement of similarity between two segmentations, was calcu-lated between each simucalcu-lated ROI and the human reference one. Then, one simucalcu-lated segmen-tation per Dice coefficient interval of 0.05 from 1.0 (no transformation) to 0.65 (maximum tested transformation) was randomly selected. This interval from 1.0 to 0.65 was chosen to encompass the whole variability different manual segmentations may provide. This led to 7 randomly selected simulated ROIs for each associated human reference ROI with Dice coeffi-cients ranging from 0.65 to 0.95. The segmentations simulations were visually checked to make sure it was consistent with a potential manual delineation variability. An example of computer simulations is given inFig 1.
Fig 1. Example of computer simulations of delineations. The reference manual delineation is in red. Computer simulations with corresponding Dice coefficient are
superimposed.
Gray-level discretization methods
Two methods of discretization were used:
• An absolute discretization with fixed bin size (FBS method), where a new bin is assigned to pixel intensities each BS gray level, starting from 0, according to the followingEq 1:
IBSð Þ ¼x IðxÞ BS � � min IðxÞ BS � � � � þ 1 ð1Þ
Where I(x) is the intensity of voxel x, BW the bin size and IBS(x) the discretized gray-level
of voxel x. The term [min(I(x)/BS) + 1] ensures that the bin count starts at 1. We tested six dif-ferent bin sizes: 1, 5, 10, 20, 25 and 50.
• A relative discretization with fixed bin number (FBN method), starting from the minimum intensity value of the segmented area and defined as follows:
IBNð Þ ¼x 1 if IðxÞ ¼ minðIðxÞÞ BN � IðxÞ minðIðxÞÞ maxðIðxÞÞ minðIðxÞÞ � � otherwise ð2Þ 8 > < > :
Where I(x) is the intensity of voxel x, BN the bin number and IBN(x) the discretized gray-level
of the voxel x. We tested eight different fixed bin numbers: 8, 16, 32, 64, 128, 256, 512 and 1024.
Feature extraction
We performed the feature extraction for each discretization using two radiomics-dedicated softwares:
• Pyradiomics open-source software (Griethuysen et al., version 1.3.0) [12] was used on DATASET 1 and DATASET 2 to extract texture features. No pixel resampling nor filter was applied to the images. Each ROI provided 69 texture features, derived from the gray-level co-occurrence matrix (GLCM, 23 features) obtained using 4 angles, gray-level run-length matrix (GLRLM, 16 features), level size-zone matrix (GLSZM, 16 features) and gray-level dependence matrix (GLDM, 14 features). A total of 30 636 texture feature values for each discretization was calculated for DATASET 1 and 2 070 for DATASET 2.
• An in-house software developed on Matlab (Matlab R2013b, The Mathworks, Natick, MA, USA) and dedicated to the radiomics analysis [10] was also used to performed feature extrac-tion on DATASET 1. Each ROI provided 57 texture features derived from the gray-level co-occurrence matrix (GLCM, 26 features) obtained using 4 angles, gray-level run-length matrix (GLRLM, 13 features), gray-level size-zone matrix (GLSZM, 13 features) and neigh-borhood gray-tone difference matrix (NGTDM, 5 features). A total of 25 308 texture feature values for each discretization was calculated.
• Texture features extracted are listed inS2 Table. Their mathematical definitions are available elsewhere [5,12]. Detailed extraction parameters are given inS3 Table.
Feature reduction according to intra- and inter-observer reproducibility
In order to select features that are reproducible between observer delineations, we performed a 2-way random intraclass correlation coefficient (ICC) (absolute agreement, average type) on pair combinations of readings (1/2, 1/3, 2/3) and a Lin’s concordance correlation coefficient
(CCC) on the intra-observer pair. A feature was considered as highly reproducible and there-fore selected if all three ICC values were above 0.8 and the CCC value was above 0.9. All other features were eliminated.
Data analysis
Experiment 1—Reproducible features using Pyradiomics on DATASET 1 according to the gray-level discretization. For each discretization method and each MR sequence of
DATASET 1, we analyzed the highest number of reproducible texture features obtained from the Pyradiomics software with FBS versus FBN discretization methods, using an exact Fisher test. We also assessed if there was a difference in reproducible feature distributions among chosen bin sizes for FBS or among chosen bin numbers for FBN, using Chi-square tests.
Experiment 2—Reproducible features using an in-house Matlab-based software on DATASET 1 according to the gray-level discretization. For each discretization method and
each MR sequence, we repeated the same analysis on the data extracted from the DATASET 1 using our in-house feature extraction software.
Experiment 3—Reproducible features using Pyradiomics on DATASET 2 according to the gray-level discretization. For each discretization method, we repeated the same analysis
using the Pyradiomics software on DATASET 2.
Experiment 4—Reproducible features using Pyradiomics and computer simulated delineations on DATASET 1 according to the gray-level discretization. Texture features
were extracted from each Dice coefficient associated ROI as described in theFeature Extrac-tion paragraph, using the Pyradiomics software.
We focused on the simulated ROIs associated with a Dice coefficient of 0.85 because the mean Dice coefficient of manual delineations of pooled sequences of DATASET 1 (Experi-ment 1) was 0.84. We performed feature reduction according to the delineation variability by selecting features for which the ICC between the reference human ROI (Dice 1) and the simu-lated ROI (Dice 0.85) was above 0.8. We then performed the same analysis as described in pre-vious sections.
We also analyzed the variation of the highest number of reproducible features according to the Dice coefficient for FBS methods versus FBN methods.
The flowchart of the study is detailed inFig 2.
Statistical analyses
All feature extractions and discretization methods were implemented using Python language for Pyradiomics software and Matlab language for our in-house feature extraction software. All statistical analyses of extracted data were performed using R-3.3.3 (R Foundation, Vienna, Austria) [13]. P -value � 0.05 was considered statistically significant.
Results
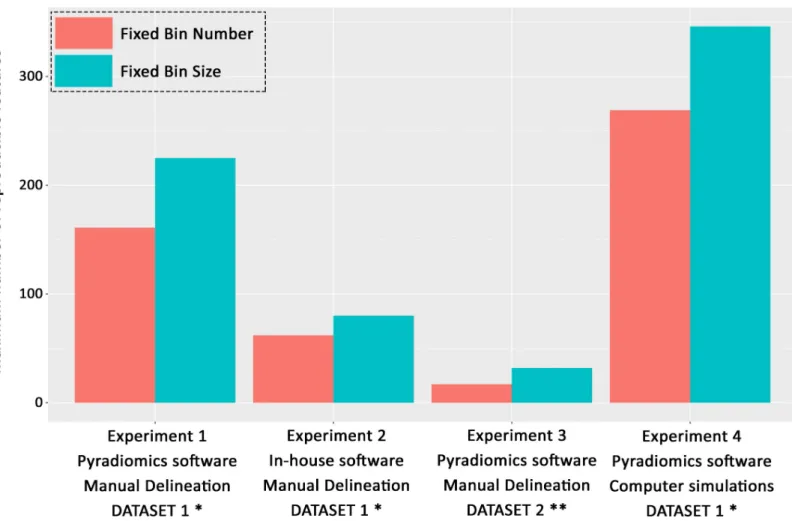
The results of the experiments 1, 2, 3 and 4 are detailed in the Tables1,2,3and4, respectively. In each of the above experiments, the gray-level discretization method impacted both the number and the distribution of reproducible features observed. Overall, the highest number of reproducible features was consistently obtained using FBS methods. The difference between FBS and FBN methods was significant in most cases. An illustration of the highest number of reproducible texture features for the FBS and FBN methods in each experiment is given inFig 3. The distributions of reproducible features were more often statistically different when vary-ing the bin number among tested FBN methods than when varyvary-ing bin sizes among tested FBS
methods. The highest number of reproducible features was obtained using large bin numbers (512 or 1024) or small bin widths (1, 5, 10, or 20) in all cases.
Fig 2. Flowchart of the study. Reader 2.1 = Reader 2, delineation session 1; Reader 2.2 = Reader 2, delineation session 2; Reader 3.1 = Reader 3, delineation
session 1; Reader 3.2 = Reader 3, delineation session 2; ROIs = Regions Of Interest; ICC = Intra-class correlation coefficient; CCC = Concordance correlation coefficient.
https://doi.org/10.1371/journal.pone.0213459.g002
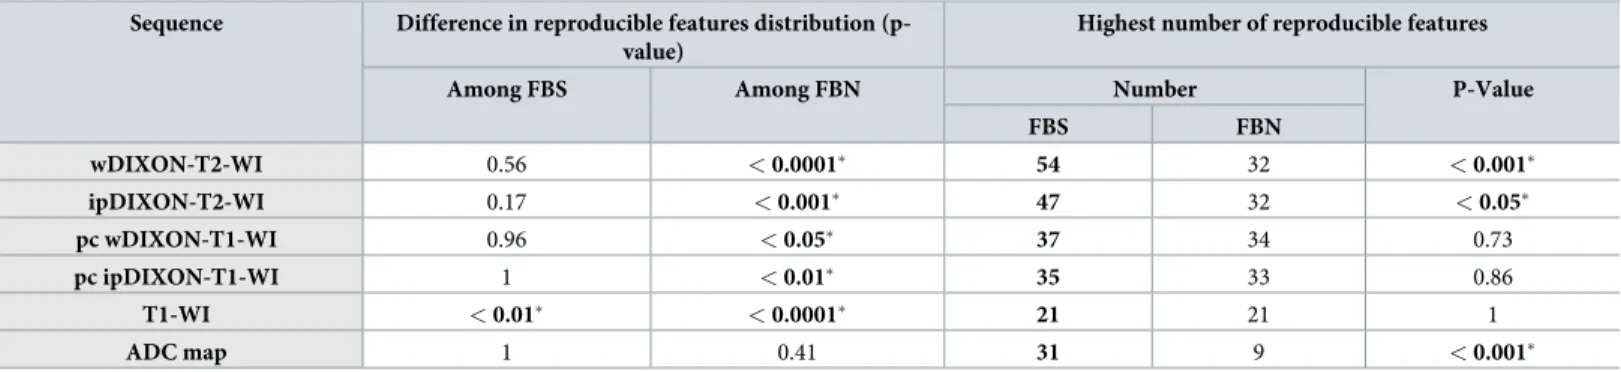
Table 1. Reproducible features using the Pyradiomics software and manual delineations on DATASET 1 according to the gray-level discretization. Sequence Difference in reproducible features distribution
(p-value)
Highest number of reproducible features
Among FBS Among FBN Number P-Value
FBS FBN wDIXON-T2-WI 0.56 < 0.0001� 54 32 < 0.001� ipDIXON-T2-WI 0.17 < 0.001� 47 32 < 0.05� pc wDIXON-T1-WI 0.96 < 0.05� 37 34 0.73 pc ipDIXON-T1-WI 1 < 0.01� 35 33 0.86 T1-WI < 0.01� < 0.0001� 21 21 1 ADC map 1 0.41 31 9 < 0.001�
FBS = Fixed Bin Size (absolute discretization), FBN = Fixed Bin Number (relative discretization).Sequence abbreviations: Water DIXON-T2-WI (wDIXON-T2-WI);
In-Phase DIXON-T2-WI (ipDIXON-T2-WI); Post-Contrast Water DIXON-T1-WI (pc wDIXON-T1-WI); Post-Contrast In-Phase DIXON-T1-WI (pc ipDIXON-T1-WI); Apparent Diffusion Coefficient map (ADC map).
�= statistically significantly different among discretizations.
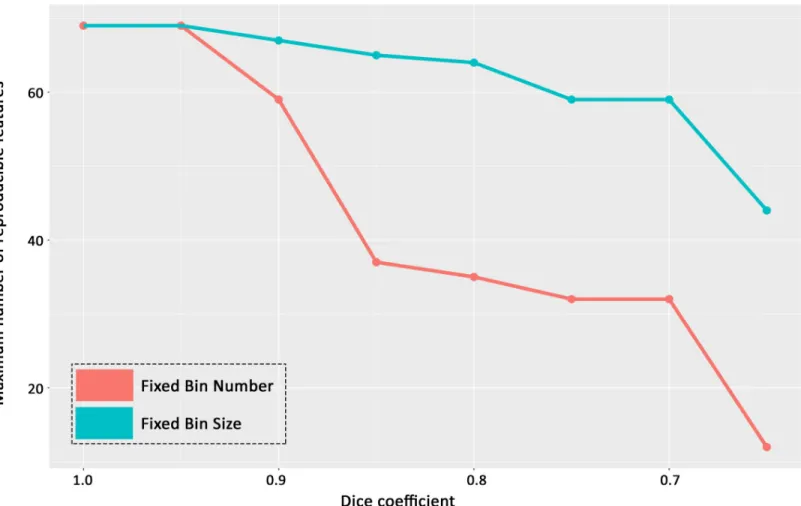
The highest number of reproducible features extracted from computer simulated delinea-tions decreased according to the Dice coefficient from 1 to 0.65. The number of reproducible features obtained from the FBS method was much less impacted by variability of ROI delinea-tion than the number obtained by the FBN method, and the difference between FBS and FBN methods increased with the decrease of the Dice coefficient. The results for the water DIX-ON-T2-WI are illustrated inFig 4. The difference in the highest number of reproducible fea-tures according to the discretization method (FBS versus FBN methods) was statistically significant for all Dice coefficients lesser or equal to 0.9 (p < 0.05).
Whatever the discretization method, the DATASET and the MR sequence, the three most reproducible features were: GLRLM Gray-Level Uniformity, GLDM Gray-Level Non-Uniformity, GLDM Dependence Non-Uniformity. The three least reproducible features were: GLDM Large Dependence Low Gray-Level Emphasis, GLCM Cluster Shade and GLRLM Long Run Low Gray-Level Emphasis.
Discussion
We assessed the influence of gray-level discretization methods on radiomics texture feature inter- and intra-observer reproducibility in two independent clinical MR datasets. Texture fea-ture reproducibility was shown to substantially depend on the gray-level discretization method. The absolute discretization (FBS) method was found to provide a higher number of reproducible features than the relative discretization (FBN) method. The relative discretization
Table 2. Reproducible features using the in-house Matlab-based software and manual delineations on DATASET 1 according to the gray-level discretization method.
Sequence Difference in reproducible features distribution (p-value)
Highest number of reproducible features
Among FBS Among FBN Number P-Value
FBS FBN wDIXON-T2-WI 0.15 < 0.001� 22 15 0.23 ipDIXON-T2-WI 0.52 0.17 15 7 0.09 pc wDIXON-T1-WI 0.98 < 0.001� 17 14 0.67 pc ipDIXON-T1-WI 0.98 0.29 16 8 0.11 T1-WI 0.79 < 0.0001� 4 13 NA ADC map 0.95 0.76 6 5 1
FBS = Fixed Bin Size (absolute discretization), FBN = Fixed Bin Number (relative discretization).Sequence abbreviations: Water DIXON-T2-WI (wDIXON-T2-WI);
In-Phase DIXON-T2-WI (ipDIXON-T2-WI); Post-Contrast Water DIXON-T1-WI (pc wDIXON-T1-WI); Post-Contrast In-Phase DIXON-T1-WI (pc ipDIXON-T1-WI); Apparent Diffusion Coefficient map (ADC map).
�= statistically significantly different among discretizations.
https://doi.org/10.1371/journal.pone.0213459.t002
Table 3. Reproducible features using the Pyradiomics software and manual delineations on DATASET 2 according to the gray-level discretization. Sequence Difference in reproducible features distribution (p-value) Highest number of reproducible features
Among FBS Among FBN Number P-Value
FBS FBN
DISCO sequence 0.54 0.25 32 17 < 0.05�
FBS = Fixed Bin Size (absolute discretization), FBN = Fixed Bin Number (relative discretization).Sequence abbreviations: DISCO = Differential Subsampling With
Cartesian Ordering.
�= statistically significantly different among discretizations.
Table 4. Reproducible features using the Pyradiomics software and simulated delineations with a Dice coefficient of 0.85 on DATASET 1 according to the gray-level discretization.
Sequence Difference in reproducible features distribution (p-value)
Highest number of reproducible features
Among FBS Among FBN Number P-Value
FBS FBN wDIXON-T2-WI 0.14 < 0.0001� 57 37 < 0.001� ipDIXON-T2-WI 0.69 0.75 62 46 < 0.01� pc wDIXON-T1-WI 0.28 < 0.001� 66 57 < 0.05� pc ipDIXON-T1-WI 0.41 < 0.01� 64 59 0.27 T1-WI 0.14 < 0.05� 54 44 0.09 ADC map 1 0.25 43 26 < 0.05�
FBS = Fixed Bin Size (absolute discretization), FBN = Fixed Bin Number (relative discretization).Sequence abbreviations: Water DIXON-T2-WI (wDIXON-T2-WI);
In-Phase DIXON-T2-WI (ipDIXON-T2-WI); Post-Contrast Water DIXON-T1-WI (pc wDIXON-T1-WI); Post-Contrast In-Phase DIXON-T1-WI (pc ipDIXON-T1-WI); Apparent Diffusion Coefficient map (ADC map).
�= statistically significantly different among discretizations.
https://doi.org/10.1371/journal.pone.0213459.t004
Fig 3. Highest number of reproducible texture features obtained for each experiment according to the discretization method. FBS = Fixed Bin Size (absolute
discretization); FBN = Fixed Bin Number (relative discretization).�6 MR sequences;��1 MR sequence.
was also found to give more different results when varying the bin numbers than the absolute discretization when varying the bin sizes.
Although the gray-level discretization has been assessed in PET and CT studies [6–8], few studies have focused on MR images. Molina & al. [9] assessed the variability of texture feature values on post-contrast T1-WI in three patients with glioblastomas and one patient with a non-small cell lung cancer brain metastasis, using a FBN method with 8, 16, 32 and 64 gray levels. They found that modifying the discretization parameters led to significantly different results. More recently, Goya-Outi et al. [14] investigated the impact of the absolute and relative discretization methods on patient ranking compared to the visual assessment of the heteroge-neity of diffuse intrinsic pontine gliomas on 30 patients and 4 MR sequences (T1-WI, post-contrast T1-WI, T2-WI and Fluid Attenuation Inversion Recovery (FLAIR)). They concluded that using an absolute (FBS) discretization method provided more consistent results compared to the visual assessment of the heterogeneity. The Image Biomarker Standardization Initiative (IBSI) [5] has recently proposed guidelines to help select the best gray-level discretization for each purpose. The recommendations were to use relative discretization when dealing with MR raw data, though no reference is given to support this recommendation. To the best of our knowledge, no study has investigated the influence of absolute and relative discretization on multiple MR sequences, multiple datasets and multiple softwares.
Fig 4. Highest number of reproducible texture features using simulated ROIs on DATASET 1 with the Pyradiomics software according to the Dice coefficient ranging from 1.0 to 0.65, for FBS versus FBN methods. FBS = Fixed Bin Size (absolute discretization); FBN = Fixed Bin Number (relative discretization).
We assessed the influence of gray-level discretization on the inter and intra-observer repro-ducibility of texture features because most of the radiomics studies currently integrate the inter and intra-observer reproducibility as a data reduction step to select robust features and exclude all others [7,15–17]. This step, and how it is performed, will therefore greatly impact the features that may emerge from the radiomics process as potential imaging biomarkers.
Our results may be explained by the calculation process used to perform relative and abso-lute discretization methods. When using relative discretization (FBN), the intensity range of the segmented image will impact the bin size, which in turn determines the intensity histo-gram, the co-occurrence and other derived matrices used to compute texture features. Most of the inter and intra-observer segmentation variability is related to slightly different contours providing intensity outliers, thereby changing the intensity range of the region of interest. Conversely, the absolute discretization (FBS) method is independent from the intensity range of the segmented image and so may be less sensitive to inter- and intra-observer delineation variability.
We used two independent and very different datasets for external validation, two pairs of readers independently delineating the datasets, computer simulations of manual delineation variability, two delineation softwares to get rid of the delineation software confounding factor, and two radiomics softwares for which the calculation method of gray-level co-occurrence matrices and other derived matrices was slightly different. The purpose was to determine whether our results applied to different data, quantification methods, or organs. The fixed bin size method of gray-level discretization consistently provided less variable results. There are currently no specific guidelines to address the choice of the best bin width or bin number. Available studies use bin numbers varying from 8 to 1000, as suggested by the IBSI [5,14], or bin widths from 1 to 75 [14,18]. This allows for differing ranges of signal intensity in ROIs, while still keeping the texture features informative and comparable between lesions. The ideal choice probably depends on the target lesions and the wish to enhance coarse or fine textures. We tested a large panel of bin widths and bin numbers to consider the largest possible choices and not limit our conclusions to a selected range of bin widths and/or numbers.
This study has some limitations. We did not normalize signal intensity on the MR images before extracting texture features. The IBSI recommends to use the normalization on raw MR data because it is based on arbitrary units. The normalization may impact texture feature val-ues, especially when dealing with multiple MR machines and when comparing feature values among patients [14,19,20]. However, we focused on the reproducibility of texture features between observers and not between patients. Therefore, for a given patient, the signal intensity values were constant in the image and the range in the ROI was impacted only by the differ-ence in delineations. When performed after intensity normalization, the experiment 1 yielded comparable results, as detailed inS4 Table. Many other sources of variability may impact the results of the radiomics pipeline and should be investigated, including acquisition parameters, denoising, spatial interpolation methods applied on images or regions of interest, texture fea-tures calculation methods. For instance, we observed significant differences in terms of num-ber of reproducible features between radiomics softwares. As delineations and pre-processing steps were the same, two differences may explain this. First, we extracted 57 texture features per delineation with our in-house software versus 69 with Pyradiomics. Second, the calculation method of co-occurrence matrices and other derived matrices is different between the two softwares, as explained inS5 Table, both described in the IBSI guidelines. There are currently no recommendation to favor one method over another. It may be noted that the delineation of Dataset 2 was performed only by junior radiologists with 6 months of experience in breast MRI, which may impact the clinical significance of each specific ROI. However, the purpose of the study was not to have clinically exact ROIs but rather to study the impact of differences in
delineations among observations. Finally, the method presented here to select inter and intra-observer reproducible features does not take into account whether the selected features were informative (i.e. predictive of an outcome). It is only one step meant to exclude non-reproduc-ible features and keep the maximum number of robust potential candidates for new imaging biomarkers. However, the final purpose of the radiomics process is to identify potential imag-ing biomarkers based on their capacity to predict an outcome. We believe it is desirable to have the largest number of reproducible features so that potentially predictive features were not erroneously excluded for technical reasons.
This study showed that the gray-level discretization of MR images influences the number and distribution of inter and intra-observer reproducible texture features. We showed that using a fixed bin size method (absolute discretization) allowed preserving a higher number of reproducible features which may be potential imaging biomarkers candidates. Considering the impact of the discretization method on results, the precise method used should be clearly doc-umented in each radiomics study to improve the replicability of the results, as recommended in the recent evaluation criteria and reporting guidelines published to improve reliability, com-parability and generalizability of radiomics-based studies [2]. The standardization of reporting radiomics studies is an essential step toward the credibility and subsequent adoption of the data-driven radiomics process.
Supporting information
S1 Table. MRI acquisition protocols of DATASETS 1 and 2. The DATASET 1 included 6
MR sequences: T1 Weighted Images (WI); Apparent Diffusion Coefficient (ADC) maps calcu-lated voxel-wise as the linear slope of signal decrease between b0 and b1000 of Diffusion Weighted Imaging (DWI) acquisitions; In-Phase and Water DIXON-T2-WI (ipDIXON-T2-WI and wDIXON-(ipDIXON-T2-WI, respectively); Post-contrast In-Phase and Water DIXON-T1-WI (Post-contrast ipDIXON-T1-WI and wDIXON-T1-WI, respectively), obtained after adminis-tration of intravenous contrast injection of a single bolus (0.1 mmol/kg) of Gadobutrol (Gado-vist; Bayer HealthCare, Berlin, Germany). The DATASET 2 included 1 MR sequence called DISCO (Differential Subsampling With Cartesian Ordering).
(DOCX)
S2 Table. List of the texture features extracted using the Pyradiomics and in-house Matlab-based softwares.
(DOCX)
S3 Table. Feature extraction details according to the Imaging Biomarker Standardization Initiative (IBSI) guidelines.
(DOCX)
S4 Table. Experiment 1 results after intensity normalization. Reproducible features using the Pyradiomics software and manual delineations on DATASET 1 according to the gray-level discretization. The intensity normalization was performed as follows: images were
cen-tered by their mean and scaled by their standard deviation; intensity values below or above three standard deviations from the mean were excluded; intensity values were shifted to get only positive values; intensities were then scaled to the initial common range (all images of each sequence had a similar range). The normalization was not applied to the parametric ADC map.
S5 Table. Pyradiomics versus in-house software texture features calculation methods.
Pyr-adiomics computes one matrix per distance and/or angle (according to the texture feature), normalizes the matrix, calculates one feature value per normalized matrix and averages the results to obtain the final texture value. Our in-house software computes a weighted sum of all non-normalized matrices obtained with the different distances/angles (diagonals are weighted byp2), then directly calculates the final feature value based on this unique matrix. These two methods are described in the IBSI guidelines. There is no current recommendation to favor one method over another.
(DOCX)
Author Contributions
Conceptualization: Loïc Duron, Daniel Balvay, Saskia Vande Perre, Afef Bouchouicha, Julien Savatovsky, Jean-Claude Sadik, Isabelle Thomassin-Naggara, Laure Fournier, Augustin Lecler.
Data curation: Loïc Duron, Daniel Balvay, Saskia Vande Perre, Afef Bouchouicha, Julien Sava-tovsky, Jean-Claude Sadik, Isabelle Thomassin-Naggara, Laure Fournier, Augustin Lecler.
Formal analysis: Loïc Duron, Afef Bouchouicha, Laure Fournier, Augustin Lecler.
Investigation: Loïc Duron, Daniel Balvay, Saskia Vande Perre, Afef Bouchouicha, Laure Fournier.
Methodology: Loïc Duron, Daniel Balvay, Saskia Vande Perre, Afef Bouchouicha, Laure Four-nier, Augustin Lecler.
Project administration: Augustin Lecler.
Software: Loïc Duron, Daniel Balvay, Laure Fournier.
Supervision: Loïc Duron, Daniel Balvay, Saskia Vande Perre, Afef Bouchouicha, Jean-Claude Sadik, Isabelle Thomassin-Naggara, Laure Fournier, Augustin Lecler.
Validation: Loïc Duron, Daniel Balvay, Saskia Vande Perre, Julien Savatovsky, Isabelle Tho-massin-Naggara, Laure Fournier, Augustin Lecler.
Visualization: Loïc Duron, Saskia Vande Perre, Afef Bouchouicha, Julien Savatovsky, Jean-Claude Sadik, Laure Fournier, Augustin Lecler.
Writing – original draft: Loïc Duron, Laure Fournier, Augustin Lecler.
Writing – review & editing: Loïc Duron, Saskia Vande Perre, Afef Bouchouicha, Julien Sava-tovsky, Laure Fournier, Augustin Lecler.
References
1. Aerts HJWL, Velazquez ER, Leijenaar RTH, Parmar C, Grossmann P, Carvalho S, et al. Decoding tumour phenotype by noninvasive imaging using a quantitative radiomics approach. Nat Commun. 2014; 5: 4006.https://doi.org/10.1038/ncomms5006PMID:24892406
2. Lambin P, Leijenaar RTH, Deist TM, Peerlings J, de Jong EEC, van Timmeren J, et al. Radiomics: the bridge between medical imaging and personalized medicine. Nat Rev Clin Oncol. Nature Publishing Group; 2017; 14: 749–762.https://doi.org/10.1038/nrclinonc.2017.141PMID:28975929
3. Gillies RJ, Kinahan PE, Hricak H. Radiomics: Images Are More than Pictures, They Are Data. Radiol-ogy. 2016; 278: 563–577.https://doi.org/10.1148/radiol.2015151169PMID:26579733
4. Aerts HJWL. The Potential of Radiomic-Based Phenotyping in Precision Medicine. JAMA Oncol. 2016; 2: 1636.https://doi.org/10.1001/jamaoncol.2016.2631PMID:27541161
5. Zwanenburg A, Leger S, Vallières M, Lo¨ck S, Initiative for the IBS. Image biomarker standardisation ini-tiative. 2016; Available:http://arxiv.org/abs/1612.07003
6. Leijenaar RTH, Nalbantov G, Carvalho S, van Elmpt WJC, Troost EGC, Boellaard R, et al. The effect of SUV discretization in quantitative FDG-PET Radiomics: the need for standardized methodology in tumor texture analysis. Sci Rep. Nature Publishing Group; 2015; 5: 11075.https://doi.org/10.1038/ srep11075PMID:26242464
7. Larue RTHM, Van De Voorde L, van Timmeren JE, Leijenaar RTH, Berbe´e M, Sosef MN, et al. 4DCT imaging to assess radiomics feature stability: An investigation for thoracic cancers. Radiother Oncol. 2017; 125: 147–153.https://doi.org/10.1016/j.radonc.2017.07.023PMID:28797700
8. Shafiq-ul-Hassan M, Zhang GG, Latifi K, Ullah G, Hunt DC, Balagurunathan Y, et al. Intrinsic dependen-cies of CT radiomic features on voxel size and number of gray levels. Med Phys. 2017; 44: 1050–1062. https://doi.org/10.1002/mp.12123PMID:28112418
9. Molina D, Pe´rez-Beteta J, Martı´nez-Gonza´ lez A, Martino J, Vela´squez C, Arana E, et al. Influence of gray level and space discretization on brain tumor heterogeneity measures obtained from magnetic res-onance images. Comput Biol Med. 2016; 78: 49–57.https://doi.org/10.1016/j.compbiomed.2016.09. 011PMID:27658261
10. Balvay D, Frouin F, Calmon G, Bessoud B, Kahn E, Siauve N, et al. New criteria for assessing fit quality in dynamic contrast-enhanced T1-weighted MRI for perfusion and permeability imaging. Magn Reson Med. 2005; 54: 868–877.https://doi.org/10.1002/mrm.20650PMID:16155897
11. Yushkevich PA, Piven J, Hazlett HC, Smith RG, Ho S, Gee JC, et al. User-guided 3D active contour segmentation of anatomical structures: Significantly improved efficiency and reliability. Neuroimage. 2006; 31: 1116–1128.https://doi.org/10.1016/j.neuroimage.2006.01.015PMID:16545965 12. van Griethuysen JJM, Fedorov A, Parmar C, Hosny A, Aucoin N, Narayan V, et al. Computational
Radiomics System to Decode the Radiographic Phenotype. Cancer Res. 2017; 77: e104–e107.https:// doi.org/10.1158/0008-5472.CAN-17-0339PMID:29092951
13. R Core Team. R: A language and environment for statistical computing. [Internet]. 2015 [cited 4 Nov 2017]. Available:http://www.r-project.org/
14. Goya-Outi J, Orlhac F, Calmon R, Alentorn A, Nioche C, Philippe C, et al. Computation of reliable tex-tural indices from multimodal brain MRI: suggestions based on a study of patients with diffuse intrinsic pontine glioma. Phys Med Biol. IOP Publishing; 2018; 63: 105003.https://doi.org/10.1088/1361-6560/ aabd21PMID:29633962
15. Collins GS, Reitsma JB, Altman DG, Moons KGM. Transparent Reporting of a multivariable prediction model for Individual Prognosis Or Diagnosis (TRIPOD): The TRIPOD Statement. Ann Intern Med. American College of Physicians; 2015; 162: 55.https://doi.org/10.7326/M14-0697PMID:25560714 16. van Timmeren JE, Leijenaar RTH, van Elmpt W, Reymen B, Oberije C, Monshouwer R, et al. Survival
prediction of non-small cell lung cancer patients using radiomics analyses of cone-beam CT images. Radiother Oncol. 2017; 123: 363–369.https://doi.org/10.1016/j.radonc.2017.04.016PMID:28506693 17. Balagurunathan Y, Gu Y, Wang H, Kumar V, Grove O, Hawkins S, et al. Reproducibility and Prognosis
of Quantitative Features Extracted from CT Images 1,2. Transl Oncol. 2014; 7: 72–87.https://doi.org/ 10.1593/tlo.13844PMID:24772210
18. Schwier M, van Griethuysen J, Vangel MG, Pieper S, Peled S, Tempany CM, et al. Repeatability of Mul-tiparametric Prostate MRI Radiomics Features. 2018; Available:http://arxiv.org/abs/1807.06089 19. Collewet G, Strzelecki M, Mariette F. Influence of MRI acquisition protocols and image intensity
normali-zation methods on texture classification. Magn Reson Imaging. 2004; 22: 81–91.https://doi.org/10. 1016/j.mri.2003.09.001PMID:14972397
20. Vallières M, Freeman CR, Skamene SR, El Naqa I. A radiomics model from joint FDG-PET and MRI texture features for the prediction of lung metastases in soft-tissue sarcomas of the extremities. Phys Med Biol. 2015; 60: 5471–5496.https://doi.org/10.1088/0031-9155/60/14/5471PMID:26119045