HAL Id: hal-02537257
https://hal.umontpellier.fr/hal-02537257
Submitted on 8 Apr 2020
HAL is a multi-disciplinary open access archive for the deposit and dissemination of sci-entific research documents, whether they are pub-lished or not. The documents may come from teaching and research institutions in France or abroad, or from public or private research centers.
L’archive ouverte pluridisciplinaire HAL, est destinée au dépôt et à la diffusion de documents scientifiques de niveau recherche, publiés ou non, émanant des établissements d’enseignement et de recherche français ou étrangers, des laboratoires publics ou privés.
Laurent Maïmoun, Olivier Coste, Thibault Mura, Pascal Philibert, Florence
Galtier, Denis Mariano-Goulart, Françoise Paris, Charles Sultan
To cite this version:
Laurent Maïmoun, Olivier Coste, Thibault Mura, Pascal Philibert, Florence Galtier, et al.. Specific Bone Mass Acquisition in Elite Female Athletes. The Journal of clinical endocrinology and metabolism, Williams & Wilkins Co., 2013, �10.1210/jc.2013-1070�. �hal-02537257�
Specific Bone Mass Acquisition in Elite Female Athletes
Laurent Maïmoun, Olivier Coste, Thibault Mura, Pascal Philibert, Florence Galtier, Denis Mariano-Goulart, Françoise Paris, and Charles Sultan
Département d’Hormonologie (L.M., O.C., P.P., F.P., C.S.), Hôpital Lapeyronie, Centre Hospitalier Régional Universitaire (CHRU) Montpellier et Université Montpellier I (UMI); Service de Médecine Nucléaire (L.M., D.M.-G.), Hôpital Lapeyronie, CHRU, Montpellier, 34295 Montpellier, France; Physiologie and Médecine Expérimentale du Cœur et des Muscles Institut National de la Santé et de la Recherche Médicale (INSERM) (L.M.), U1046; Direction Régionale de la Jeunesse, des Sports et de la Cohésion Sociale (O.C.), 34094 Montpellier, France; Centre d’Investigation Clinique (T.M.) et Département d’Information Médicale, CHRU Montpellier; CIC 1001 (T.M., F.G.), INSERM; Centre d’Investigation Clinique (F.G.) et Département des Maladies Endocriniennes, CHRU Montpellier, 34295 Montpellier, France; and Unité d’Endocrinologie Pédiatrique (F.P., C.S.), Hôpital Arnaud de Villeneuve, CHRU Montpellier et UMI, 34295 Montpellier, France
Context: Cross-sectional studies have demonstrated that physical activity can improve bone mass acquisition. However, this design is not adequate to describe the specific kinetics of bone mass gain during pubertal development.
Objective: To compare the kinetics of bone mass acquisition in female adolescent athletes of sports that impose different mechanical loads and untrained controls throughout puberty.
Study Participants: A total of 72 girls with ages ranging from 10.8 to 18.0 years were recruited: 24 rhythmic gymnasts (RG, impact activity group), 24 swimmers (SW, no-impact activity), and 24 age-matched controls (CON).
Main Outcome Measures: Areal bone mineral density (aBMD) was determined using dual-energy x-ray absorptiometry and bone turnover markers were analyzed. All the investigations were per-formed at baseline and after 1 year.
Results: At baseline and after 1 year of follow-up, RG presented significantly greater aBMD adjusted for age, fat-free soft tissue, and fat mass compared with CON and SW, only at the femoral region. When aBMD variation throughout the pubertal period was modeled for each group from individual values, the aBMD at the femoral region was significantly higher in RG compared with the other 2 groups from 12.5 to 14 years, and this difference lasted up to 18 years. Moreover, the mean annual aBMD gain tended to be higher in RG compared with SW and CON only at the femoral region and this gain lasted longer in RG. Bone remodeling markers decreased similarly with age in the 3 groups.
Conclusions: This study, which was based on linear mixed models for longitudinal data, demon-strated that the osteogenic effect of gymnastics is characterized by greater bone mass gain local-ized at mechanically loaded bone (ie, the proximal femur) principally around the menarcheal period. Moreover, the bone mass gain lasts longer in gymnasts, which may be explained by the delay in sexual maturation. (J Clin Endocrinol Metab 98: 2844 –2853, 2013)
I
t has been well established that puberty is associated with increases in bone mass over a relatively brief pe-riod (1, 2). The regular practice of physical activity im-proves bone mass acquisition, as demonstrated byobser-vational (3) and interventional studies in young children (4 – 6). The beneficial effects of exercise on areal bone min-eral density (aBMD), bone geometry, and, consequently, bone strength have been confirmed by cross-sectional
ISSN Print 0021-972X ISSN Online 1945-7197 Printed in U.S.A.
Copyright © 2013 by The Endocrine Society Received January 8, 2013. Accepted April 26, 2013. First Published Online May 10, 2013
Abbreviations: aBMD, areal bone mineral density; BMD, bone mineral density; BMI, body mass index; CON, control; CTX, type I-C telopeptide breakdown products; FFST, fat-free soft tissue; FM, fat mass; OC, osteocalcin; PINP, procollagen type I N-terminal propeptide; RG, rhythmic gymnasts; SDS, standard deviation score; SW, swimmers.
O R I G I N A L A R T I C L E E n d o c r i n e R e s e a r c h
2844 jcem.endojournals.org J Clin Endocrinol Metab, July 2013, 98(7):2844 –2853 doi: 10.1210/jc.2013-1070
Downloaded from ht tps: //academic. oup. com/ jcem/ art icle-abst ract /98/ 7/ 2844/ 2537055 by INS E RM user on 08 A pril 2020
studies in young athletes (7–9). Nevertheless, the favor-able effect seems to be exercise-dependent and only physical activity that generates high mechanical strain induces additional bone mass gain during growth (5, 6). Young elite female gymnasts practice an intensive, weight-bearing sport with well-described osteogenic ac-tivity, as opposed to swimming, a no-impact sport (7, 10, 11). The benefits to gymnasts have been observed despite the high prevalence of delayed menarche and/or secondary amenorrhea or oligomenorrhea (9, 11, 12), both factors known to have a deleterious effect on bone health and peak bone mass acquisition (13). In addition, the difference in aBMD between trained and untrained groups seems to be more marked in the late pubertal stages (9, 11, 14), even though a difference was also reported in the early period (15).
Due to the difficulties in following elite athletes, cross-sectional studies are generally carried out, but this design establishes only a limited causal relationship be-tween exercise and bone density because self-selection may confound the athlete-control comparisons (14). Conversely, the longitudinal design, which is more ap-propriate in sports populations, has received limited attention (14 –17). Moreover, these investigations have generally been conducted in a specific class of age or menarcheal status (15, 16) and thus have not provided data on the kinetics of bone mass acquisition. Never-theless, such data might be interesting because acquisi-tion is not linear over the peripubertal period (14, 17, 18). Last, the investigation of one sport (15–17) does not allow for generalization, as the bone mass gain is specific to the mechanical loading generated by the type of sport.
Individuals who achieve high peak bone mass may be less susceptible in later life to osteoporosis and fracture (19). Consequently, a better understanding of the fac-tors that influence bone gain in early life, like the type of physical activity or the period when bone is most responsive to mechanical loading, may be helpful to develop programs to optimize peak bone mass in young girls. Such data would be useful in building preventive strategies to reduce the risk of osteoporotic fractures later in life (20).
The aim of this study was to compare the effects of 2 intense physical activities (ie, swimming and rhythmic gymnastics) that generate specific mechanical loads on bone. We followed girls with ages ranging from 10 to 18 years for 1 year, and thus, the entire peripubertal period when bone mass undergoes its greatest gains could be investigated.
Subjects and Methods
Subjects
The study protocol was reviewed and approved by the Re-gional Research Ethics Committee (Comité de Protection des Personnes Sud-Mediterranee IV, Montpellier, France), and each child and her parents gave written informed consent before en-tering the study. A total of 72 peripubertal girls with ages ranging from 10.8 to 18.0 years (mean 14.2 ! 1.7) were recruited for this study: 24 rhythmic gymnasts (RG), 24 swimmers (SW), and 24 controls (CON). All the athletes and controls were age-paired (!7 mo) and the age distribution was comparable in the 3 groups (P " .414 data not shown). For RG, SW, and CON, the values were, respectively, 12.4, 12.8, and 13.1 for Q25; 14.7, 13.7 and 14.4 for the median; and 15.9, 15.1 and 15.7 for Q75. The 2 sports groups were composed of girls training more than 8 hours per week (23.0 ! 2.7 for RG and 14.4 ! 4.7 for SW) and who had been practicing their sport for more than 5 years (start of training for RG: 6.8 ! 1.3 y and 6.6 ! 2.2 y for SW). The control group consisted of subjects who performed only leisure physical activities for fewer than 3 hours per week. None had obvious signs of acute or chronic illness known to affect bone health and no long periods of immobilization or fractures within the pre-vious 12 months. None of the participants used calcium or vi-tamin D supplements or declared taking any illicit substances.
Materials and Methods
This study used a 1-year follow-up design. In each partici-pant, standing height was measured with a stadiometer to the nearest 0.1 cm. Weight was determined using a weight scale with a precision of 0.1 kg. Body mass index (BMI) was calculated as weight (kg) divided by the square of height (m), and percentile values are given according to the French standard curves. Pu-bertal development was assessed by breast stage (I to V) accord-ing to the Tanner classification (21) by an experienced pediatric endocrinologist. Bone age was determined using the Greulich and Pyle method (22).
Information regarding pubertal onset in family members was obtained from a standardized questionnaire (menarche of moth-ers). Height standard deviation score (Height SDS) and weight standard deviation score (Weight SDS) were calculated accord-ing to the French standard curves.
Medical and menstrual histories
Each subject or her parents also responded to a medical ques-tionnaire designed to assess general medical and menstrual his-tory from questions concerning the age of menarche.
Physical activity determination
Detailed information about training history was collected, including data on starting age of intensive training, years of ac-tive sport-specific training, number of training sessions per week, training hours per week, and training months per year. Other physical activities were documented with a training recall diary covering the previous 3 years.
Downloaded from ht tps: //academic. oup. com/ jcem/ art icle-abst ract /98/ 7/ 2844/ 2537055 by INS E RM user on 08 A pril 2020
Assays
Blood samples (25 mL) were collected in the morning (0900 –
1100AM) in sterile chilled tubes by standard venipuncture
tech-nique. The samples were allowed to clot at room temperature and were then centrifuged at 2500 rpm for 10 minutes at 4°C. Serum samples were stored at #80°C until analysis. All samples were run in duplicate and, to reduce interassay variation, all the plasma samples were analyzed in a single session. The date of the last menses was not recorded for the pubertal girls, and bone marker values were thus obtained at an unsynchronized men-strual stage.
Concerning bone metabolism, plasma samples were assayed by Cobas 6000 (Roche Diagnostic, Mannheim, Germany) for osteocalcin (OC), procollagen type I N-terminal propeptide (PINP), and type I-C telopeptide breakdown products (CTX). The inter- and intra-assay CVs for the 3 parameters were lower than 7%.
Bone mineral density, body fat, and fat-free soft tissues
Dual-energy x-ray absorptiometry (Hologic QDR-4500A; Hologic, Inc, Waltham, Massachusetts) was used to measure the bone mineral density (BMD; g/cm2) of the whole body, the
an-teroposterior lumbar spine (L2–L4), the dominant arm radius, the total proximal left femur, and specific sites of the femoral neck and the trochanteric areas. The soft tissue body composi-tion (fat mass [FM, kg], percentage body fat mass [%FM], and fat-free soft tissue [FFST, kg]) was derived from the whole-body scan. All scanning and analyses were performed by the same operator to ensure consistency, after following standard quality control procedures. Quality control for DXA was checked daily by scanning a lumbar spine phantom consisting of calcium hy-droxyapatite embedded in a cube of thermoplastic resin (DPA/ QDR-1; Hologic x-caliber anthropometrical spine phantom). For BMD, the laboratory precision error was defined by the CV of repeated measurements; this was found to be 1% at the lumbar spine and $1% at the femoral neck, $1% at the forearm, $0.5% for the whole body, and $1% for FFST and FM. Idtical and accurate positioning of the region of interest was en-sured by superimposing the image from the very first session on the image of the explored bone area; this initial image thus served as the visual reference (23).
Statistical analysis
The characteristics of the young girls entered in the present study are described with proportions for categorical variables and with means and SD values for continuous variables (age, weight, aBMD, etc). The distributions were tested with the Sha-piro-Wilk statistic. The comparisons of means among the 3 groups were performed using ANOVA when data distribution was normal and the Kruskall-Wallis test if continuous variables were skewed. For each BMD site, adjusted means for age, FM, and FFST were computed and compared between groups using multivariate linear regression analysis.
The 1-year relative variations at each BMD site were com-pared between groups after adjustment for age using a mul-tivariate linear regression model. We then determined whether the 1-year relative variation at each BMD site differed from the whole-body BMD in each group. This analysis was performed using a linear mixed model to account for corre-lations between the measures of different BMD sites of each
subject. This model included a subject-specific random inter-cept, and the fixed effects were age, BMD (with “whole body” as the reference), group, and the interaction between the BMD site and group.
The changes in BMD with age were modeled using the mixed model with a subject-specific random intercept; the fixed effects were group, age, age2, age3, and the interaction between age,
age2, age3, and group. We chose a third-degree polynomial
model to obtain a flexible curve with 2 potential inflections. A polynomial with a higher degree did not show a better fit of the data.
Last, we modeled the yearly aBMD change in the 3 groups using a thin plate regression spline model. The results are ex-pressed graphically with their 95% Bayesian confidence interval. In all these analyses, Tukey’s multiple comparison procedures were used to control for the familywise error rate when groups were compared in pairs. Statistical analyses were performed at the conventional two-tailed ! level of 0.05 using SAS version 9.1 (SAS Institute, Cary, North Carolina).
Results
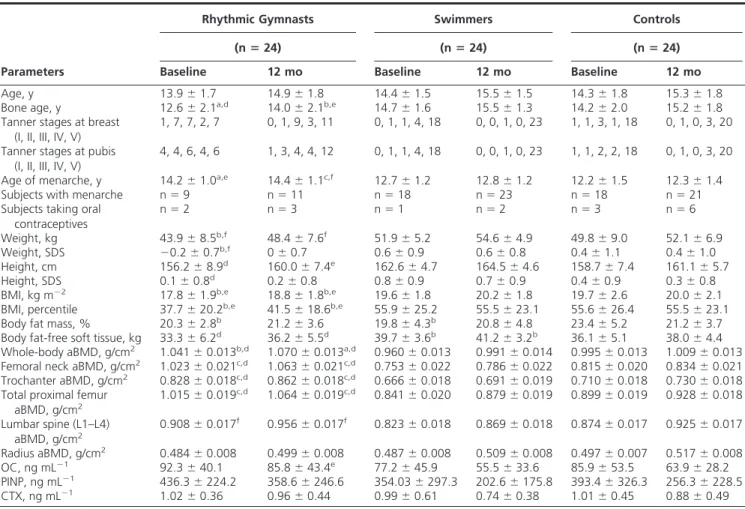
The anthropometric characteristics, body composition, and bone metabolism of the athletes and controls at in-clusion and after 12 months of follow-up are described in Table 1.
The 3 groups did not differ in terms of age. Weight, weight SDS, BMI, and BMI percentile were significantly lower in RG compared with CO and SW. RG was shorter than SW, but height remained within the normal French standard curves as demonstrated by the SDS (0.1 ! 0.8). FM (kg) was significantly lower in both groups of athletes compared with CO, whereas body FM (%) was only lower in RG and FFST was higher in SW compared with the other 2 groups. Bone age and Tanner stages were signif-icantly delayed in RG compared with the other 2 groups. The number of subjects with menarche was reduced (P " .016) and the age of menarche was significantly delayed in RG compared with the other 2 groups (P " .003). The mean age of menarche was 14.4 ! 1.1 years for RG, 12.8 ! 1.2 years for SW, and 12.3 ! 1.4 years for CO. The mean hours of training per week was 23 ! 2.7 for RG and 14 ! 4.7 for SW and the mean age of start of training was 6.8 ! 1.3 years and 6.6 ! 2.2 years, respectively.
Areal BMD
At baseline, RG presented noticeably greater aBMDs adjusted for age, FFST, and FM measured at whole body and the femoral region (femoral neck and trochanter), compared with CON and SW. At the lumbar spine, a higher aBMD value was observed in RG compared with SW only, whereas no difference between groups was dem-onstrated for radius. No difference was observed between CON and SW for any bone site.
2846 Maïmoun et al Bone Mass Acquisition in Female Athletes J Clin Endocrinol Metab, July 2013, 98(7):2844 –2853
Downloaded from ht tps: //academic. oup. com/ jcem/ art icle-abst ract /98/ 7/ 2844/ 2537055 by INS E RM user on 08 A pril 2020
After 1 year of follow-up, a significant increase was observed at all bone sites in the 3 groups. The difference between RG and the other 2 groups persisted at the total proximal femur, a weight-bearing bone site, whereas at the lumbar spine, a less mechanically solicited bone site, no difference between groups was observed. At whole body, aBMD remained higher in RG only compared with SW.
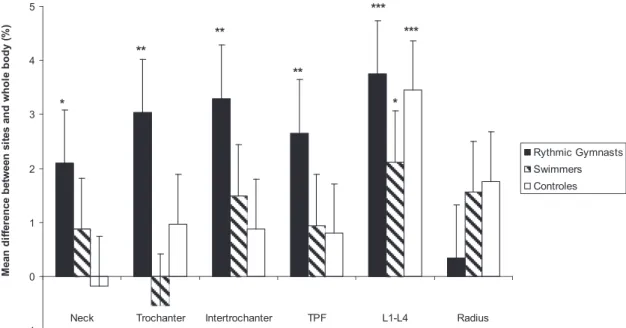
When the mean percentage of the aBMD change was compared in athletes and controls over 1 year, RG pre-sented significantly (P $ .05 to P $ .01) higher values at the total proximal femur (%5.8%) and the trochanter (6%) and introchanter (6.5%) subregions than SW (3.6%, 2%, 4%) and CO (2.9%, 3%, 2.9%). At whole body and other bone sites like L1–L4 and the radius, the changes in aBMD were not significantly different between groups. When the relative variation in aBMD (%) at various bone sites was compared at 1 year with the variation in whole-body aBMD (%) (Figure 1), the gain was significantly higher in the femoral region than at whole body only in RG
by approximately 2% to 3.2%. In the 3 groups, the rela-tive gain in aBMD (%) at L1–L4 was higher than at whole body (mean 2.1 to 3.7%), whereas the mean gain at the radius was comparable to the mean whole body gain and similar between groups.
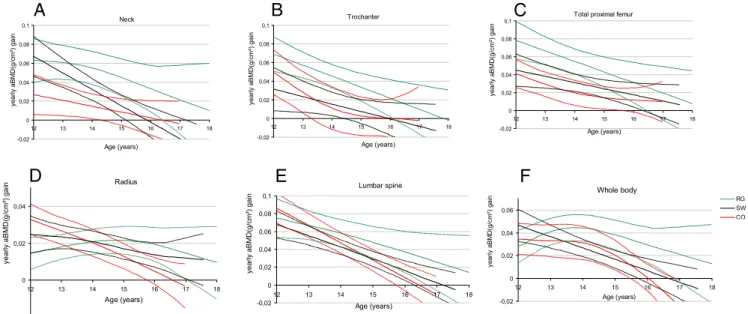
Figure 2 shows the modeling of the aBMD variation throughout the peripubertal period. At the femoral region, aBMD was significantly higher in RG compared with the other 2 groups from 12.5 years at the femoral neck and from 14 years at the trochanter and at the total proximal femur until 18 years. At whole body, the difference be-tween RG and the other 2 groups tended to be higher from approximately 16.8 years. At the radius and lumbar spine, no difference was demonstrated between groups. SW and CO presented similar aBMD variations at all bone sites.
Figure 3 shows the modeling of the mean annual gain in aBMD at various bone sites. For the femoral neck, tro-chanter, total proximal femur, and lumbar spine, the mean annual aBMD gain decreased with age in each group.
Al-Table 1. Anthropometry, Body Composition, and Bone Metabolism of the Athletes and Controls at Baseline and
After 12 months
Rhythmic Gymnasts Swimmers Controls
(n ! 24) (n ! 24) (n ! 24)
Parameters Baseline 12 mo Baseline 12 mo Baseline 12 mo
Age, y 13.9 ! 1.7 14.9 ! 1.8 14.4 ! 1.5 15.5 ! 1.5 14.3 ! 1.8 15.3 ! 1.8
Bone age, y 12.6 ! 2.1a,d 14.0 ! 2.1b,e 14.7 ! 1.6 15.5 ! 1.3 14.2 ! 2.0 15.2 ! 1.8
Tanner stages at breast (I, II, III, IV, V)
1, 7, 7, 2, 7 0, 1, 9, 3, 11 0, 1, 1, 4, 18 0, 0, 1, 0, 23 1, 1, 3, 1, 18 0, 1, 0, 3, 20 Tanner stages at pubis
(I, II, III, IV, V)
4, 4, 6, 4, 6 1, 3, 4, 4, 12 0, 1, 1, 4, 18 0, 0, 1, 0, 23 1, 1, 2, 2, 18 0, 1, 0, 3, 20
Age of menarche, y 14.2 ! 1.0a,e 14.4 ! 1.1c,f 12.7 ! 1.2 12.8 ! 1.2 12.2 ! 1.5 12.3 ! 1.4
Subjects with menarche n " 9 n " 11 n " 18 n " 23 n " 18 n " 21
Subjects taking oral contraceptives n " 2 n " 3 n " 1 n " 2 n " 3 n " 6 Weight, kg 43.9 ! 8.5b,f 48.4 ! 7.6f 51.9 ! 5.2 54.6 ! 4.9 49.8 ! 9.0 52.1 ! 6.9 Weight, SDS #0.2 ! 0.7b,f 0 ! 0.7 0.6 ! 0.9 0.6 ! 0.8 0.4 ! 1.1 0.4 ! 1.0 Height, cm 156.2 ! 8.9d 160.0 ! 7.4e 162.6 ! 4.7 164.5 ! 4.6 158.7 ! 7.4 161.1 ! 5.7 Height, SDS 0.1 ! 0.8d 0.2 ! 0.8 0.8 ! 0.9 0.7 ! 0.9 0.4 ! 0.9 0.3 ! 0.8
BMI, kg m#2 17.8 ! 1.9b,e 18.8 ! 1.8b,e 19.6 ! 1.8 20.2 ! 1.8 19.7 ! 2.6 20.0 ! 2.1
BMI, percentile 37.7 ! 20.2b,e 41.5 ! 18.6b,e 55.9 ! 25.2 55.5 ! 23.1 55.6 ! 26.4 55.5 ! 23.1
Body fat mass, % 20.3 ! 2.8b 21.2 ! 3.6 19.8 ! 4.3b 20.8 ! 4.8 23.4 ! 5.2 21.2 ! 3.7
Body fat-free soft tissue, kg 33.3 ! 6.2d 36.2 ! 5.5d 39.7 ! 3.6b 41.2 ! 3.2b 36.1 ! 5.1 38.0 ! 4.4
Whole-body aBMD, g/cm2 1.041 ! 0.013b,d 1.070 ! 0.013a,d 0.960 ! 0.013 0.991 ! 0.014 0.995 ! 0.013 1.009 ! 0.013
Femoral neck aBMD, g/cm2 1.023 ! 0.021c,d 1.063 ! 0.021c,d 0.753 ! 0.022 0.786 ! 0.022 0.815 ! 0.020 0.834 ! 0.021
Trochanter aBMD, g/cm2 0.828 ! 0.018c,d 0.862 ! 0.018c,d 0.666 ! 0.018 0.691 ! 0.019 0.710 ! 0.018 0.730 ! 0.018
Total proximal femur
aBMD, g/cm2 1.015 ! 0.019 c,d 1.064 ! 0.019c,d 0.841 ! 0.020 0.879 ! 0.019 0.899 ! 0.019 0.928 ! 0.018 Lumbar spine (L1–L4) aBMD, g/cm2 0.908 ! 0.017 f 0.956 ! 0.017f 0.823 ! 0.018 0.869 ! 0.018 0.874 ! 0.017 0.925 ! 0.017 Radius aBMD, g/cm2 0.484 ! 0.008 0.499 ! 0.008 0.487 ! 0.008 0.509 ! 0.008 0.497 ! 0.007 0.517 ! 0.008 OC, ng mL#1 92.3 ! 40.1 85.8 ! 43.4e 77.2 ! 45.9 55.5 ! 33.6 85.9 ! 53.5 63.9 ! 28.2 PINP, ng mL#1 436.3 ! 224.2 358.6 ! 246.6 354.03 ! 297.3 202.6 ! 175.8 393.4 ! 326.3 256.3 ! 228.5 CTX, ng mL#1 1.02 ! 0.36 0.96 ! 0.44 0.99 ! 0.61 0.74 ! 0.38 1.01 ! 0.45 0.88 ! 0.49
The aBMD was adjusted for age, FFST, and FM. Values are presented as means ! SD.
Significant difference between rhythmic gymnasts and controls:aP $ .05;bP $ .01;cP $ .001.
Significant difference between rhythmic gymnasts and swimmers at the same time:dP $ .001;eP $ .05;fP $ .01.
Downloaded from ht tps: //academic. oup. com/ jcem/ art icle-abst ract /98/ 7/ 2844/ 2537055 by INS E RM user on 08 A pril 2020
though the mean annual gain tended to be higher in RG compared with SW and CO at each age, the difference did not reach significance due to the wide dispersions in the values. For RG, the optimal gain at the radius and whole body was observed between 14 to 16 years and 13 to 15 years, respectively, whereas the value decreased from 12 to 18 years in SW and CO. Moreover, for every bone site except the radius, the gain in aBMD tended to be main-tained over time in RG compared with the other 2 groups.
Markers of bone turnover
The concentrations in the biochemical markers of bone turnover are shown in Table 1 and Figure 4. No difference was observed between groups for markers of bone forma-tion (OC and PINP) or bone resorpforma-tion (CTX) at basal evaluation. After 1 year of follow-up, only OC levels were significantly higher in gymnasts than swimmers. More-over, all the markers decreased in swimmers and controls, but not in gymnasts (data not shown). Figure 4 presents
0,6 0,7 0,8 0,9 1 1,1 1,2 12 13 14 15 16 17 18 Neck Age (years) aBMD(g/cm ²)
A
0,6 0,7 0,8 0,9 1 12 13 14 15 16 17 18 Trochanter Age (years) aBMD(g/cm ²)B
0,8 0,9 1 1,1 1,2 12 13 14 15 16 17 18Total proximal femur
Age (years) aBMD(g/cm ²)
C
0,4 0,5 0,6 12 13 14 15 16 17 18 Radius Age (years) aBMD(g/cm ²)D
0,6 0,7 0,8 0,9 1 1,1 1,2 12 13 14 15 16 17 18 Lumbar spine Age (years) aBMD (g /cm ²)E
0,8 0,9 1 1,1 1,2 12 13 14 15 16 17 18 RG SW CO GIB GIH NIB NIH TIB TIH Whole body Age (years) aBMD(g/cm ²)F
Figure 2. Modeling of aBMD gain at various bone sites in rhythmic gymnasts (RG, green), swimmers (SW, black), and controls (CO, red). The dashed curves with the same color represent the 95% confidence interval.
Variation of yearly aBMD percentage change in various sites compared to the percentage change in whole body
-1 0 1 2 3 4 5
Neck Trochanter Intertrochanter TPF L1-L4 Radius
Me an d iff er en ce b et w ee n si te s an d w ho le b od y (% ) Rythmic Gymnasts Swimmers Controles * * ** ** ** *** ***
Figure 1. Variation in yearly aBMD percentage change at various bone sites in athletes and controls compared with the percentage change in whole body. TPF, total proximal femur; L2–L4: lumbar spine. *, Significant difference between aBMD variation at a bone site vs aBMD variation at whole body for the same group (P $ .05), **, P $ .01, ***, P $ .001.
2848 Maïmoun et al Bone Mass Acquisition in Female Athletes J Clin Endocrinol Metab, July 2013, 98(7):2844 –2853
Downloaded from ht tps: //academic. oup. com/ jcem/ art icle-abst ract /98/ 7/ 2844/ 2537055 by INS E RM user on 08 A pril 2020
the modeling of bone marker concentrations throughout the growth period and shows a similar dramatic decrease with age for all markers in every group.
Discussion
Only a few groups have reported that intense exercise im-proves aBMD and bone geometry during the growth pe-riod, on the basis of cross-sectional studies (7, 9, 10). In this work, athletes in 2 sports, each inducing a specific pattern of mechanical load on the skeleton (ie, rhythmic gymnastics, a weight-bearing activity, and swimming, a non-weight-bearing activity), were compared with un-trained subjects. We confirm that only high-impact and weight-bearing activities induce positive adaptive re-sponses in the growing skeleton (7, 9 –11). Our longitu-dinal evaluation reinforces the cross-sectional observa-tions and demonstrates specific bone-site adaptaobserva-tions with different time lags.
The results observed at baseline and after 1 year of follow-up confirm the beneficial effect of rhythmic gym-nastics on skeletal regions specifically submitted to high-impact and repetitive mechanical loads, such as the prox-imal femur (14). The localized effect of exercise was confirmed by the lack of difference between groups at less mechanically solicited bone sites, such as the lumbar spine and radius. Moreover, the comparable aBMDs in swim-mers and controls suggest that a minimum level of strain is necessary to induce noticeable bone adaptation (7, 11, 24). The persistence of higher aBMD at the femoral region in the gymnasts may be explained by a specific model char-acterized by a significantly higher mean yearly aBMD per-centage change associated with a faster increase in the femoral/whole-body aBMD ratio. Conversely, the aBMD values at the lumbar spine and radius at 1 year, the vari-ation in aBMD, and the aBMD ratio at these sites/whole body were not significantly different between groups. All these data indicate that the osteogenic effect of exercise is
0 20 40 60 80 100 120 140 160 12 13 14 15 16 17 18 Co nc en tra tio n (n g/ m l) Osteocalcin Age (years)
A
0 200 400 600 800 1000 1200 12 13 14 15 16 17 18 Co nc en tra tio n (n g/ m l)Procollagen type I N-terminal popeptide
B
Age (years) 0 0,2 0,4 0,6 0,81 1,2 1,4 1,6 1,82 2,2 12 13 14 15 16 17 18 RG SW CO GIB GIH NIB NIH TIB TIH Type-I collagen C-telopeptide breakdown productsCo nc en tra tio n (n g/ m l) Age (years)
C
Figure 4. Modeling of changes in bone biochemical markers (A: osteocalcin; B: procollagen type 1 N-terminal propeptide; C: type-I collagen C-telopeptide breakdown products) in rhythmic gymnasts (RG, green), swimmers (SW, black), and controls (CO, red). The dashed curves with the same color represent the 95% confidence interval.
-0,02 0 0,02 0,04 0,06 0,08 0,1 12 13 14 15 16 17 18 Neck Age (years) yearly aBMD(g/cm ²) gain
A
-0,02 0 0,02 0,04 0,06 0,08 0,1 12 13 14 15 16 17 18 yearly aBMD(g/cm ²) gain Trochanter Age (years)B
-0,02 0 0,02 0,04 0,06 0,08 0,1 12 13 14 15 16 17 18Total proximal femur
Age (years) yearly aBMD(g/cm ²) gain
C
-0,02 0 0,02 0,04 12 13 14 15 16 17 18 Radius Age (years) ye ar ly aB M D (g /cm ²) ga inD
-0,02 0 0,02 0,04 0,06 0,08 0,1 12 13 14 15 16 17 18 Lumbar spine Age (years) yearly aBMD(g/cm ²) gainE
-0,02 0 0,02 0,04 0,06 12 13 14 15 16 17 18 RG SW CO GIB GIH NIB NIH CIB CIH Whole body Age (years) ye ar ly a BM D (g /c m ²) ga inF
Figure 3. Modeling of yearly change in aBMD at various bone sites in rhythmic gymnasts (RG, green), swimmers (SW, black), and controls (CO,
red). The dashed curves with the same color represent the 95% confidence interval.
Downloaded from ht tps: //academic. oup. com/ jcem/ art icle-abst ract /98/ 7/ 2844/ 2537055 by INS E RM user on 08 A pril 2020
region dependent and load dependent. This 1-year fol-low-up of the same participants reduced the potentially confounding role of genetic predisposition, such as a higher basal aBMD, and environmental factors and dem-onstrates the causal effect of exercise by excluding a se-lection bias (16). Longitudinal studies, which have mostly focused on artistic gymnasts, have been few, probably be-cause these young female athletes follow an extremely de-manding regimen (intense training, various competitions, stress, trainer and familial constraints, etc), but they all found a favorable effect of physical activity on bone mass acquisition (14 –16, 25). Only Nickols-Richardson et al (15) found similar 1-year changes in femoral and whole-body aBMD in prepubertal gymnasts and controls. The inclusion of athletes with different training status (years or duration of training), initial aBMD values, and particu-larly age or pubertal stage (14), may explain the divergent results (15).
The mean variations in aBMD observed during this 1-year follow-up or in previous studies (14 –16, 25) are not sufficient to provide great detail on the kinetics of bone mass acquisition throughout the pubertal period. Various phases with different rates of aBMD gain have been de-scribed in both untrained (1, 26, 27) and athletic girls (14, 17, 18) during the growth period. Moreover, bone tissue response may differ according to age or pubertal status (3, 28, 29). Nevertheless, our analysis models derived from mixed longitudinal data, including a broad age range from 10.8 to 18 years, are unique and, for the first time, can be used to determine the bone mass acquisition in elite ath-letes throughout the pubertal period according to the type of sport performed. Our results show that bone mass ac-quisition tends to stabilize at about 18 years for most of the bone sites in controls and swimmers, except for the radius, where aBMD tends to increase over this period only in swimmers. Moreover, our data confirm that the dramatic increase in aBMD is observable during the pre-and peri-menarcheal periods, as previously reported in sedentary (1, 26, 27, 30) and trained young girls (14, 17, 18). Re-cently, Baxter-Jones et al (27) demonstrated that a bone mass plateau was reached in untrained girls at 18.8 years for whole body, at 16.8 years for the lumbar spine, and at 14.8 years for the femoral neck. Interestingly, although the swimmers trained more than 14 hours per week, they pre-sented a profile of bone mass acquisition similar to that of the controls. The nonosteogenic effect of swimming ob-served here is in line with previous cross-sectional studies in prepubertal girls (7, 11, 31), as well as in adult female and male swimmers (32, 33).
Conversely to swimmers, the rhythmic gymnasts pre-sented a specific bone mass acquisition profile. Beyond 14 years, aBMD at the proximal femur was increased
com-pared with controls and swimmers. Moreover, this differ-ence appeared to be accentuated with time, probably due to a cumulative effect of continuous higher annual gain and the persistence of this gain at least up to 18 years. No difference in bone mass acquisition was identified at the radius or lumbar spine, however, and the difference be-tween gymnasts and the other 2 groups at whole body was significant only beyond 16 years. It has been reported that exercise during adolescence has the greatest impact on bone accrual in bone that is mechanically solicited, such as the femoral neck as opposed to the lumbar spine (3, 14, 16). Our data further suggest specific patterns of change in bone sites depending on localization (axial or appen-dicular) (19, 27), composition (cortical or trabecular), and the applied mechanical constraint (weight-bearing or not) (17).
The reduction in bone mass gain with age in the 3 groups was associated with a concomitant reduction in bone modeling/remodeling, as demonstrated by the de-crease in the concentration of bone markers. Nevertheless, no specific variation was observed according to the type of sport, probably because in these young populations, the modification in bone markers induced by growth (34) may partially mask the effect of physical activity (35). This lack of specific bone marker profiles may also be explained by the fact that markers of bone formation and resorption represent an average of the bone turnover in all skeletal sites, and localized BMD gain observed only at mechan-ically loaded sites would not be reflected by a variation in these markers (35). The few studies that have longitudi-nally evaluated bone turnover markers in young athletes (14, 15) reported similar decreases in concentrations with advancing pubertal stages but no differences between con-trols and athletes.
The greater bone mass gain of gymnasts was observed despite delays in the age of menarche, pubertal develop-ment (Tanner stages), and bone age, all well described in elite rhythmic gymnasts (36, 37). This suggests retarded sexual and auxological maturation in these athletes. It has been demonstrated that the onset and length of puberty have strong effects on bone mass acquisition (2, 13, 38). Also, an inverse relationship between the timing of pu-berty and bone mass in early adulthood has been reported (2, 13, 38, 39), suggesting that the time of exposure to estrogen from prepuberty to peak bone mass is an impor-tant factor of bone mass acquisition (40). A more recent study nevertheless suggests that the bone mass difference between healthy girls with earlier vs later menarche is al-ready present at Tanner stage P1 (41). In our study, the delayed sexual maturation did not seem to have a notice-able negative effect on bone mass acquisition because, from 12.4 years—that is, 1.8 years before menarche—the
2850 Maïmoun et al Bone Mass Acquisition in Female Athletes J Clin Endocrinol Metab, July 2013, 98(7):2844 –2853
Downloaded from ht tps: //academic. oup. com/ jcem/ art icle-abst ract /98/ 7/ 2844/ 2537055 by INS E RM user on 08 A pril 2020
rhythmic gymnasts already presented higher aBMD at the femoral neck and normal values at the other, less mechan-ically loaded bone sites (ie, the lumbar spine and radius). This difference appeared more marked at the femoral neck beyond 14 years, a period that corresponds to menarche in gymnasts (mean age 14.4 ! 1.1 y). Various authors have reported that the peaks of bone gain and bone calcium deposition occur around menarche (ie, #0.6 to #0.8 mo before) and decrease afterward (ie, 2 y later) (1, 26, 42). The increase in IGF-1 and estradiol during this period has an essential concerted action on direct bone development in peripuberty (43). Moreover, the increase in estradiol may reduce the set point of the bone mechanostat and thus affect the relation between mechanical loading and bone strength (44, 45). Although we cannot predict the final bone mass, it is probable that the difference in early adult-hood is exacerbated because rhythmic gymnasts present late catch-up growth (36, 46). This was confirmed in our study by the maintenance of aBMD gain in the late pu-bertal stages compared with the other 2 groups. Another element in favor of higher peak bone mass in gymnasts is the systematically higher bone mass in retired gymnasts compared with controls (16, 47, 48).
Although the results presented here are unique, 1 year of follow-up in 3 groups of peripubertal girls with a wide age range (10 –18 y) does not necessarily reflect the vari-ation in bone mass that would be observed by longitudinal evaluation. However, it is extremely difficult to follow young elite athletes with highly demanding schedules (training, competition, traveling, etc) for 8 years. Never-theless, despite the variability in growth and aBMD de-velopment between individuals of the same chronological age, elite athletes represent a highly select group of girls with similar anthropometric characteristics (36), who have been exposed to similar constraints (intense training, nutritional control, stress, etc) since a young age. There-fore, the changes in bone mass observed in this study may adequately reflect the kinetics of bone mass gain in these specific sports, but they cannot be generalized to other trained populations. The bone kinetics in the controls, which were similar to those in previous cross-sectional and longitudinal studies (1, 26, 27, 30), and the inclusion of 3 groups of 6-month age-matched peripubertal girls strongly reinforce the credibility of this study. In the fu-ture, a study with a broader range of ages may help to specify the entire bone mass acquisition period further in gymnasts because the improvement in bone mass gain may start earlier (15) and may be delayed compared with the general population (49, 50).
Conclusion
This study, which was based on linear mixed models for longitudinal data, describes for the first time bone mass acquisition during the pubertal period in 3 groups of girls: those heavily involved in weight-bearing activity, those involved in non-weight-bearing activity, and controls. The osteogenic effect of gymnastics is characterized by greater bone mass gain localized at mechanically loaded bone, principally around the menarcheal period. Moreover, the bone mass gain lasts longer in gymnasts, which may be explained by the delay in sexual maturation. These data strongly suggest that physical exercise that generates high mechanical loading, such as rhythmic gymnastics, should be encouraged during the growth period to op-timize peak bone mass and subsequently reduce fracture risk later in life.
Acknowledgments
The authors express their thanks to the athletes, their parents, the Rhythmic Gymnastics Club of Montpellier, the “Pole France Espoir” for rhythmic gymnastics, the Comité Départementale de l’Hérault de Gymnastique, and the Montpellier and Sète Swim-ming Clubs for their participation. We also thank Marie-Agnès Martin for her excellent technical assistance and Roche Diag-nostics for providing the biochemical kits.
Address all correspondence and requests for reprints to: Charles Sultan, Unité d’Endocrinologie Pédiatrique, Hôpital Ar-naud de Villeneuve, CHU de Montpellier et UM1, 191 Avenue Doyen Gaston Giraud, 34295 Montpellier, Cedex 5, France. E-mail: [email protected].
This work was supported by grants from the Comité de Pro-tection et de Lutte Contre le Dopage (CPLD), the Institut Danone, and the Direction Régionale de la Jeunesse et des Sports (DRDJS) Montpellier.
Disclosure Summary: The authors have no conflicts of inter-est to disclose.
References
1. Theintz G, Buchs B, Rizzoli R, et al. Longitudinal monitoring of bone mass accumulation in healthy adolescents: evidence for a marked reduction after 16 years of age at the levels of lumbar spine and femoral neck in female subjects. J Clin Endocrinol Metab. 1992; 75:1060 –1065.
2. Jackowski SA, Erlandson MC, Mirwald RL, et al. Effect of matu-rational timing on bone mineral content accrual from childhood to adulthood: evidence from 15 years of longitudinal data. Bone. 2011; 48:1178 –1185.
3. Völgyi E, Lyytikäinen A, Tylavsky FA, et al. Long-term leisure-time physical activity has a positive effect on bone mass gain in girls.
J Bone Miner Res. 2010;25:1034 –1041.
4. Hind K, Burrows M. Weight-bearing exercise and bone mineral accrual in children and adolescents: a review of controlled trials.
Bone. 2007;40:14 –27.
5. MacKelvie KJ, Khan KM, Petit MA, Janssen PA, McKay HA. A
Downloaded from ht tps: //academic. oup. com/ jcem/ art icle-abst ract /98/ 7/ 2844/ 2537055 by INS E RM user on 08 A pril 2020
school-based exercise intervention elicits substantial bone health benefits: a 2-year randomized controlled trial in girls. Pediatrics. 2003;112:e447.
6. Mackelvie KJ, McKay HA, Khan KM, Crocker PR. A school-based exercise intervention augments bone mineral accrual in early puber-tal girls. J Pediatr. 2001;139:501–508.
7. Courteix D, Lespessailles E, Peres SL, Obert P, Germain P, Ben-hamou CL. Effect of physical training on bone mineral density in prepubertal girls: a comparative study between impact-loading and non-impact-loading sports. Osteoporos Int. 1998;8:152–158. 8. Tournis S, Michopoulou E, Fatouros IG, et al. Effect of rhythmic
gymnastics on volumetric bone mineral density and bone geometry in premenarcheal female athletes and controls. J Clin Endocrinol
Metab. 2010;95:2755–2762.
9. Maïmoun L, Coste O, Mariano-Goulart D, et al. In peripubertal girls, artistic gymnastics improves areal bone mineral density and femoral bone geometry without affecting serum OPG/RANKL lev-els. Osteoporos Int. 2011;22:3055–3066.
10. Taaffe DR, Snow-Harter C, Connolly DA, Robinson TL, Brown MD, Marcus R. Differential effects of swimming versus weight-bearing activity on bone mineral status of eumenorrheic athletes.
J Bone Miner Res. 1995;10:586 –593.
11. Maimoun L, Coste O, Philibert P, et al. Peripubertal female athletes in high-impact sports show improved bone mass acquisition and bone geometry. Metabolism. 10.1016/j.metabol.2012.11.010. 12. Robinson TL, Snow-Harter C, Taaffe DR, Gillis D, Shaw J, Marcus
R. Gymnasts exhibit higher bone mass than runners despite similar prevalence of amenorrhea and oligomenorrhea. J Bone Miner Res. 1995;10:26 –35.
13. Chevalley T, Bonjour JP, Ferrari S, Rizzoli R. Deleterious effect of late menarche on distal tibia microstructure in healthy 20-year-old and premenopausal middle-aged women. J Bone Miner Res. 2009; 24:144 –152.
14. Lehtonen-Veromaa M, Möttönen T, Irjala K, Nuotio I, Leino A, Viikari J. A 1-year prospective study on the relationship between phys-ical activity, markers of bone metabolism, and bone acquisition in peripubertal girls. J Clin Endocrinol Metab. 2000;85:3726–3732. 15. Nickols-Richardson SM, O’Connor PJ, Shapses SA, Lewis RD.
Lon-gitudinal bone mineral density changes in female child artistic gym-nasts. J Bone Miner Res. 1999;14:994 –1002.
16. Bass S, Pearce G, Bradney M, et al. Exercise before puberty may confer residual benefits in bone density in adulthood: studies in active prepubertal and retired female gymnasts. J Bone Miner Res. 1998;13:500 –507.
17. Maimoun L, Coste O, Galtier F, et al. Bone mineral density acqui-sition in peripubertal female rhythmic gymnasts is directly associ-ated with plasma IGF1/IGF-binding protein 3 ratio. Eur J
Endocri-nol. 2010;163:157–164.
18. Maimoun L, Coste O, Jaussent A, Mariano-Goulart D, Sultan C, Paris F. Bone mass acquisition in female rhythmic gymnasts during puberty: no direct role for leptin. Clin Endocrinol (Oxf). 2010;72: 604 – 611.
19. Bass S, Delmas PD, Pearce G, Hendrich E, Tabensky A, Seeman E. The differing tempo of growth in bone size, mass, and density in girls is region-specific. J Clin Invest. 1999;104:795– 804.
20. Rutherford OM. Is there a role for exercise in the prevention of osteoporotic fractures? Br J Sports Med. 1999;33:378 –386. 21. Tanner J. Growth at Adolescence. Oxford: Blackwell Scientific
Pub-lications; 1962.
22. Greulich WW, Pyle SI. Radiographic Atlas of Skeletal Development
of Hand and Wrist. 2nd ed. Stanford, CA: Stanford University Press;
1959.
23. Orwoll ES, Oviatt SK, Biddle JA. Precision of dual-energy x-ray absorptiometry: development of quality control rules and their ap-plication in longitudinal studies. J Bone Miner Res. 1993;8:693– 699.
24. Maïmoun L, Coste O, Philibert P, et al. Testosterone secretion in elite adolescent swimmers does not modify bone mass acquisition: a 1-year follow-up study. Fertil Steril. 2013;99:270 –278. 25. Nurmi-Lawton JA, Baxter-Jones AD, Mirwald RL, et al. Evidence
of sustained skeletal benefits from impact-loading exercise in young females: a 3-year longitudinal study. J Bone Miner Res. 2004;19: 314 –322.
26. Sabatier JP, Guaydier-Souquières G, Benmalek A, Marcelli C. Evo-lution of lumbar bone mineral content during adolescence and adult-hood: a longitudinal study in 395 healthy females 10 –24 years of age and 206 premenopausal women. Osteoporos Int. 1999;9:476 – 482. 27. Baxter-Jones AD, Faulkner RA, Forwood MR, Mirwald RL, Bailey DA. Bone mineral accrual from 8 to 30 years of age: an estimation of peak bone mass. J Bone Miner Res. 2011;26:1729 –1739. 28. Haapasalo H, Kannus P, Sievanen H, et al. Effect of long-term
uni-lateral activity on bone mineral density of female junior tennis play-ers. J Bone Miner Res. 1998;13:310 –319.
29. Wang QJ, Suominen H, Nicholson PH, et al. Influence of physical activity and maturation status on bone mass and geometry in early pubertal girls. Scand J Med Sci Sports. 2005;15:100 –106. 30. Cadogan J, Blumsohn A, Barker ME, Eastell R. A longitudinal study
of bone gain in pubertal girls: anthropometric and biochemical cor-relates. J Bone Miner Res. 1998;13:1602–1612.
31. Duncan CS, Blimkie CJ, Cowell CT, Burke ST, Briody JN, How-man-Giles R. Bone mineral density in adolescent female athletes: relationship to exercise type and muscle strength. Med Sci Sports
Exerc. 2002;34:286 –294.
32. Nikander R, Sievänen H, Heinonen A, Kannus P. Femoral neck structure in adult female athletes subjected to different loading mo-dalities. J Bone Miner Res. 2005;20:520 –528.
33. Maïmoun L, Lumbroso S, Manetta J, Paris F, Leroux JL, Sultan C. Testosterone is significantly reduced in endurance athletes without impact on bone mineral density. Horm Res. 2003;59:285–292. 34. van Coeverden SC, Netelenbos JC, de Ridder CM, Roos JC,
Popp-Snijders C, Delemarre-van de Waal HA. Bone metabolism markers and bone mass in healthy pubertal boys and girls. Clin Endocrinol
(Oxf). 2002;57:107–116.
35. Maïmoun L, Sultan C. Effects of physical activity on bone remod-eling. Metabolism. 2011;60:373–388.
36. Georgopoulos N, Markou K, Theodoropoulou A, et al. Growth and pubertal development in elite female rhythmic gymnasts. J Clin
En-docrinol Metab. 1999;84:4525– 4530.
37. Georgopoulos NA, Markou KB, Theodoropoulou A, Benardot D, Leglise M, Vagenakis AG. Growth retardation in artistic compared with rhythmic elite female gymnasts. J Clin Endocrinol Metab. 2002;87:3169 –3173.
38. Gilsanz V, Chalfant J, Kalkwarf H, et al. Age at onset of puberty predicts bone mass in young adulthood. J Pediatr. 2011;158:100 – 105, 105.e1–2.
39. Baxter-Jones AD, Burrows M, Bachrach LK, et al. International longitudinal pediatric reference standards for bone mineral content.
Bone. 2010;46:208 –216.
40. Chevalley T, Bonjour JP, Ferrari S, Rizzoli R. Pubertal timing and body mass index gain from birth to maturity in relation with femoral neck BMD and distal tibia microstructure in healthy female subjects.
Osteoporos Int. 2011;22:2689 –2698.
41. Chevalley T, Bonjour JP, Ferrari S, Rizzoli R. The influence of pu-bertal timing on bone mass acquisition: a predetermined trajectory detectable five years before menarche. J Clin Endocrinol Metab. 2009;94:3424 –3431.
42. Abrams SA, O’Brien KO, Stuff JE. Changes in calcium kinetics as-sociated with menarche. J Clin Endocrinol Metab. 1996;81:2017– 2020.
43. Xu L, Wang Q, Lyytikäinen A, et al. Concerted actions of insulin-like growth factor 1, testosterone, and estradiol on peripubertal bone growth: a 7-year longitudinal study. J Bone Miner Res. 2011; 26:2204 –2211.
2852 Maïmoun et al Bone Mass Acquisition in Female Athletes J Clin Endocrinol Metab, July 2013, 98(7):2844 –2853
Downloaded from ht tps: //academic. oup. com/ jcem/ art icle-abst ract /98/ 7/ 2844/ 2537055 by INS E RM user on 08 A pril 2020
44. Schiessl H, Frost HM, Jee WS. Estrogen and bone-muscle strength and mass relationships. Bone. 1998;22:1– 6.
45. Frost HM. On the estrogen-bone relationship and postmenopausal bone loss: A new model. J Bone Miner Res. 1999;14:1473–1477. 46. Georgopoulos NA, Markou KB, Theodoropoulou A, et al. Height
velocity and skeletal maturation in elite female rhythmic gymnasts.
J Clin Endocrinol Metab. 2001;86:5159 –5164.
47. Eser P, Hill B, Ducher G, Bass S. Skeletal benefits after long-term retirement in former elite female gymnasts. J Bone Miner Res. 2009; 24:1981–1988.
48. Erlandson MC, Kontulainen SA, Chilibeck PD, Arnold CM, Faulkner RA, Baxter-Jones AD. Higher premenarcheal bone mass in elite gymnasts is maintained into young adulthood after long-term retirement from sport: a 14-year follow-up. J Bone Miner Res. 2012; 27:104 –110.
49. Recker RR, Davies KM, Hinders SM, Heaney RP, Stegman MR, Kimmel DB. Bone gain in young adult women. JAMA. 1992;268: 2403–2408.
50. Lin YC, Lyle RM, Weaver CM, et al. Peak spine and femoral neck bone mass in young women. Bone. 2003;32:546 –553.
Downloaded from ht tps: //academic. oup. com/ jcem/ art icle-abst ract /98/ 7/ 2844/ 2537055 by INS E RM user on 08 A pril 2020