HAL Id: cea-02353204
https://hal-cea.archives-ouvertes.fr/cea-02353204
Submitted on 20 Nov 2019HAL is a multi-disciplinary open access archive for the deposit and dissemination of sci-entific research documents, whether they are pub-lished or not. The documents may come from teaching and research institutions in France or abroad, or from public or private research centers.
L’archive ouverte pluridisciplinaire HAL, est destinée au dépôt et à la diffusion de documents scientifiques de niveau recherche, publiés ou non, émanant des établissements d’enseignement et de recherche français ou étrangers, des laboratoires publics ou privés.
Infrared Spectroscopy of Discrete Uranyl Anion
Complexes
Gary Groenewold, Anita Gianotto, Michael Mcilwain, Michael van Stipdonk,
Michael Kullman, Travis Cooper, David Moore, Nick Polfer, Jos Oomens, Ivan
Infante, et al.
To cite this version:
Gary Groenewold, Anita Gianotto, Michael Mcilwain, Michael van Stipdonk, Michael Kullman, et al.. Infrared Spectroscopy of Discrete Uranyl Anion Complexes. Journal of Physical Chemistry A, American Chemical Society, 2008, 112 (3), pp.508-521. �10.1021/jp077309q�. �cea-02353204�
Infrared Spectroscopy of Discrete Uranyl Anion
1
Complexes
2
Gary S. Groenewold,* Anita K. Gianotto, and Michael E. McIlwain 3
Idaho National Laboratory, Idaho Falls, ID, USA 4
Michael J. Van Stipdonk,* Michael Kullman, and Travis J. Cooper 5
Wichita State University, Wichita, KS, USA 6
David T. Moore, Nick Polfer, and Jos Oomens 7
FOM Instituut voor Plasmafysica Rijnhuizen, Nieuwegein, The Netherlands. 8
Ivan Infante, Lucas Visscher 9
Vrije Universiteit Amsterdam, The Netherlands 10
Bertrand Siboulet 11
DEN/DRCP/SCPS, CEA Marcoule, 30207, Bagnols-sur-Cèze cedex, France 12
Wibe A. de Jong 13
Pacific Northwest National Laboratory, Richland, WA, USA 14
AUTHOR ADDRESS: Idaho National Laboratory, P. O. Box 1625, Idaho Falls, ID 83415-2208 15
AUTHOR EMAIL ADDRESS: [email protected] 16
RECEIVED DATE (automatically inserted by publisher);
17
TITLE RUNNING HEAD: Discrete Uranyl Anion Complexes 18
ABSTRACT: The Free-Electron Laser for Infrared Experiments (FELIX) was used to study the 1
wavelength-resolved multiple photon dissociation of discrete, gas phase uranyl (UO22+) complexes
2
containing a single anionic ligand (A), with or without ligated solvent molecules (S). The uranyl 3
antisymmetric and symmetric stretching frequencies were measured for complexes with general formula 4
[UO2A(S)n]+, where A was either hydroxide, methoxide, or acetate; S was water, ammonia, acetone, or
5
acetonitrile; and n = 0-3. The values for the antisymmetric stretching frequency for uranyl ligated with 6
only an anion ([UO2A]+) were as low or lower than measurements for [UO2]2+ ligated with as many as
7
five strong neutral donor ligands, and are comparable to solution phase values. This result was 8
surprising because initial DFT calculations predicted values that were 30–40 cm-1 higher, consistent 9
with intuition but not with the data. Modification of the basis sets and use of alternative functionals 10
improved computational accuracy for the methoxide and acetate complexes, but calculated values for 11
the hydroxide were greater than the measurement regardless of the computational method used. 12
Attachment of a neutral donor ligand S to [UO2A]+ produced [UO2AS]+, which produced in only very
13
modest changes to the uranyl antisymmetric stretch frequency, and did not universally shift the 14
frequency to lower values. DFT calculations for [UO2AS]+ were in accord with trends in the data, and
15
showed that attachment of the solvent was accommodated by weakening of the U-anion bond as well as 16
the uranyl. When uranyl frequencies were compared for [UO2AS]+ species having different solvent
17
neutrals, values decreased with increasing neutral nucleophilicity. 18
KEYWORDS: IRMPD, DFT, actinide, free electron laser, coordination complex, mass spectrometry 19
20
INTRODUCTION 1
The chemical behavior of uranium in general, and the linear uranyl dication [UO2]2+ in particular, is
2
diverse on account of the relative ease of redox processes,1 and the availability of f and d orbitals2-4 for 3
complex formation. The latter has a profound affect on the solubility of the element.5,6 In solution, 4
[UO2]2+ is the dominant species,6-8 where it plays an important role in heavy element separations9 and in
5
mobility of the element in the environment.10 At low pH, [UO2]2+ exists as the solvated dication in
6
solution with weakly complexing anions.10 Hydrolysis11,12 at higher solution pH values, or the presence 7
of more strongly coordinating anions, produces uranyl complexes coordinated by one or more anionic 8
ligands.8,13 9
The chemical diversity of species has motivated research in vibrational spectroscopy and 10
computational chemistry to understand the coordination and nature of bonding in uranyl complexes 11
containing different ligands because these factors have reactivity and stability implications.14,15 Infrared 12
and Raman spectroscopy studies of [UO2]2+ have shown that the respective antisymmetric (3) and
13
symmetric (1) stretching frequencies16 act as convenient “thermometers” for gauging the
electron-14
donating capability of the equatorial ligand field, because the frequencies are strongly correlated with 15
the coordination environment. Nucleophilic ligands in the coordination sphere donate electron density to 16
the cationic metal center, and this spills over into the *-antibonding orbitals of the uranyl ion to cause a 17
concomitant decrease in the associated 1 and 3 frequencies. Increased electron density at the uranium
18
metal center can be effected by attachment of more donor ligands,17 or by increasing the nucleophilicity 19
of the ligands.18,19 Generally for a modestly complexing solution environment, 3 values near 960 cm-1
20
are typical,18 as originally reported by Jones and Penneman in 1953.20 However, when more strongly 21
basic ligands like hydroxide7,12,21,22 are present, the resulting complexes exhibit much lower 3 values,
22
which have been noted in both solutions23,24 and solids.25-28 Similar trends for the symmetric 1 stretch
23
are seen in Raman spectra12,15,29 and strong correlations between 1 and 3 frequencies have been
established.30 Increasing the local electron density at the metal center in other ways, such as by formal 1
reduction (to UO2+)24,31 or substitution of a more electron-rich metal (i.e. Np, Pu, Am), produces a
2
similar effect.29,32 3
Computational chemistry2,3 helps provide a quantitative understanding of structure and bonding in 4
uranyl complexes. Impressive progress has been made using density functional theory (DFT),33-36 which 5
is remarkable given the theoretical difficulty of accounting for the large number of electrons, spin-orbit 6
coupling, and relativistic effects encountered in modeling uranyl molecules.33,35 The computational 7
results are strongly influenced by the choice of functional, basis set and effective core potential 8
employed.37,38 Vibrational frequencies generated using DFT37,39,40 are invaluable because they provide a 9
basis for the interpretation of spectroscopy experiments. However, comparisons between theory and, for 10
example, solution-phase experimental studies are complicated because multiple species may be present 11
in solution8,41 as a result of rapid ligand exchange, ion pair formation, redox reactions, and solvent 12
effects.1,7,11,12,17,42 Because vibrational spectra collected from solution-phase experiments potentially 13
contain contributions from multiple species, comparisons to results produced by DFT calculations 14
(which are generated for discrete, well-defined species) are difficult. Longer-range interactions with the 15
second solvation sphere also influence the spectroscopy of the complexes, and further complicate 16
comparisons. An elegant way around this is to compare DFT results to structures determined using X-17
ray crystallography, however the effect of neighboring molecules in the crystal lattice is a complicating 18
factor.43 19
An alternative approach for converging vibrational spectroscopy and computational chemistry is to 20
measure the infrared spectra of discrete species isolated in the gas phase,44 which can be accomplished 21
using a trapped ion mass spectrometer (MS) (e.g., a Fourier transform ion cyclotron resonance [FT-ICR] 22
or quadrupole ion trap instrument) interfaced to a high intensity, tunable infrared source that is provided 23
by a free electron laser.41,44-47 Using electrospray ionization (ESI),48-51 a wide range of UO22+ species52-55
24
can be formed and isolated in the FT-ICR-MS. Normally, ion concentrations in the gas phase are too 25
low to enable direct absorption measurements, but by rapid absorption of 10s to 100s of photons, the 1
vibrational energy of a discrete species may be raised to the point where bond cleavage occurs.44,56 In 2
this case, photon absorption is signaled by a change in ion mass, and plotting ion intensities as a 3
function of wavelength produces infrared multiple photon dissociation (IRMPD) spectra which bear 4
strong similarity to those measured using conventional absorption approaches.57-59 5
In prior research campaigns, the IRMPD strategy was used to produce spectra of discrete uranyl-6
solvent complexes [UO2Sn=2-5]2+ where S = acetone (ACO) and or acetonitrile (ACN).60 The uranyl 3
7
frequency underwent systematic red shifts with serial addition of donor ligands, and with substitution of 8
a stronger nucleophilic ligand for a weaker one (e.g. ACO for ACN). Interestingly, the uranyl 3
9
frequencies measured using IRMPD were never as low as the value for UO22+ in solution,20 despite the
10
fact that the ligands in the gas-phase experiments (ACO and ACN) were stronger nucleophiles than H2O
11
(the dominant ligand in solution). This observation led to conjecture that additional interactions may be 12
contributing to the observed uranyl shift in solution-phase experiments. 13
The subject of this report is the IRMPD spectroscopy of gas-phase [UO2A]+ species (where anion A =
14
OH, OCH3, and acetate (OAc)), and complexes in which [UO2A]+ is modified by the attachment of a
15
single neutral donor solvent S, to form [UO2AS1-2]+ (where S = H2O, NH3, ACN, or ACO). The
16
hydroxide and acetate anions are representative of those commonly encountered in solution-phase 17
studies of UO22+ speciation,61 and acetate and methoxide are models for functional groups expected to
18
interact with UO22+ in biological and geochemical environments. The primary focus of this work is to
19
explore and understand the trends in the antisymmetric uranyl stretching frequency (3), as a function of
20
the number and binding strength of the various anionic and neutral ligands, by comparing the 21
experimental IRMPD results with predictions from electronic structure calculations employing several 22
different computational methods. In general, the measured 3 frequencies for the bare anion complexes
23
were significantly lower than the predicted computational values, and approached those measured in 24
solution for coordinatively saturated UO 2+. Addition of a neutral donor to form [UO AS]+ did not 25
substantially alter the 3 values compared to [UO2A]+, which was surprising because prior studies
1
showed that the antisymmetric stretch is systematically red-shifted upon attachment of a donor neutral 2
ligand. Comparison of the 3 values for different [UO2AS]+ complexes showed a systematic decrease
3
with increasing nucleophilicity of the neutral donor S. DFT calculations also suggested that when the 4
neutral is added bonding is accommodated by weakening both the uranyl-anion bond, as well as the 5
uranyl moiety. 6
EXPERIMENTAL 7
IRMPD spectra were collected at the Free Electron Laser for Infrared eXperiments (FELIX) facility, 8
located at the FOM Instituut voor Plasmafysica ‘Rijnhuizen’ (Nieuwegein, The Netherlands).47 The free 9
electron laser is interfaced to a custom-built Fourier transform ion cyclotron resonance (FT-ICR) mass 10
spectrometer.57,62 11
Generation of Uranyl Complexes by Electrospray Ionization (ESI). ESI was used to generate singly- 12
and doubly-charged uranyl complexes.52,54 A one millimolar solution of uranyl nitrate was generated by 13
dissolving the hexahydrate salt (Fluka/Sigma-Aldrich, St. Louis, MO, USA) in water to produce uranyl 14
complexes that were introduced into the hexapole ion accumulation chamber. The ESI source 15
(Micromass, Manchester, U.K.) was operated at 3 kV with respect to ground. Ions were generated at 16
atmospheric pressure and were extracted into vacuum using ion optics oriented orthogonally with 17
respect to the spray axis, and then gated into a hexapole ion accumulation chamber where they were 18
stored for 0.5–1.0 s prior to being transmitted into the FT-ICR-MS. The mass spectra observed were 19
sensitive to various temperatures, voltages and carrier-gas and solution flow rates of the ESI source. 20
Particularly important were the desolvation temperature54 (which was controlled by a heater and 21
thermocouple on the block through which the spray capillary passed) and the temperature of the 22
desolvation gas, which were maintained at 29 and 52oC, respectively. The flow rate of the spray solution 23
was 25 l min-1, and the desolvation gas (N2, which ensheathed the solution spray) flow rate was
maintained at 30 L min-1. Attempts to make hydrated [UO2NO3]+ were not successful because traces of
1
methanol, acetone, acetonitrile, acetic acid and ammonia in the spray chamber resulted in production of 2
hydroxide, methoxide and acetate complexes. By increasing the radio frequency power on the ion 3
accumulation hexapole, most of the ion population was converted to [UO2OH]+, [UO2OCH3]+ and
4
[UO2OAc]+; these species were also formed as complexes with a single solvent molecule (see below),
5
which provided the ensemble of species for infrared spectroscopy. 6
Fourier Transform Ion Cyclotron Resonance Mass Spectrometry (FT-ICR-MS), and Infrared 7
Multiphoton Dissociation (IRMPD):46,57,59 Ions accumulated in the external hexapole were gated into 8
the ICR cell, where complexes identified for IRMPD were isolated using a stored waveform inverse 9
Fourier transform (SWIFT) pulse.63 This ejected all species except those having the desired mass. 10
Isolated ionic complexes were irradiated using two FELIX macropulses, which induced elimination of a 11
solvent molecule, a radical or a rearrangement product (depending on the complex) when the incident 12
wavelength matched an absorption band. The IRMPD mechanism has been described in detail 13
elsewhere.45,62,64 Briefly, it involves sequential, non-coherent absorption of many (tens to hundreds) 14
infrared photons, with each photon being “relaxed” by intramolecular vibrational redistribution (IVR) 15
before the next one is absorbed. In this way, the internal vibrational energy of the molecule can be 16
resonantly increased above the dissociation threshold, resulting in fragmentation. It has been shown that 17
the infrared spectra obtained are comparable to those obtained using linear absorption techniques.56,65 18
FELIX (60 mJ per macropulse, 5 s pulse duration, bandwidth 0.2 – 0.5 % of central ) was scanned 19
primarily through the spectral region of interest around 10 m, in increments < 0.04 µm, after which 20
IRMPD product ions and un-dissociated precursor ions were measured using the excite/detect sequence 21
of the FT-ICR-MS.66,67 The IRMPD efficiency was then expressed as –log(1-[summed fragment ion 22
yield]), corrected for the width of the acquisition channels and linearly normalized to correct for 23
variations in FELIX power over the spectral range. Peak centers were chosen by fitting a Gaussian peak 24
to the data using Origin plotting software(version 7.5, OriginLab, Northampton, MA). Precision was 25
not evaluated, on account of the time required for repetitive acquisition of the peak profiles, and the 1
precious nature of beam time at FELIX. Nevertheless, the precision of measurement of peak position is 2
probably on the order of a couple of cm-1, based on earlier examination of the position(s) of the 3
antisymmetric uranyl stretch and carbonyl C=O stretch in double charged complexes.60 4
Because some of the complexes were difficult to fragment, signal-to-noise was less than desired, and 5
so the isolated complexes were subjected to multiple irradiation/acquisition sequences at each 6
wavelength across the scanned region. This lengthened acquisition time, and this factor together with the 7
need to strictly economize beam time at the FELIX FT-ICR-MS beamline constrained data acquisition 8
for most complexes to the diagnostic O=U=O antisymmetric stretch (3).
9
Density Functional Theory (DFT) Structure and Frequency Calculations. DFT calculations were 10
performed using several different approaches, which varied in treatment of relativistic and core 11
polarization effects, functional, basis set, and software package used. This was done to compare
12
approaches that are commonly available and executable by non-specialists with more advanced methodologies
13
that require access to substantial computational power.
14
(1) Calculations using local density approximation (LDA) with the Vosko, Wilk and Nusair (VWN) 15
parameterization68,69 were performed using the Accelrys Inc. DMol3 suite.70,71 This approach was 16
employed because these calculations could be readily executed and provided an instant theoretical 17
feedback on the recorded spectra. This efficiency is in large part due to use of a semi-core 18
pseudopotential72 was applied to describe the core electrons, combined with the use of polarized 19
numerical basis sets (DNP) for the active electrons. A fine (10-8) energy convergence criterion was 20
employed to ensure optimal geometries and representative vibrational frequencies. With this approach it 21
was possible to calculate most structures in only a few hours using eight processors. No scaling of the 22
calculated frequencies was performed. 23
(2) DFT calculations of structures and harmonic frequencies with the more accurate hybrid B3LYP 24
functional73,74 were performed with the NWChem75,76 and Gaussian77 suite of programs. Different 25
combinations of functionals and basis sets were employed in efforts to derive a consistent view of the 1
IRMPD phenomena measured in the context of complex structure and dissociation behavior. Uranium 2
was described by an effective core potential and its associated basis set: either the LANL2dz ECP and 3
orbital basis set78 or the MWB60 ECP and basis set (SDD),83-86 which features Stuttgart/Dresden 4
effective core potentials were used for uranium. Other atoms in the complexes (O, C, H, and N) were 5
described using the aug-cc-pVDZ orbital basis sets,79 the D95V basis set,83-86 the all-electron 3-21g* 6
basis sets, or the 6-31+g(d) basis set. The relatively small 3-21g basis (which include single first 7
polarization functions on row 2 atoms) set is generally considered to be too small for use in modeling 8
actinide molecules, but one goal of this study was to evaluate the use of the SDD/3-21g* general basis 9
set approach for interpretation of gas-phase IRMPD experiments. 10
(3) In addition NWChem was used to perform correlation corrected vibrational self consistent field 11
(cc-VSCF) calculations80-82 that provide an estimate of the effect of anharmonicity and mode-coupling 12
for the fundamental vibrational states. Starting with the vibrational self-consistent field (VSCF) 13
method, degenerate perturbation theory is used to correct for effects of correlation between different 14
vibrational modes, enabling calculation of anharmonic vibrational states for polyatomic molecules. 15
(4) Finally we also employed the ADF2006.0187 package to quantitatively assess the donation of the 16
ligands to the uranyl moiety and to compute the energetic requirements for different dissociation 17
channels. Prior experience indicated reliable thermodynamic accuracy and thus motivated this approach. 18
Geometric parameters (structures and frequencies) were thereby determined at the scalar relativistic 19
ZORA88-PW9189-TZ2P level of theory using a restricted DFT and a small frozen core, while 20
fragmentation energies were computed including spin-orbit coupling terms. The charge transfer between 21
ligands and the uranyl was analyzed using both Hirshfeld charge analysis and Voronoi Deformation 22
Density (VDD) methods. The energy differences reported do not reflect energies to transition states 23
(which may be relevant for the loss of H2O from [UO2OH(ACO)]+ and photo-fragmentation of
24
[UO2OCH3]+).
RESULTS AND DISCUSSION 1
IRMPD of Uranyl-Hydroxide Complexes [UO2OH]+. Electrospray ionization mass spectrometry of
2
aqueous uranyl nitrate solutions modified with organic solvents had previously been shown to produce 3
dications ligated with neutral donors, provided the capillary temperature was kept close to ambient.54,60 4
However, by modestly increasing the capillary temperature and the RF power of the ion accumulation 5
hexapole, uranyl ion pairs were formed that enabled examination of their IRMPD spectra, as a 6
complement to prior measurements made for the uranyl dication bound with neutral ligands.60 A 7
prominent [UO2OH]+ ion was produced at m/z 287, and lower abundance complexes were observed at
8
m/z 345, 328, 305 and 304 that correspond to [UO2OH(ACO)]+, [UO2OH(ACN)]+, [UO2OH(H2O)]+and
9
[UO2OH(NH3)]+, respectively. The ammonia, acetone, and acetonitrile were present in the hexapole
10
accumulation region of the ESI/FT-ICR instrument from prior experiments that involved the use of the 11
solvents and ammonium acetate buffer solutions. The five different hydroxide complexes that were 12
furnished by manipulation of the electrospray conditions were isolated using a SWIFT sequence,67 and 13
then photo-fragmented by scanning the free electron laser over the spectral region corresponding to the 14
uranyl antisymmetric stretching frequency (~ 1000 cm-1); the resulting IRMPD spectra are shown in 15
Figure 1. 16
Photo-fragmentation of [UO2OH]+ resulted in reductive elimination of a hydroxyl radical, and the
17
antisymmetric uranyl 3 stretch for this species appeared as a broadened absorption centered at 971 cm-1
18
(Figure 1). The low abundance and profile of the peak reflected inefficient photo-fragmentation and high 19
energetic requirements:44 Calculations using ZORA-PW91-TZ2P (vide infra) indicated that the energy 20
to dissociate the complex to [UO2]+ and a hydroxyl radical was 96.4 kcal mol-1. The 3 value for
21
[UO2OH]+ was lower than the most red-shifted dication complexes [UO2(ACO)4]2+ (988 cm-1) and
22
[UO2(ACN)5]2+ (995cm-1), which suggested at first glance that a single hydroxide transfers as much or
23
more electron density to the uranium center as does four or five strong donors in a fully coordinated 24
uranyl complex. This conclusion was surprising, and in fact opposed the results of VDD analyses, that 25
indicated a charge transfer of 0.52 e from the hydroxide to the uranyl, while the charge transfer from 1
four acetones accounted for 0.62 e. 2
3
4
Figure 1. Infrared multiple photon dissociation spectra of the antisymmetric O=U=O stretching region
5
for [UO2OH]+ and ligand complexes containing (clockwise) a single ACN, H2O, NH3, and ACO. The
6
yield values for the ACN complex were multiplied by a factor of two, to visually distinguished it from 7
the unmodified hydroxide complex. 8
The value for the [UO2OH]+ uranyl antisymmetric stretching frequency was lower than anticipated
9
based on prior DFT calculations using B3LYP. A red shift of 183 cm-1 was calculated for [UO2(OH)2]
10
by Marsden and coworkers;40 subtraction of this value from 1140 cm-1 (the value calculated for 11
unligated [UO2]2+)38 produces a frequency of 957 cm-1 for the bis-hydroxy complex. The measured
12
value of 971 cm-1 for the monohydroxy cannot be compared directly, because the modeled and measured 13
complexes are different. But the values are reasonably close to each other, which suggests that most of 14
the red shift results from attachment of the first OH- ligand, and that attachment of the second ligand 15
produces a much more modest change in frequency. This trend is in qualitative agreement with very 1
small shifts produced by attachment of neutral donors to [UO2A]+ complexes (vide infra).
2
The [UO2OH]+3 value measured in the gas phase is very close to that measured in aqueous solution
3
for [UO2]2+ (960 to 965 cm-1), which is considered to have five inner sphere aquo ligands.17,18,20,90,91
4
Lower values have been measured for hydroxide complexes in solution, but these have been attributed 5
to species having multiple uranyl moieties, e.g. a 3 measurement at ~ 940 cm-1 has been assigned to
6
[(UO2)2(OH)2]2+,17,21,92 and an even lower 3 value of 923 cm-1 to [(UO2)3(OH)5]+.17,92 These 3
7
measurements indicate that the frequency is decreased by the presence of more than one U atom in the 8
complexes, but are also certainly influenced by coordinated solvent molecules. 9
The appearance of [UO2OH]+ complexed with one or more solvent molecules enabled the effect of
10
neutral donor ligands on the antisymmetric stretching frequency to be examined. The prior study of 11
[UO2]2+ complexes with neutral ligands60 showed that the antisymmetric stretching frequency was
12
sequentially red-shifted by the serial attachment of additional neutral donor ligands, for example in the 13
acetone (ACO) complexes [UO2(ACO)n]2+, the frequency decreased from 1017 to 1000 to 988 cm-1 as n
14
went from 2 to 3 to 4 (respectively).60 The trend measured for a series of acetonitrile (ACN) complexes 15
was similar, as was the magnitude of the red shift caused by an additional donor neutral. These 16
observations led to the expectation that attachment of a neutral donor to [UO2OH]+ would result in a
17
similar red shift. 18
Isolation and photo-fragmentation of [UO2OH(ACO)]+ resulted in parallel elimination reactions: loss
19
of intact ACO, and loss of H2O (Scheme 1, Table 1). Computationally, the two pathways were found to
20
have very similar reaction energies: using ZORA-PW91-TZ2P both channels were endothermic by 41.4 21
kcal/mol, and a similar conclusion was derived using B3LYP/LANL2dz/aug-cc-pVDZ, which predicted 22
values of 46.5 and 42.6 kcal/mol for loss of ACO and H2O respectively. The loss of H2O involves
23
transfer of a proton from a methyl carbon on ACO to the hydroxide, leaving behind the acetone enolate 24
which calculations show remains coordinated through the oxygen atom. No difference in frequencies 25
was observed in the two photo-fragment channels, which had maxima at 972 cm-1. This value was 1
effectively equal to the measurement for the unmodified [UO2OH]+, which initially would seem to
2
indicate that addition of the strong ACO donor had no further effect on the uranyl moiety. However, this 3
conclusion is inconsistent with the fairly strong binding predicted by the PW91 and B3LYP calculations. 4
Furthermore, the carbonyl stretching region for the [UO2OH(ACO)]+ complex was scanned and an
5
absorption with a value of 1633 cm-1 was found. In our previous study of [UO2(ACO)n]2+ complexes, we
6
observed that the ligand CO stretch was strongly red-shifted to 1515 cm-1 in the n=2 complex, and that 7
this shift decreased with increasing cluster size, to 1583 for n=3 and 1630 for n=4, as the binding energy 8
per ligand was reduced.60,93 Thus based on this comparison of carbonyl stretching data, one would 9
expect the binding of the ACO ligand in the [UO2OH(ACO)]+ complex to be comparable to binding in
10
the [UO2(ACO)4]2+ complex. Interestingly, addition of a second and third ACO ligand to
11
[UO2OH(ACO)]+ produced red-shifts consistent with the prior experiments. Photo-fragmentation of
12
[UO2OH(ACO)2]+ and [UO2OH(ACO)3]+ both resulted in the loss of an ACO, with a 3 of 961 and 948
13
cm-1 respectively. Therefore, a red-shift of 11 and 13 cm-1 were observed on going from 14
[UO2OH(ACO)]+ [UO2OH(ACO)2]+ to [UO2OH(ACO)]+, which agrees well with the magnitude of the
15
red-shifts resulting from ACO addition to the [UO2(ACO)n]2+ complexes.60 Taken together, these results
16
suggest that it may be the uranyl antisymmetric stretching frequency in the bare [UO2OH]+ complex that
17
is anomalously shifted, which is certainly possible given the particular susceptibility of this very small 18
system to anharmonicity effects arising from the IRMPD mechanism. These anharmonicity effects are 19
examined in more detail below. 20
U O O OH O C H3C H3C U O O O C H2C H3C U O O OH + + + + ACO + H2O 1
Scheme 1. Parallel elimination reactions of isolation and photo-fragmentation of [UO2OH(ACO)]+.
2
Table 1. Dissoication energies for IRMPD reactions of [UO2OH(ACO)]+ calculated using different
3
basis sets. 4
Reaction / binding energy (kcal/mol) B3LYP SVWN Stuttgart RSC TZVP NWChem B3LYP PW91 ZORA TZ2P (ADF)
[UO2OH(ACO)]+→ [UO2OH]+ + ACO 48.3 41.4
[UO2OH(ACO)]+→ [UO2(OC3H5)]+ + H2O 52.8 41.4
5
Isolation of the [UO2OH(ACN)]+ complex followed by photo-fragmentation produced elimination of
6
ACN. The antisymmetric UO2 stretch was measured at 972 cm-1, nearly identical to that for
7
[UO2OH(ACO)]+ and to [UO2OH]+. The hydroxide complex with ammonia [UO2OH(NH3)]+ underwent
8
photo-fragmentation solely by loss of NH3, with a 3 value at 976 cm-1, which is slightly blue shifted
9
compared to the unmodified uranyl hydroxide. The final hydroxide complex examined was 10
[UO2OH(H2O)]+, which eliminated H2O upon irradiation that maximized at 983 cm-1, which was
11
12 cm-1 higher than the [UO2OH]+ value.
The trend for the uranyl 3 frequencies for the [UO2OH(S)]+ complexes were internally
self-1
consistent, i.e., they decreased in the order H2O > NH3 > ACN ~ ACO > (ACO)2. These frequency
2
values are inversely correlated with the calculated coordination energies of different S molecules,40 and 3
are in accord with comparisons of ACO and ACN uranyl complexes.60 The observed ordering again 4
highlights the remarkably low value measured for unmodified [UO2OH]+, which would be expected to
5
be higher than 983 cm-1 (i.e., the value for the complex with the most weakly bound neutral, 6
[UO2OH(H2O)]+). Because it does not seem reasonable to expect that the addition of weakly donating
7
species actually strengthens the uranyl U=O bonds, we must seek other explanations for the blue shifted 8
bands for the NH3 and H2O complexes.
9
One likely contributing factor is vibrational anharmonicity derived from the multiple photon 10
absorption process. Red-shifts in the spectra of the para-aminobenzoic acid58 and [CeOH(ACO)3]2+
11
cations93 have been attributed to IRMPD anharmonicity, and the same phenomenon may contribute to 12
the low frequency measured for [UO2OH]+. These studies demonstrate that when molecules or
13
complexes attain very high internal energies via the IRMPD process, their vibrational bands exhibit non-14
negligible red-shifts. This can be particularly dramatic for systems with low densities of states,44 such as 15
the [UO2OH]+ complex studied here, which only has 9 vibrational modes. The energy required to
16
dissociate [UO2OH]+ to [UO2]+ and a hydroxyl radical was evaluated computationally, and both the
17
Stuttgart RSC ECP and the ADF TZ2P basis sets, which have some similarity, produced high values 18
(Table 2). However, a lower value was generated using the LANL/aug-cc-pvdz basis set, which may 19
reflect that difficulty is encountered in dealing with [UO2]+ species using the LANL/aug-cc-pvdz basis
20
set, which is fairly small, without any diffuse functions. This could conceivably create an unbalanced 21
description of uranium, leading to a low calculated dissociation energies. Therefore, we conclude that 22
the calculations in general predict high dissociation energies, which is consistent with the fact that 23
hydroxide had the highest coordination energy of any ligand in the extensive compilation calculated by 24
Marsden and coworkers.40 These considerations support the attribution of the anomalously low 25
[UO2OH]+ 3 value to anharmonicity effects. The B3LYP calculations using the Stuttgart RSC/TZVP
1
basis was also performed starting from a triplet excited state, and it was found to require 43.8 kcal mol-1. 2
This value, when added to the promotion energy (see below) yields a value of nearly 90 kcal mol-1. 3
Table 2. Dissociation energies calculated for IRMPD of [UO2OH]+.
4
Reaction / binding energy (kcal/mol) B3LYP SVWN Stuttgart RSC TZVP (NWChem) B3LYP PW91 ZORA TZ2P (ADF)
[UO2OH]+→ [UO2+] + OH
dissociation via a singlet ground state
74.5 96.0
[UO2OH]+→ [UO2+] + OH
dissociation via a triplet excited state
43.8 --
5
In contrast to the small [UO2OH]+ molecule, more complex systems containing a neutral ligand tend
6
to have reduced dissociation energies and a significantly higher vibrational density of states. For 7
example, water binds to the [UO2OH]+ complex by only 30 kcal/mol, while doubling the number of
8
vibrational modes, three of which are low-frequency intermolecular modes, that may contribute 9
disproportionately to the vibrational density of states. This may explain why the 3 frequencies of the
10
[UO2OH(S)]+ complexes are not apparently affected by anharmonicity, compared to the bare [UO2OH]+
11
which is strongly shifted by anharmonicity induced by the IRMPD process. A 3 value unshifted by
12
anharmonicity would be expected to be ~990 cm-1 for [UO2OH]+ to be consistent with the trend in the 3
13
bands of the [UO2OH(S)]+ complexes measured here.
14
Correlation corrected vibrational SCF (cc-VSCF) calculations can provide an estimate of whether or 15
not differential red-shifting would be expected in comparing [UO2OH]+ and [UO2OH(S)]+ complexes.
cc-VSCF estimates the effect of anharmonicity by including coupling between the lower vibrational 1
modes calculated in the harmonic approximation. Factoring in an influence by anharmonicity the 2
calculated 3 value for [UO2OH]+ decreased by 10 cm-1, which would account for part of the expected
3
red shift for the hydroxide based on the IRMPD data. However, the shift calculated for [UO2OH(H2O)]+
4
was very nearly the same at 8 cm-1, since there are other factors that are expected to mitigate the effects 5
of anharmonicity in the latter system, the differential anharmonic shift calculated for [UO2OH]+ and
6
[UO2OH(H2O)]+. It should be noted that the cc-VSCF calculations only consider coupling of the lowest
7
~10 vibrational levels, whereas coupling and population of the higher excitation levels would certainly 8
be expected to contribute at the high excitation energies achieved in the IRMPD experiments. 9
Participation of an electronically excited state [UO2OH]+ may also contribute to the apparently low 3
10
frequency. The energy calculated for promotion of an electron into the lowest excited triplet state 11
calculated using both B3LYP/LANL2dz-aug-cc-pVDZ and PW91/unrestricted/scalar was ~45 kcal/mol, 12
which was less than that calculated to dissociate [UO2OH]+ (except for the LANL basis set). If
13
vibrational-to-electronic transitions are occurring in the multiple photon experiments, then a lowered 14
frequency would be expected for the electronically excited molecule.94 The 3 value calculated for
15
[UO2OH]+ in its lowest excited state was quite a bit lower, at 908 cm-1, however the hydroxide profile is
16
broadened, which may be the result of overlap of absorptions of ground state and excited state 17
molecules. It should also be noted that this triplet state may be directly related to the observed 18
dissociation pathway, suggesting that the molecule can be considered to be a complex of reduced uranyl 19
[UO2]+and neutral hydroxyl radical.
20
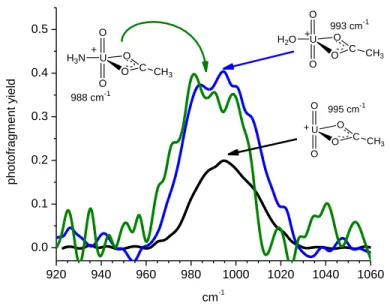
IRMPD of Uranyl-Acetate Complexes [UO2OAc]+. ESI produced a relatively abundant ion at m/z 329
21
which was attributed to uranyl acetate [UO2OAc]+, that was formed from residual acetic acid that had
22
been used to enhance the protonated ion formation from peptide and protein solutions in previous 23
experiments at FELIX. Because acetate is a stronger conjugate base, it replaces nitrate in the ion 24
accumulation chamber prior to injection into the FT-ICR-MS. The composition was confirmed by 25
accurate mass measurement and the photo-fragmentation pathway observed in the IRMPD experiment, 1
in which a neutral loss of 42 mass units (presumably as ketene) furnished [UO2OH]+ as the product ion.
2
For IRMPD of [UO2OAc]+ the maximum for the antisymmetric uranyl stretch was 995 cm-1 (Figure 2),
3
higher than any of the hydroxide complexes measured. This is consistent with the fact that acetate is a 4
weaker gas-phase base95 than either hydroxide or methoxide (vide infra), and consequently is also likely 5
to be a weaker uranophile. Despite the presumed lower basicity, the antisymmetric uranyl stretching 6
frequency for [UO2OAc]+ appeared at a lower value than nearly all of the uranyl dication complexes
7
ligated with multiple neutral donor ligands reported earlier.60 In solution, acetate complexes have been 8
the subject of several infrared studies, and the most appropriate value for the antisymmetric stretch to 9
use in a comparison is 954 cm-1, which was measured by Quiles17 for [UO2OAc]+. This value is
10
significantly lower than the IRMPD measurement, which reflects the attachment of additional solvent 11
ligands to the [UO2OAc]+ metal center. Other studies have produced values that ranged as low as 919
12
cm-1,18,23 but these measurements probably contain contributions from species that contain more than 13
one acetate ligand, and the possibility of variable acetate coordination.17 Recently, LDA was used by de 14
Jong and coworkers to calculate uranyl 3 value for [UO2OAc]+ at 1025 cm-1.96 A careful examination
15
of the carbonyl stretching frequencies could provide insight into this, and will be investigated in further 16
experimental campaigns. 17
Also observed in the ESI spectrum were low abundance ions at m/z 346 and 347 that corresponded to 18
ammonia and water complexes (respectively), having compositions [UO2OAc(NH3)]+ and
19
[UO2OAc(H2O)]+. Photo-fragmentation of these complexes involved elimination of either NH3 or H2O,
20
producing [UO2OAc]+ in each case. Consistent with prior studies of donors, the antisymmetric UO2
21
stretching frequency was red-shifted for both H2O and NH3 complexes relative to [UO2OAc]+, although
22
the magnitude of the shifts were small: the value for the H2O complex at 993 cm-1 was lower by 2 cm-1,
23
while a shift 7 cm-1 to 988 cm-1 was observed for the NH3 complex. The trend in the measured
24
frequencies indicate that both H2O and NH3 are donating electron density, and that NH3 is a stronger
uranophile than is H2O, consistent with Marsden’s prior DFT results,40 the relative order of proton
1
affinities,95 and bonding to other metal cations.97 The fact that the frequency of the unmodified acetate is 2
very close to that of both ligand complexes suggests that the frequency for the [UO2OAc]+ complex may
3
also be red-shifted as a result of anharmonicity or perhaps other factors. However the effect is less 4
pronounced than in the case of the hydroxide complex, as indicated by the fact that the 3 of the
5
unmodified [UO2OAc]+ complex is not lower than the values of the H2O and NH3 adducts. Compared to
6
the hydroxide complex, a smaller anharmonic red shift for OAc is consistent with a higher density of 7
states,44 and with a lower energy requirement for fragmentation of the acetate complex, which involves 8
rearrangement rather than direct bond-cleavage and elimination of a radical. 9 920 940 960 980 1000 1020 1040 1060 0.0 0.1 0.2 0.3 0.4 0.5 p h o to fra g me n t yi e ld cm-1 U O O O C CH3 O 995 cm-1 + U O O O C CH 3 O H2O 993 cm-1 + U O O O C CH3 O H3N 988 cm-1 + 10
Figure 2. Infrared multiple photon dissociation spectra of the antisymmetric O=U=O stretching region
11
for [UO2OAc]+ and ligand complexes containing a single NH3 and H2O.
12
IRMPD of Uranyl-Methoxide Complexes [UO2OCH3]+. The accurate mass measurement of the ion at
13
m/z 301 confirmed the composition of uranyl methoxide, which was formed by reaction of uranyl 14
species with methanol that was present in the ESI solution. Photo-fragmentation of [UO2OCH3]+
15
produced four different product ions corresponding to the elimination of the OCH3 and H radicals, H2,
16
and H2CO (Scheme 2).
[UO2OCH3]+ [UO2]+ + OCH3 m/z 270 [UO2OCH2]+ + H m/z 300 [UO2OCH] + + H2 m/z 299 [UO2H]+ + OCH2 m/z 271 1
Scheme 2: Photo-fragmentation of [UO2OCH3]+ produced four different product ions corresponding to
2
the elimination of the OCH3 and H radicals, H2, and H2CO.
3
The IRMPD spectrum of the methoxide complex contained two bands, with maxima at 975 cm-1 and 4
887 cm-1 (Figure 3, black trace). DFT calculations (B3LYP/SDD-3-21G*) indicated that the higher 5
frequency corresponded to overlapped antisymmetric uranyl 3 and C-O stretching bands, and the lower
6
frequency to the symmetric uranyl 1 band normally observed in the Raman spectrum.7,12,15,22,29 The
7
appearance of the symmetric stretch indicates a lowered symmetry in the complex, resulting from strong 8
binding of the methoxide that perturbs the linearity of the uranyl functional group. This was supported 9
by the lowest energy structures and bond angles produced by B3LYP calculations (vide infra). 10
Striking differences were observed when the IR spectra produced using the different photo-11
dissociation channels were compared. The spectrum generated by monitoring the loss of the OCH3
12
radical contained a single sharply defined peak with a maximum at 967 cm-1, a frequency slightly lower 13
than that measured for the uranyl antisymmetric stretch for the unmodified hydroxide complex, and 14
consistent with the fact that methoxide is a stronger base than is hydroxide. The peak centered at 967 15
cm-1 was not observed in the spectra generated by the other three fragmentation channels, either because 16
it is not occurring in these channels, or because it was overlapped with the O-C stretch (see below). If 17
the latter is true, then it suggests that the 3 frequency in the spectrum of the OCH3 loss channel is red
18
shifted by about 20 cm-1 due to the higher energetic requirements for that channel; shifts of this 19
magnitude have been observed previously.58 20
850 900 950 1000 1050 0.00 0.02 0.04 0.06 0.08 0.10 0.12 0.14 0.16 0.18 0.20 0.22 summed photo-fragment profile 975 cm-1 887 cm-1 summed H loss/ rearrangement 987 cm-1 loss of H2 loss of H2CO loss of H loss of OMe 967 cm-1 p h o to fra g me n t yi e ld cm-1 1
Figure 3. Infrared multiple photon dissociation spectra of the symmetric and antisymmetric O=U=O 3
2
stretching region for [UO2OCH3]+. The black trace represents the spectrum generated by the summed
3
photofragment abundance; red the OCH3 radical elimination, violet the H radical elimination; blue the
4
H2 elimination; green the H2CO elimination, and orange the sum of the H loss/rearrangement related
5
channels. 6
The IR spectra generated from the photo-dissociation channels corresponding to either the loss of H or 7
H2 bore strong similarities to one another in that they contained a peak with a maximum at 987 cm-1 and
8
second peak at about 887 cm-1. The higher frequency peak probably contains components from 9
unresolved uranyl asymmetric stretch and C-O stretching, while the lower frequency peak corresponds 10
to the symmetric UO2 stretch. The IR spectrum generated by the H2CO elimination was similar to the
H-11
loss spectra, but lacked the band for the symmetric stretch. The appearance of very dissimilar IR spectra 12
in the different photo-dissociation channels was remarkable, because IRMPD spectra generated from 13
competing mass channels are normally identical or are very similar, with the fragmentation channels 14
having the higher energetic requirements being modestly red-shifted as a result of anharmonicity that 15
results from population of higher vibrational levels when multiple photons are serially absorbed.58,93 16
Fast intramolecular vibrational redistribution randomizes the deposited energy regardless of the 17
frequency of initial deposition, and thus the competing fragmentation channels display similar if not 1
identical IR spectra.56 2
A hypothetical interpretation of these observations is that the order of reaction endothermicities for the 3
four reactions is -H2 ~ -H < -OCH2 < -OCH3. In the spectra generated by losses of H and H2 peaks are
4
seen in all three absorption modes, symmetric uranyl, asymmetric uranyl and C-O (assuming that the 5
asymmetric uranyl and C-O are overlapping). The symmetric uranyl and C-O are weakly absorbing 6
modes and hence are only seen in those eliminations having low energy requirements. The spectrum 7
generated by loss of OCH2 contains the asymmetric uranyl and perhaps the C-O, but energetic
8
requirement for this channel is too high to enable observation of the symmetric uranyl stretch. The 9
higher energetic requirements are probably related to the fact that the [UO2H]+ product ion has to be
10
reduced, forming either a U(IV) species or a uranyl hydride. Finally, the spectrum generated by loss of 11
OCH3 contains only the antisymmetric uranyl peak, because the energetics for this reaction are higher,
12
which means that it can only be accessed via the high intensity 3 uranyl absorption. This peak is
13
substantially red-shifted as a consequence of the large number of photons that must be deposited in 14
order for the reaction to occur. Further, the fast kinetics of the OCH3 radical loss reduces observation of
15
the slower, lower energy losses. 16
Enthalpy changes for the calculated for the different fragmentation channels display modest agreement 17
with this hypothesis. B3LYP calculations using different parameterization and basis sets (Table 3) 18
showed that elimination of H2 was the lowest, followed by loss of H radical. Enthalpy requirements for
19
the loss of H2CO and reductive elimination of the methoxy radical were higher, and the order of these
20
two varied depending on the basis sets employed. The B3LYP calculations identified two possible 21
outcomes for the elimination of H2CO: formation of a U(IV) oxyhydroxide [UOOH]+, and a U(VI)
22
uranyl hydride [UO2H]+, with the U(IV) species appearing to be somewhat disfavored energetically.
23
However the significant energetic variations seen in comparisons of the different approaches do not 24
allow us to state the energetic order of the elimination reactions, and thus computational support is 25
somewhat equivocal for the hypothetical explanation for the differences seen in the spectra from the four 1
elimination channels. 2
Table 3. Calculated enthalpies for the dissociation reactions of [UO2OCH3]+ (Scheme 2). Values are in
3
kcal mol-1. 4
Reaction \ binding energy (kcal/mol) ?????? SVWN DNP DNP (DMOL) B3LYP B3LYP SDD SDD (Gaussian) B3LYP SVWN Stuttgart RSC TZVP (NWChem) B3LYP PW91 ZORA TZ2P (ADF)*
[UO2OCH3]+ → H2 + [UO2(OCH)]+ 52.8 52.7 52.3
[UO2OCH3]+ → H + [UO2(OCH2)]+ 67.3 73.7 78.3
[UO2OCH3]+ → OCH3 + [UO2]+ 68.4 69.8 100.1
[UO2OCH3]+ → OCH2 + [UO2(H)]+
(H equatorial)
59.0 80.7 --
[UO2-OCH3]+ → OCH2 + [UOOH]+
(H linear) 79.9 85.2 85.6
* ZORA numbers include spin-orbit interaction. 5
An alternative explanation would be the existence of two or more isomers of [UO2OCH3]+, however
6
DFT calculations did not support the existence of energetically competitive isomers, although 7
rearrangement may be occurring during the IRMPD process. An alternative structure that was 8
considered contained an H atom bound to uranium, with formaldehyde equatorially coordinated: for 9
such a structure an absoption corresponding to carbonyl group should be observed, but a survey of the 10
1500–1700 cm-1 wavelength region did not show an additional peak. Thus a structure involving a bound 11
formaldehyde ligand is unlikely, as our prior studies60,93 showed that the C=O stretch can be readily 12
detected in complexes with carbonyl-containing ligands. 13
Involvement of an excited state for the uranyl methoxide can also be argued, which would be expected 14
to have energetic requirements similar to the 45 kcal/mol required for the hydroxide complex. 15
Intuitively, this is an attractive explanation because a higher spin species would be expected to have a 16
higher propensity for rearrangement and elimination of H and OCH3 radicals. When the energetic
requirement for conversion to a triplet excited state was calculated, it was found to be 45 kcal mol-1, in a 1
range that would be accessible during the IRMPD photofragmentation. However, as in the two 2
previously offered rationalizations, this too remains speculative at the present time, and hence an 3
unequivocal identification of the origin of the differences in the spectra of the different mass channels is 4
still elusive. 5
The assignment of the higher frequency to a C-O stretch drew support from the spectra acquired for 6
the [UO2OCH3(H2O)]+ and [UO2OCH3(NH3)]+ adducts (Figure 4). The three peaks in the spectra of
7
these complexes had frequencies consistent with the spectra of unmodified [UO2OCH3]+. In the adduct
8
ions, photo-fragmentation of the methoxide ligand did not occur; instead, only the energetically favored 9
losses of H2O or NH3 were observed.
10 800 850 900 950 1000 1050 1100 0.00 0.05 0.10 0.15 0.20 p h o to fra g me n t yi e ld cm-1 U O O OCH3 + 975 cm-1 U O O OCH3 H2O + 970 cm-1 U O O OCH3 H3N 966 cm-1 + 11
Figure 4. Infrared multiple photon dissociation spectra of the antisymmetric O=U=O stretching region
12
for [UO2OCH3]+ (black trace, sum of all photo-fragment channels), [UO2OCH3(H2O)]+ (blue trace,
13
scaled by 0.55) and [UO2OCH3(NH3)]+ (green trace scaled by 0.6). The photofragment yield for the H2O
14
and NH3 complexes was higher than for the unmodified methoxide complex, and scaling was performed
15
to facilitate comparison. 16
The frequencies measured for the antisymmetric UO2 stretch for the H2O and NH3 complexes were
1
modestly red-shifted compared to the maximum value for the summed photo-fragment channels of the 2
unmodified [UO2OCH3]+, and the trend observed is consistent with what would be expected for addition
3
of a second weak donor ligand (H2O), and then substitution of a slightly more basic ligand NH3 for H2O.
4
Similarly, the frequencies measured for the symmetric stretch were very similar for all three complexes: 5
the 1 value for the unmodified [UO2OCH3]+ was measured at 887 cm-1, and the peak position is only
6
very modestly shifted to 880 cm-1 when H2O is attached, and to 879 cm-1 for NH3. These values are
7
about 20 cm-1 higher than that measured for solvated [UO2OAc]+ using Raman spectroscopy.12 As in the
8
case of the hydroxide complexes, the uranyl stretching frequencies of the methoxide complexes were not 9
significantly red shifted by addition of a neutral donor ligand. This suggests that in the unmodified 10
methoxide complex [UO2OCH3]+, the uranyl frequency may be shifted to a lower value as a result of
11
anharmonicity, in a fashion similar to that suspected to be occurring in the hydroxide complexes. As 12
noted, this would be facilitated by high energetic requirements for the elimination reaction in the 13
unmodified [UO2OCH3]+ which was indicated by calculations, and was comparable to the value
14
calculated for the hydroxide. The high value is consistent with the idea that elimination of the OCH3
15
radical would be most susceptible to red-shifting resulting from absorption of multiple photons during 16
the IRMPD process. 17
While addition of a second donor ligand does not cause large changes in the uranyl stretching 18
frequencies,43,96 it appears to strengthen the C-O bond in the methoxide ligand. This would be expected 19
if the methoxide were modestly repelled by attachment of H2O or NH3 to the uranium center. In the
20
spectra for both [UO2OCH3(H2O)]+ and [UO2OCH3(NH3)]+, the C-O stretch was observed at ca. 1038
21
and 1040 cm-1, shifted to higher frequency by ~ 50 cm-1 compared to unmodified [UO2OCH3]+. This
22
trend is directly analogous to what was observed in the IR spectra of discrete uranyl acetone dication 23
complexes: when an additional donor ligand was added, the binding of all equatorial ligands was 24
weakened, and the C=O stretching frequency increased, approaching that of free acetone;60 in the 25
present case, it is the C-O stretch of methoxide that is increased. Calculations also suggested loosening 1
of the U-OCH3 bond upon ligation with a neutral donor.
2
Comparisons of Calculated Frequencies 3
The changes in vibrational frequencies can be understood in part by comparison with frequencies, 4
bond lengths and angles calculated using density functional theory. Because calculations of complexes 5
containing actinide elements are challenging, different combinations of functionals and basis sets were 6
used. These results provided multiple opportunities for comparison with measurements, in particular 7
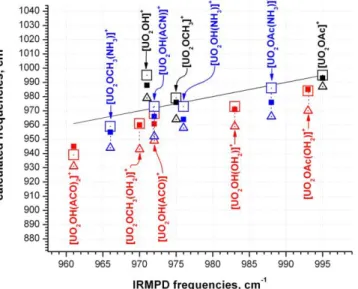
using the antisymmetric uranyl stretch, which was the salient figure of merit in this study. A comparison 8
of the unscaled uranyl frequencies calculated using B3LYP with different basis sets versus the IRMPD 9
measurements (Figure 5, Table 4) showed that more accurate values were obtained using the SDD basis 10
set for all elements. Calculated values using 3-21g* and 6-31+g(d) for C, H, N and O were 20 – 30 cm-1 11
higher than measurements for the solvent complexes, depending on the donor. Values calculated using 12
6-31+g(d) were slightly better than those generated using 3-21g*, but differences between the two 13
calculations were small. The data in Figure 5 may be grouped into three categories: anion complexes 14
with no donor, an O-donor (H2O or acetone), or an N-donor (NH3 or acetonitrile). Calculations for the
15
O-donor anion complexes were in best agreement with experiments, being within a few cm-1 for the all-16
SDD basis sets, and on the order of 20 cm-1 high for the SDD/3-21g* and SDD/6-31+g(d) basis sets. 17
Calculations for the complexes containing a neutral that coordinates via a N atom were slightly less 18
accurate, with differences ranging from 5 – 10 cm-1 for the all-SDD calculation to ~ 30 cm-1 using the 19
gen basis sets. This suggests that N-donation is slightly more aggressive in the gas phase experiment 20
than predicted by theory. Calculations for the [UO2(anion)]+ complexes containing no neutral donor
21
displayed the poorest agreement with experiment, being 20 to nearly 60 cm-1 higher than the 22
measurements, depending on the basis set used. The poorer agreement likely reflects the high energetic 23
requirements for photo-fragmentation pathways for these complexes, which is reasonable since they 24
involve elimination of an oxy radical with concomittant reduction of the uranium center. The need to 25
vibrationally excite the uranyl-anion complexes to a higher level increases the opportunity for the 1
measured 3 value to be shifted lower as a result of vibrational anharmonicity, or perhaps by
2
participation of an excited state, as suggested above. 3
4
Figure 5. Uranyl 3 frequencies calculated using B3LYP plotted versus IRMPD measurements. The line
5
represents the experimental data. Filled square data points were generated using the SDD basis set for all 6
elements, values unscaled. Values represented by open squares were generated using SDD for uranium 7
and 3-21g* for C, H, N and O, while values represented by open triangles utilized 6-31g(d) for C, H, N 8
and O. Black points represent [UO2(anion)]+ complexes with no neutral donor, red represent those with
9
O-donating neutrals, and blue represent those with N-donating neutrals. 10
Table 4a. Uranyl antisymmetric stretching frequencies (3) for complexes [UO2AS0,1,2]+. IRMPD values
1
were generated experimentally, and calculated using the B3LYP functional with various basis sets. All 2
values reported are unscaled. 3 A (anion) S (neutral solvent) IRMPD measure- ments B3LYP/ SDD/ 3-21g* B3LYP/ Stuttgart RSC/RLC (SDD) B3LYP/ Stuttgart RSC/RLC (SDD)/ 6-31+g(d) B3LYP/ Stuttgart RSC/RLC/ TZVP B3LYP/ LANL2dz/ aug-cc-pvdz OH - 971 1027 1009 1025 1035 988 OH H2O 983 1003 986 1003 1015 971 OH NH3 976 1002 984 999 1011 964 OH ACN 972 1003 982 999 -- 966 OH ACO 972 996 977 998 -- 961 OH 2 ACO 961 981 957 980 -- 945 OAc - 995 1037 1025 1032 -- 993 OAc H2O 993 1017 1002 1015 -- 985 OAc NH3 988 1018 1002 1013 -- 976 OCH3 - 975 1017 997 1011 1018 976 OCH3 H2O 970 990 975 990 994 961 OCH3 NH3 966 995 973 987 994 959 4 5
Table 4b. Uranyl antisymmetric stretching frequencies (3) for complexes [UO2AS0,1,2]+. IRMPD values
1
were generated experimentally, and calculated using LDA and PW91 functionals with various basis sets. 2
All values reported are unscaled. 3 A (anion) S (neutral solvent) IRMPD measure- ments LDA/ SVWN/ DNP LDA/ LANL/ aug-cc-pvdz LDA/ Stuttgart RSC / TZVP PW91/ LANL / aug-cc-pvdz PW91/ Stuttgart RSC / TZVP ZORA/ PW91/ TZ2P OH - 971 995 958 1017 928 987 979 OH H2O 983 973 939 1001 910 969 959 OH NH3 976 973 937 990 910 962 958 OH ACN 972 973 -- -- -- -- 952 OH ACO 972 968 -- -- -- -- 949 OH 2 ACO 961 939 -- -- -- -- 931 OAc - 995 995 -- -- -- -- 987 OAc H2O 993 984 -- -- -- -- 970 OAc NH3 988 986 -- -- -- -- 966 OCH3 - 975 979 949 1003 920 973 964 OCH3 H2O 970 961 933 997 904 954 943 OCH3 NH3 966 959 932 980 905 950 944 4
In contrast, calculations using LDA, PW91, and B3LYP/LANL2dz/aug-cc-pVDZ produced unscaled 5
uranyl 3 frequencies that were slightly lower than measurements (Figure 6). . The LDA (calculated
6
using DMol3) values (Figure 6, open squares) for the [UO2A]+ complexes and those with a N-donating
7
neutral were in good agreement with measurement, with the salient exception of [UO2OH]+. Compared
8
to experiments, the LDA values for anion complexes with O-donating ligands were systematically lower 9
than values for complexes with N-donors, by about 10 cm-1. The value calculated for the 1
[UO2OH(ACO)2]+ was ca. 20 cm-1 lower than the measured value.
2
3
Figure 6. Unscaled uranyl 3 frequencies calculated using B3LYP/LANL2dz/aug-cc-pVDZ, LDA/VWN
4
and ZORA/PW91/TZ2P, plotted versus IRMPD measurements. The line represents the experimental data. 5
The open squares were generated using LDA/VWN, the filled squares B3LYP/LANL2dz/aug-cc-pVDZ, 6
and the triangles ZORA/PW91/TZ2P. The black points represent [UO2A]+ complexes with no neutral
7
donor, red correspond to complexes with O-coordinating neutrals, and blue to those with N-coordinating 8
neutrals. 9
The values calculated using B3LYP in Figure 6 (filled squares) differed from those in Figure 5 in that 10
they were generated using the LANL2dz/aug-cc-pVDZ basis sets. Values calculated for the uranyl 11
methoxide and acetate complexes without neutrals agreed well with the measured values; the hydroxide 12
species was on the order of 18 cm-1 higher. The [UO2AS]+ complexes were all on the order of 7–15 cm-1
13
lower than the measurements, and there was no apparent systematic difference between the complexes 14
containing O-donors and those with N-donors, which indicated that B3LYP/LANL2dz/aug-cc-pVDZ
15
predicted shifts resulting from both types of ligands consistently. 16
The frequencies were also computed with ZORA/PW91/TZ2P. The results are consistently lower than 1
the pseudopotential LDA/VWN or B3LYP/LANL2dz/aug-cc-pVDZ values, a feature that was also observed 2
in our earlier work on the neutral donor ligands.60 The ligand induced shifts are very similar to the 3
results obtained with the other approaches, however, and systematic differences between O- and N-4
donors were not calculated. 5
Additional insight into the potential interactions from anion binding can be gained by examining the 6
changes in the calculated bond lengths and angles, which would also check the internal consistency of 7
the predicted stretching frequencies. We selected the calculations performed using B3LYP/SDD/6-8
31+g** for discussing relationships between calculated bond lengths and frequencies, which are listed in 9
Table 3, and trends in bond lengths with varying ligation are depicted graphically in Figure 7 (detailed 10
structural parameters generated using B3LYP with three different basis sets are contained in 11
Supplementary Tables S1 – S12, and visual representations are provided in Figures 7 - 9). As ligands 12
are added, calculations show that all distances within the uranyl coordination sphere increase. The 13
magnitude of the increase depends not only on the nucleophilic strength of the different ligands but also 14
on their volumes, and the calculations provide a means to develop a more quantitative assessment of the 15
effect of ligand addition to uranyl. The O=U=O bond length is represented by the lower three traces, 16
and the effect of the anion A, and subsequent addition of a neutral solvent S is very similar for the 17
acetate, the hydroxy and the methoxide complexes. The uranyl bond elongates by 0.042 Å, 0.044, and 18
0.048 Å for OAc-, OH- and OCH3-, respectively. This is also the order of increasing anion basicity,
19
resulting in donation of more electron density to the uranium atom, and attendant repulsion of the axial 20
oxygen atoms. The amount of donation was quantified by performing charge analysis calculations with 21
ZORA/PW91/TZ2P. The Hirshfeld method shows donation to uranyl of 0.56e (OAc), 0.53e (OH), and 22
0.65e (OCH3) while the VDD method gives very similar values of 0.53, 052 and 0.63e, respectively.
23
1
Figure 7. Lowest energy conformations of calculated for [UO2OH]+ and its solvated complexes.
2
Calculations were performed using hybrid B3LYP functional with the SDD basis set on U and 3-21g* 3
on C, H, N and O. 4
1
Figure 8. Lowest energy conformations of [UO2OAc]+, [UO2OMe]+ and their solvent complexes with
2
water and ammonia. Calculations were performed using hybrid B3LYP functional with the SDD basis 3
set on U and 3-21g* on C, H, N and O. 4
Table 3. Bond lengths (Angstroms) and O=U=O bond angles for [UO2AS]+ complexes, calculated using
1
Gaussian 03, at the B3LYP level of theory. The MWB60 (SDD) basis set was used for U, and 3-21g* 2
for C, H, N and O. 3
A (anion) S (neutral
solvent) U=O length, Å U-anion length, Å U-neutral length, Å O=U=O angle [UO2]2+,
unligated n/a 1.7002 n/a n/a 179.578
OAc n/a 1.7444 2.2687 n/a 170.346
OAc H2O 1.7735 2.2968 2.4616 171.024 OAc NH3 1.7540 2.3015 2.5566 171.716 OH n/a 1.7450 2.0104 n/a 167.409 OH H2O 1.7546 2.0277 2.4416 167.606 OH NH3 1.7581 2.0332 2.5437 167.245 OH ACN 1.7571 2.0318 2.4771 166.983 OH ACO 1.7592 2.0052 2.3252 169.898 OH (ACO)2 1.7682 2.0828 2.3931 172.640
OCH3 n/a 1.7510 1.9986 n/a 167.237
OCH3 H2O 1.7618 2.0167 2.4514 167.559
OCH3 NH3 1.7633 2.0211 2.5561 167.187

![Table 1. Dissoication energies for IRMPD reactions of [UO 2 OH(ACO)] + calculated using different 3](https://thumb-eu.123doks.com/thumbv2/123doknet/12982556.378439/15.918.159.753.58.304/table-dissoication-energies-irmpd-reactions-calculated-using-different.webp)
![Table 2. Dissociation energies calculated for IRMPD of [UO 2 OH] + . 4](https://thumb-eu.123doks.com/thumbv2/123doknet/12982556.378439/17.918.66.710.219.574/table-dissociation-energies-calculated-irmpd-uo-oh.webp)


![Table 4a. Uranyl antisymmetric stretching frequencies ( 3 ) for complexes [UO 2 AS 0,1,2 ] +](https://thumb-eu.123doks.com/thumbv2/123doknet/12982556.378439/29.918.70.810.198.814/table-a-uranyl-antisymmetric-stretching-frequencies-complexes-uo.webp)
![Table 4b. Uranyl antisymmetric stretching frequencies ( 3 ) for complexes [UO 2 AS 0,1,2 ] +](https://thumb-eu.123doks.com/thumbv2/123doknet/12982556.378439/30.918.72.894.179.783/table-b-uranyl-antisymmetric-stretching-frequencies-complexes-uo.webp)