HAL Id: in2p3-00146993
http://hal.in2p3.fr/in2p3-00146993
Submitted on 15 May 2007HAL is a multi-disciplinary open access archive for the deposit and dissemination of sci-entific research documents, whether they are pub-lished or not. The documents may come from teaching and research institutions in France or abroad, or from public or private research centers.
L’archive ouverte pluridisciplinaire HAL, est destinée au dépôt et à la diffusion de documents scientifiques de niveau recherche, publiés ou non, émanant des établissements d’enseignement et de recherche français ou étrangers, des laboratoires publics ou privés.
Half-life of the first excited state of 201 Hg
V. Meot, J. Aupiais, P. Morel, G. Gosselin, F. Gobet, J.-N. Scheurer, M.
Tarisien
To cite this version:
V. Meot, J. Aupiais, P. Morel, G. Gosselin, F. Gobet, et al.. Half-life of the first excited state of 201 Hg. Physical Review C, American Physical Society, 2007, 75, pp.064306. �10.1103/PhysRevC.75.064306�. �in2p3-00146993�
Half-life of the first excited state of
201Hg
V. Méota,*, J. Aupiaisb, P.Morela, G. Gosselin a, F.Gobetc, J.N. Scheurerc , M.Tarisienc
a
CEA/DIF/DPTA Service de Physique Nucléaire, BP 12, 91680 Bruyères-le-Châtel, France
b
CEA/DIF/DASE Service de Radioanalyse, Chimie et Environnement, BP 12, 91680 Bruyères-le-Châtel, France
c
Université Bordeaux 1; CNRS/IN2P3
Centre d’Etudes Nucléaires de Bordeaux Gradignan, UMR 5797 Chemin du Solarium, BP120, 33175 Gradignan cedex
(Received)
The lifetime of the first excited state of 201Hg, populated by the 201Tl electron capture decay and subsequent γγγγ-ray transitions, has been measured for the first time. This measurement has been carried out using a coincidence between an internal conversion electron and a γγγγ-ray. The half-life of 81±±±±5 ns has been obtained and B(E2) and B(M1) values were deduced and compared to previous estimates. With these reduced matrix elements, the excitation rate of the first excited state of 201Hg in plasma have been calculated in the frame of a NEET process.
PACS: 21.10.Tg, 23.20.Nx, 29.25.Rm The excitation of a nuclear level in plasma has raised significant interest in the scientific community [1-5] with the advent of high intensity laser sources. A method to characterize the phenomenon requires a stable isotope with an isomeric nuclear state at a very low excitation energy, close to the plasma temperature. Some unsuccessful or ambiguous experiments have already been attempted to observe the excitation of the first excited state of 235U and 181Ta in plasma [6-10]. Several authors [11-13] proposed to excite, in a laser heated plasma, the first excited state of 201Hg lying at 1564.8±1.0 eV. The existence of this level was first established by Dragoun et al. [14] through the observation of the conversion electron spectrum following its decay. Later, Gerasimov et al. [15,16] confirmed this result by observing the lines associated with the outer Osubshells. They obtained a value of
δ
2 = (2.10±0.55)10-4 for the multipole E2/M1 mixing ratio. Hahn et al. [17], have carried out the measurement of the B(E2) using muonic x-ray transitions. They reported two values, B(E2↑;3/2 -→1/2-)=0.104±0.024 e2b2 and B(E2↑;3/2-→1/2-)=0.145±0.022 e2b2 determined from a M-transition or a K and L-transition x-rays respectively. However due to the lack of information on the nuclear spectroscopy of 201Hg, their analysis was hampered and no conclusion was drawn. Using the weighted average of both values, B(E2↑;3/2-→1/2-)=0.127± 0.017 e2b2, the half-life of the level has been approximately estimated at 60 ns [18]. The design of a plasma experiment requires the precise knowledge of the lifetime for both calculation of the excitation rate and experimental signature of the process. Here, we report the first measurement of the half-life of the 1.565 keV level. The measured half-life and a calculated internal conversion coefficient will enable us to extract the reduced transition rates. Using those with the model described in [5], we calculated the Nuclear Excitation by Electronic Transition (NEET) rate of the 1.565 keV level in plasma at Local Thermodynamic Equilibrium (LTE).In the present experiment, the 1.565 keV 201Hg level is populated by the electron-capture decay of 201Tl (72.912-hours half-life).The 201Hg levels reached by this decay are shown in Fig.1 [18-19]. The 1.565 keV level is fed either directly (43% per 201Tl decay) or from the 167.4 keV and 32.2 keV level decays, filled in 43.6% and 13.3% per 201Tl decay, respectively. The measurement consists of performing a delayed coincidence between an electron coming from the internal conversion of the 1.565 keV level and a γ-ray emitted from a transition feeding this level.
2
FIG.1. Detailed decay scheme of 201Tl [18, 19]. The γ-ray intensities, listed after the γ-ray energies, are specified per 100 decays of 201Tl.
The 201Tl source is supplied as thallium chloride in isotonic solution by CIS Bio International (Gif-sur-Yvette, France) with an initial activity of 140 MBq. The production of the source is performed bythe reaction 203Tl (p,3n)201Pb followed by the 201Pb decays ( 9.4 hours half-life) to 201Tl.
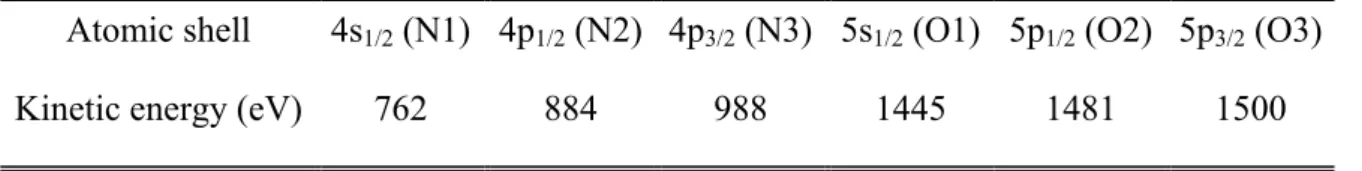
The kinetic energies of the 1.565 keV conversion electrons are gathered in TAB I [20]. Their inelastic mean free paths in matter are shorter than 10 Å which implies making a very thin source. For that purpose, a platinum disk (∅=20 mm, 25 µm thick) is prepared for electroplating by cleaning it successively with acetone, alcohol and water. The 1 ml isotonic solution of 201Tl is diluted in a 20 ml 5M NH4Cl solution. Then the solution is electroplated on the platinum disk by fixing the current
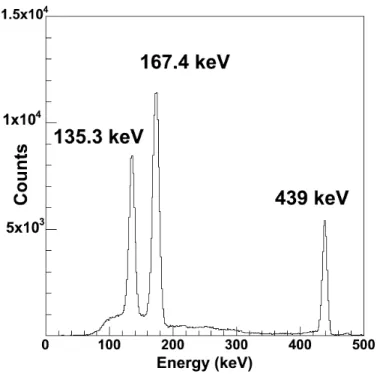
at about 0.5 A for 30 minutes. Just before the end, a few drops of concentrated ammoniac solution are added to the cell to prevent a possible dissolution of the electroplated mercury and thallium. The cell is emptied and voltage is switched off after all the solution has been removed. The platinum disk is finally washed in water and alcohol, successively. The electroplating technique gives a uniform layer thickness. As the weight of the deposit is less than 20 ng, the thickness may be estimated to a few Ångström. The amount of 201Tl on substrate was determined from its activity, 10 MBq just after the electro deposition, measured by γ spectroscopy. Figure 2 shows the γ-ray spectrum of the 201Tl deposit obtained with a high purity germanium detector. The decay of 201Tl to 201Hg is identified by the 135.3 keV and 167.4 keV 201Hg γ-ray lines. The 439 keV γ-ray line originates from the 202Tl
decay contaminant (12.23 days half-life). At lower energy, the background 238.5 keV γ-ray line disappears under coincidence conditions. Below 80 keV, the mercury x-rays are seen.
TABLE I. Conversion electron energies following the decay of 1.565 keV level obtained from [20]. Atomic shell 4s1/2 (N1) 4p1/2 (N2) 4p3/2 (N3) 5s1/2 (O1) 5p1/2 (O2) 5p3/2 (O3)
Kinetic energy (eV) 762 884 988 1445 1481 1500
FIG. 2. A γ-ray spectrum of the 201Tl deposit obtained with a high purity germanium detector. The electrons were detected with a channel electron multiplier (channeltron X951BL PHOTONIS) operating in saturated mode. The 201Tl source was positioned inside a stainless steel vacuum chamber 10 mm in front of the channeltron. A dry primary vacuum pump associated with a cryogenic pump allowed operating in a 10-7 mbar vacuum while preventing oil deposition on the sample. The deposit sample was biased by a positive voltage while the head of the channeltron is kept at ground potential. By varying this voltage, we were able to select electrons with a kinetic energy greater than the electric potential and, thus to suppress the numerous low energy electrons (Auger, backscattered electrons…)
For the lifetime measurement, the γ-rays were detected by a 1”×1” LaBr3:Ce crystal scintillator
(BrilLanCe® 380) coupled to a XP2060B phototube. The fast decay time and the energy resolution of the LaBr3:Ce crystal are very attractive for this application. The crystal was positioned outside the
vacuum chamber at 1cm from the source. At this position the aluminium window chamber is 1 mm thick. The crystal was protected from the intense x-ray emission by a 0.4 mm sheet of cadmium. The detection efficiency was determined using a 152Eu source set at the source position. Figure 3 shows the γ-ray spectrum in coincidence with electrons for a +600 V applied potential.
4
FIG. 3. A γ-ray spectrum of the 201Tl deposit obtained with a LaBr3:Ce crystal in coincidence with
the channeltron detector.
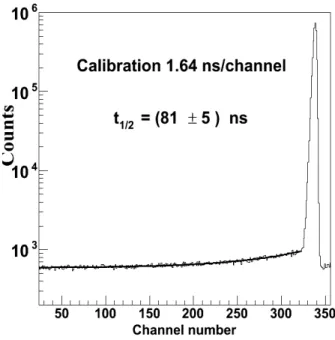
The measurement consists of performing an event by event γ - e- correlation using a 600 ns coincidence window. A time-to-amplitude converter (TAC) was started by a signal from a coincidence between both detectors, and stopped by the delayed signal from the scintillation detector. The TAC spectrum is shown Fig. 4. The prompt peak is produced by the huge number of conversion and Auger electrons emitted by the source in coincidence with γ-rays. The asymmetry of the prompt peak is due, for a large part, to the differing times of flight of the various Auger electrons. For kinetic energies associated to the 1.565 keV internal conversion electrons [Table I] we calculated the time of flight distribution for a +600 V applied potential. The slightly asymmetric distribution is centred on 1 ns with a root mean square of 0.3 ns. Hence, concerning the 1.565 keV conversion electrons, the influence of the time of flight on the TAC spectrum is negligible.
The delayed component observed Fig. 4 was fitted by an exponential function plus a constant background. The half-life was extracted to be t1/2 = (81 ±5) ns for the best reduced χ2 value of 1.021.
FIG. 4. TAC spectrum for γ-rays in coincidence with electrons. The applied voltage on the source deposit is +600 V.
Figure 5 shows the TAC spectra gated by γ-rays of 135.3 keV, 167.4 keV and 439 keV energies for a +600 V applied potential. A delayed component is clearly measured for electrons in coincidence with the 135.3 keV and 167.4 keV γ-ray lines whereas the background intensity has a flat time distribution for the 439 keV γ-ray energy coming from the decay of 202Tl. The observed half-lives are (82.0 ± 2.1) ns for a reduced χ2 value of 1.11 and (72 ± 13) ns for a reduced χ2 value of 0.81, for the 135.3 keV and 167.4 keV respectively. The amplitude of the delayed signal is (10.3 ± 3.8) times smaller for the 167.4 keV γ-ray than for the 135.3 keV one. The first one comes from the unresolved 165.9 keV γ-ray. The 1.565 keV level is fed by the 135.3 keV radiative transition followed by the 30.6 keV transition at a 52% relative intensity when the internal conversion process is involved. Taking into account the 1.565 keV state feeding intensities by the 165.9 keV and 135.3 keV, respectively 0.00155 and 0.0134 per 201Tl decay, and the detection efficiency, the expected ratio is 9.2 compatible with our experimental ratio.
6
FIG. 5. TAC spectra gated on the 135.3 keV, 167.4 keV and 439 keV γ-rays energies. The applied voltage on the source deposit is +600 V.
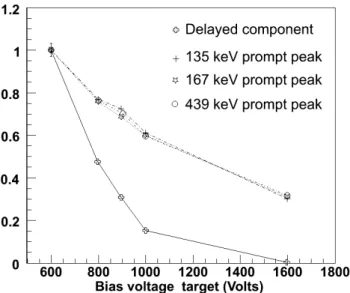
In order to check that the delayed signal comes from the level located at 1.565 keV, the bias on the source was varied up to +1600 V beyond which no delayed signal was expected. As shown on Fig. 6, the intensity of the delayed component decreases with increasing voltages and disappears beyond +1600 V. We plotted on the same graph the variations of the prompt peak intensity in the TAC spectrum gated on each of the three γ peaks. For each set, the data were normalized at their +600 V value. The variations with the bias voltage are very similar but differ from that of the delayed component, which means the underlying electron spectrum is different. This difference mainly comes from the high energy Auger electrons.
FIG. 6. Normalized intensity of the delayed component and prompt peak gated on the 135 keV, 167 keV and 439 keV γ-rays energies versus the bias voltage target (the solid curves serve only to guide
the eyes)
From these various results, the lifetime of the 1.565 keV level is assigned without ambiguity to (81±5) ns which corresponds to the best reduced χ2 value.
TABLE II. Relative intensities of conversion electrons following the 1.565 keV level decay. Experimental and theoretical intensities are obtained from [14,15] and [21], respectively.
Mixing ratio
δ
2 =(2.10±0.55)10-4 [15]δ
2 =(1.1±0.3)10-4 [14] Sub-shellsratio Experimental Theoretical Experimental Theoretical N1/N2 0.94±0.31 0.74 1.19±0.30 1.32 N2/N3 0.64±0.05 0.76 0.92±0.15 0.82 N1/N3 0.6±0.2 0.57 1.1±0.2 1.08 O1/N2 0.128±0.030 0.14 0.29 O2/N3 0.158±0.030 0.13 0.16 O3/N3 0.20±0.04 0.17 0.18
8
In order to extract the reduced matrix elements B(E2;1/2-→3/2-) and B(M1;1/2-→3/2-), the internal conversion coefficients calculated by Band and Trzhaskovskaya [21] for the 1.565 keV 201Hg transition were used. In this approach the bound and free electron wave functions are obtained in the relativistic Dirac-Fock atomic field. The calculations are based on the nuclear model of a uniform charge distribution over the volume of a spherical nucleus. The surface currents of the transition inside the nucleus and holes in the shell from which the electron is converted are taken into account. The Table II displays the relative intensities of the partial conversion coefficients compared to the experimental ones [14-16]. Using both the mixing ratio values of (2.10±0.55)10-4 [15] and (1.1±0.3)10-4 [14], we obtain a total conversion coefficient of (6.50±1.25) 104 and (4.23±0.68) 104, respectively.
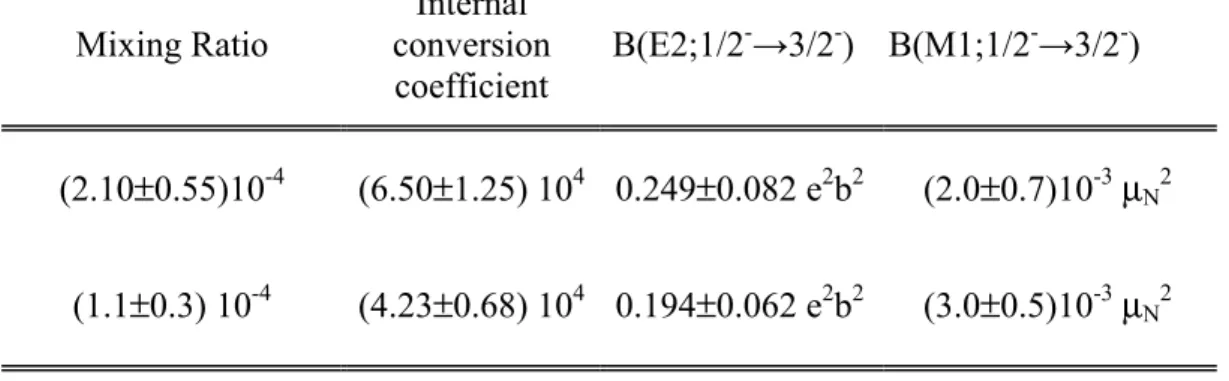
From the calculated internal conversion coefficient, the E2/M1 multipole mixing ratio and the measured lifetime, we can derive the reduced matrix elements. The Table III shows the extracted B(E2) and B(M1) using both mixing ratios. The B(E2;1/2-→3/2-) obtained with the mixing ratio value from [15] is very close to weighted average B(E2;1/2-→3/2-)=0.254±0.034 e2b2 value obtained from muonic x-ray transitions [17] corrected by the spin ratio (2ji+1)/(2jf+1) =2, where ji and jf are
the initial and final total angular momentum, respectively. Although both extracted B(E2) values are compatible, in the following we will use the reduced matrix elements obtained with the mixing ratio of (2.10±0.55)10-4. Contrary to [14], the mixing ratio in [15] is obtained with the lines associated with the outer O subshells whose uncertainties are the lowest. As discussed in [15], the disagreement could arise from a different treatment of Auger and backscattering electrons.
TABLE III. Extracted B(E2) and B(M1) as a function of the mixing ratio and internal conversion coefficient. Mixing Ratio Internal conversion coefficient B(E2;1/2-→3/2-) B(M1;1/2-→3/2-) (2.10±0.55)10-4 (6.50±1.25) 104 0.249±0.082 e2b2 (2.0±0.7)10-3µN2 (1.1±0.3) 10-4 (4.23±0.68) 104 0.194±0.062 e2b2 (3.0±0.5)10-3µN2
With these reduced matrix elements, we calculated the NEET [22-24] rate of the 1.565 keV in plasma. The NEET process is a resonant process involving both the excitation of the nucleus and the de-excitation of the atomic system by an electronic transition between two atomic bound states. Some difficulties arise in observing this effect. On the one hand, the coupling matrix element between atomic and nuclear systems is very low because it strongly depends on the presence of the electrons close to the nucleus. On the other hand, the matching between the nuclear and electronic transitions may be poor. Because both quantities depend on the electronic configuration, the NEET probability can be enhanced by modifying the atomic environment of the nucleus. In hot dense plasmas, the thermodynamic conditions strongly affect the electronic environment of the ions. Thus, plasmas are ideal laboratories to observe these modifications of nuclear rates. However, a calculation of the NEET process in plasma needs to have a precise description of the atomic properties and an accurate representation of the statistical nature of the electronic spectrum. A NEET model in plasma at LTE has recently been worked out [5]. The most relevant hydrodynamic parameters, such as charge state,
density or temperature were calculated under the LTE hypothesis using a relativistic average atom model [25]. Our NEET model takes into account the statistical nature of the electronic spectrum using a Gaussian distribution of the configurations [26] around the transition given by the average relativistic atom model. It enables to derive a transition rate as a function of the temperature T and the density
ρ
of the plasma. We applied this calculation to the excitation of the first isomeric state of201
Hg for a broad range of temperatures and densities.
According to the reference [5], we express the NEET rate as:
( )
(
)
2 2 2 2 2 , 2 1 1 2 , σ δπσ
π
ρ
λ
NEET T = Dipi − pf Ri f e− hwhere the subscripts i and f label the initial and final orbital, respectively, p is the occupation probability of an orbital with degeneracy D, given by the Fermi-Dirac statistics,
δ
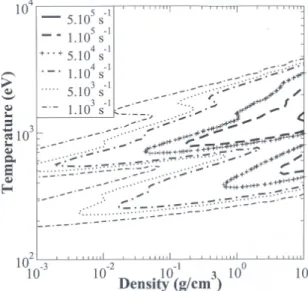
is the mismatch energy between the atomic and the nuclear transition and σ the energy variance describing the dispersion of the electronic transition energy of real configurations around the average atom value. |Ri,f |2 is the coupled atom-nucleus matrix element defined in [5].Figure 7 shows the map of the NEET rate of the excitation of the first isomeric state of 201Hg. It strongly depends on thermodynamic conditions. Variations of the temperature or density modify the atomic transition energy and thus the mismatch. Another feature apparent in Fig. 7 is that the rate originates from a small number of electronic transitions. Two areas are favourable to the NEET mechanism. They are found around a temperature of 250 and 630 eV assuming a plasma density of 10-2 g/cm3 (cutoff density for 0.53 µm laser wavelength). The first zone corresponds to 6s1/2-4s1/2
(P1-N1) and 6p3/2-4p1/2 (P3-N2) electronic transitions, the second one to 5p3/2-4p1/2 (O3-N2) and
5s1/2-4p1/2 (O1-N1) electronic transitions. The average ionic charges under both thermodynamic
conditions, 250 eV and 630 eV, for 10-2 g/cm3, are around 44+ and 61+, respectively. The latter ionic charge is too high to be reached in a laser experiment, so we will focus on the former.
.
FIG. 7. NEET rate map of the 1.565 keV level as a function of the plasma density and temperature
10
Figure 8 shows the NEET rate for both P3-N2 and P1-N1 resonant transitions at 10-2 g/cm3. The coupled atom-nucleus matrix elements are 2.9 10-8 eV2 and 2.7 10-8 eV2 for the P3-N2 and P1-N1 transition, respectively. Compared to the 235U case [5], the higher strength of the 201Hg NEET rate (a few 103 s-1) is mainly due to the nuclear part of the matrix element.
FIG. 8. NEET rate of the 1.565 keV level of 201Hg as a function of the plasma temperature. Although creating LTE plasma at 250 eV is a difficult task, this calculation may be useful to
design an experiment.
In summary, we have measured the half-life of the first excited state of 201Hg, located at 1.565 keV, to be (81±5) ns. With this value and using reliable theoretical conversion coefficients, the E2 and M1 transition rates were extracted. Our B(E2) transition rate is in a good agreement with the value obtained from muonic x-ray transitions. Using these reduced nuclear matrix elements, we calculated the NEET rate of the 1.565 keV level in LTE plasma. The NEET rate peaks at few 10+5 s-1 for the higher plasma density whereas in 235U it only reaches a few 10-4 s-1. The precise knowledge of the lifetime and the NEET rate will enable us to explore the excitation of this nuclear state in plasma.
*Electronic address: [email protected]; URL: http://www-phynu.cea.fr/
[1] K.W.D. Ledingham, P. McKenna and R.P. Singhal, Science 300, 1107 (2003).
[2] T.J. Burvenich, J.E. Christoph and H. Keitel, Phys. Rev. C 74, 044601 (2006).
[3] G. A. Mourou, T. Tajima and S. V. Bulanov, Rev. Mod. Phys. 78, 309 (2006).
[5] P. Morel, V. Méot, G. Gosselin, D. Gogny and W. Younes, Phys. Rev. A 69, 063414 (2004).
[6] Y. Izawa and C. Yamanaka, Phys. Lett. 88B, 59 (1979).
[7] R. V. Arutyunyan et al., Sov. J. Nucl. Phys. 53, 23 (1991).
[8] G. Claverie et al., Phys. Rev. C 70, 044303 (2004).
[9] F. Gobet et al., Rev. Sci. Instrum. 77, 093302 (2006).
[10] A.V. Andreev, R.V. Volkov and V.M. Gordienko, JETP 91, 1163 (2000).
[11] M. Harston and J. F. Chemin, Phys. Rev. C 59, 2462 (1999).
[12] A.V. Andreev, V.M. Gordienko, A.B. Savel’ev, E.V. Tkalya and A.M. Dykhne, JETP Lett. 66, 331 (1997).
[13] E.V. Tkalya, Laser Phys. 14, 360 (2004).
[14] O. Dragoun , V. Brabec, M. Ry avý, A. palek and K. Freitag, Z. Phys. A. 326, 279 (1987).
[15] V.N. Gerasimov, D.V. Grebennikov, V.M. Kulakov, Phys. At. Nucl. 60, 1780 (1997).
[16] V.V. Kharitonov and V.N. Gerasimov, Phys. At. Nucl. 65, 1377 (2002).
[17] A.A. Hahn, J.P. Miller, R.J. Powers, A. Zehnder, A.M. Rushton, R.E. Welsh, A.R. Kunselman and P. Roberson, Nucl. Phys. A 314, 361(1979).
[18] F.G. Kondev, ENSDF (2005)URL: http://www.nndc.bnl.gov/.
[19] B.M. Coursey, D.D. Hoppes, A.T. Hirschfeld, S.M. Judge, D.H. Woods, M.J. Woods, E. Funck, H. Schrader and A. G. Tuck, Appl. Radiat. Isot. 41, 289 (1990).
12
(John Wiley and Sons, New York , 1996, 1998, 1999).
[21] I. Band and M. B. Trzhaskovskaya, Bull. Acad. Sci. USSR, Phys. Ser. 55, 39 (1991).
[22] M. Morita, Progr. Theor. Phys. 49, 1574 (1973).
[23] E.V. Tkalya, Nucl. Phys. A 539, 209 (1992).
[24] M. Harston, Nucl. Phys. A 690 447 (2001).
[25] B.F. Rozsnyai Phys. Rev. A 5, 1137 (1972).