HAL Id: hal-01528028
https://hal-amu.archives-ouvertes.fr/hal-01528028
Submitted on 11 Jul 2017HAL is a multi-disciplinary open access archive for the deposit and dissemination of sci-entific research documents, whether they are pub-lished or not. The documents may come from teaching and research institutions in France or abroad, or from public or private research centers.
L’archive ouverte pluridisciplinaire HAL, est destinée au dépôt et à la diffusion de documents scientifiques de niveau recherche, publiés ou non, émanant des établissements d’enseignement et de recherche français ou étrangers, des laboratoires publics ou privés.
Retention and release of hydrogen isotopes in tungsten
plasma-facing components: the role of grain boundaries
and the native oxide layer from a joint
experiment-simulation integrated approach
E.A. Hodille, F Ghiorghiu, Younès Addab, A Založnik, Marco Minissale, Z
Piazza, Céline Martin, Thierry Angot, Laurent Gallais, Marie-France Barthe,
et al.
To cite this version:
E.A. Hodille, F Ghiorghiu, Younès Addab, A Založnik, Marco Minissale, et al.. Retention and release of hydrogen isotopes in tungsten plasma-facing components: the role of grain boundaries and the native oxide layer from a joint experiment-simulation integrated approach. Nuclear Fusion, IOP Publishing, 2017, 57 (7), pp.076019. �10.1088/1741-4326/aa6d24�. �hal-01528028�
E.A. Hodille1,8, F. Ghiorghiu2, Y. Addab2, A. Založnik3, M. Minissale2,4,
Z. Piazza2,5, C. Martin2, T. Angot2, L. Gallais4, M.-F. Barthe6, C.S. Becquart5,
S. Markelj3, J. Mougenot7, C. Grisolia1 and R. Bisson2
1 CEA, IRFM, 13108 Saint-Paul-lez-Durance, France 2 Aix-Marseille Univ, CNRS, PIIM, Marseille, France
3 Jožef Stefan Institute, Jamova cesta 39, Ljubljana 1000, Slovenia
4 Aix-Marseille Univ, CNRS, Centrale Marseille, Institut Fresnel, Marseille, France
5 Université de Lille, CNRS, INRA, ENSCL, UMR 8207, UMET, Unité Matériaux et Transformations, Lille 59000, France
6 CNRS, CEMHTI UPR 3079, Université d’Orléans, Orléans 45071, France
7 LSPM, CNRS, Université Paris 13, Sorbonne Paris Cité, Villetaneuse 93430, France 8 Current address: Aix-Marseille Univ, CNRS, PIIM, Marseille, France
E-mail: regis.bisson@univ-amu.fr
Received 16 December 2016, revised 17 March 2017 Accepted for publication 13 April 2017
Published 18 May 2017
Abstract
Fusion fuel retention (trapping) and release (desorption) from plasma-facing components are critical issues for ITER and for any future industrial demonstration reactors such as DEMO. Therefore, understanding the fundamental mechanisms behind the retention of hydrogen isotopes in first wall and divertor materials is necessary. We developed an approach that couples dedicated experimental studies with modelling at all relevant scales, from microscopic elementary steps to macroscopic observables, in order to build a reliable and predictive fusion reactor wall model. This integrated approach is applied to the ITER divertor material (tungsten), and advances in the development of the wall model are presented. An experimental dataset, including focused ion beam scanning electron microscopy, isothermal desorption, temperature programmed desorption, nuclear reaction analysis and Auger electron spectroscopy, is exploited to initialize a macroscopic rate equation wall model. This model includes all elementary steps of modelled experiments: implantation of fusion fuel, fuel diffusion in the bulk or towards the surface, fuel trapping on defects and release of trapped fuel during a thermal excursion of materials. We were able to show that a single-trap-type single-detrapping-energy model is not able to reproduce an extended parameter space study of a polycrystalline sample exhibiting a single desorption peak. It is therefore justified to use density functional theory to guide the initialization of a more complex model. This new model still contains a single type of trap, but includes the density functional theory findings that the detrapping energy varies as a function of the number of hydrogen isotopes bound to the trap. A better agreement of the model with experimental results is obtained when grain boundary defects are included, as is consistent with the polycrystalline nature of the studied sample. Refinement of this grain boundary model is discussed as well as the inclusion in the model
Nuclear Fusion
Retention and release of hydrogen isotopes
in tungsten plasma-facing components:
the role of grain boundaries and the
native oxide layer from a joint
experiment-simulation integrated approach
E.A. Hodille et al
Printed in the UK 076019 NUFUAU © 2017 Aix-Marseille Universite 57 Nucl. Fusion NF 10.1088/1741-4326/aa6d24
Paper
7 Nuclear Fusion IOPInternational Atomic Energy Agency
2017
1741-4326
https://doi.org/10.1088/1741-4326/aa6d24
of a thin defective oxide layer following the experimental observation of the presence of an oxygen layer on the surface even after annealing to 1300 K.
Keywords: tungsten, deuterium, grain boundary, oxide, macroscopic rate equations, thermo-desorption, ion beam
(Some figures may appear in colour only in the online journal)
1. Introduction
For ITER, tritium poses both nuclear regulation and economic issues due to, respectively, its radioactivity and the scarcity of its resources. These factors control the tritium inventory in the tokamak, especially in plasma-facing components (PFCs) composed of beryllium and tungsten, where the highest flux of particles is expected. In order to preserve a high duty cycle in ITER, a direct detailed control of the tritium inventory in PFCs cannot be routine. It is therefore important to develop a reliable first wall and divertor model to estimate the tritium content of PFCs at any time.
Currently, several codes are used in the literature to tackle the fuel retention issue in plasma-facing materials, especially in tungsten. Among them, one can find TMAP7 [1], TESSIM [2], HIIPC [3], MHIMS [4] and other unnamed codes that are still very much used in the community, such as those of Ogorodnikova et al [5], Guterl et al [6], Ahlgren et al [7] or Hu and Hassanein [8]. Most of these codes are used to simu-late experimental results, while thermo-desorption experi-ments help to determine the trapping parameters necessary for a convincing reproduction of the behaviour of deute-rium in tungsten materials. They all use a macroscopic rate equation (MRE) model that couples the diffusion of particles in a metallic lattice and the trapping of particles at defects.
In this article, we report on the development of an MRE model for tungsten-based PFCs. To reach the goal of an accu-rate description of the behaviour of these PFCs regarding hydrogen isotope retention, an integrated approach is pre-ferred. Our integrated approach consists in devising well characterized and modelled experiments in which a large parameter space can be explored on a single tungsten sample. In these experiments sample-to-sample variability is avoided and MRE model development is more accurate. In section 2, we first describe the complementary techniques used to grasp information on bulk and on surface proper-ties. Secondly, we give an overview of the experimentally explored parameter space. Then we present the MRE codes MHIMS [4] and MHIMS-Reservoir [9] which are used to construct tungsten wall models that will be tested on the experimental results. In section 3, we first elaborate on the parametrization of the MHIMS code, mostly on exper-imental inputs, and we estimate how far the model is able to reproduce experimental observations and draw conclu-sions on its achievements and failures. Then we discuss how MHIMS-Reservoir, which allows us to model multi-hydrogen isotope trapping on a single defect trap, can be parametrized based on density functional theory (DFT)
inputs, i.e. from a theoretical atomic scale description of fundamental processes. The improvements of the model-ling results from various DFT-MRE models, inspired by exper imental observables, are discussed and the resulting shortcomings or improvements are analysed in order to pro-pose future studies. This paper ends with a summary and a perspective on our MRE wall model development.
2. Methods
2.1. Experiments
Tungsten PFCs in ITER will be located in the divertor region of the tokamak and will contain polycrystalline tungsten with specific grain elongation in order to optimize heat transfer to the cooling structures [10]. However, in our experimental approach we need a model sample that can withstand multiple implantations and thermo-desorption cycles (typically around 100) without structure evolution affecting either its retention or its thermal release of hydrogen isotopes. Therefore, we used recrystallized polycrystalline tungsten. Our study is not representative for microscopic tungsten coatings on carbon fibre composite or other substrates as their porous structure can make it more likely that deuterium trapping will occur. Nevertheless, before tackling more complex and realistic materials it is preferable to describe correctly simpler tung-sten materials, such as recrystallized polycrystalline tungtung-sten, which has not been achieved yet.
The polycrystalline tungsten (99.99 wt.% purity) sample batch was recrystallized in vacuum for 1 h at 1573 K by the manufacturer (A.L.M.T. Corp., Japan). Samples (10 × 10 × 0.4 mm3) were subjected to mechanical polishing
and electro-polishing procedures at Aix-Marseille Université (AMU), Marseille, France, in order to reveal their micro-structure as well as to obtain reproducible thermo-desorption data. The quality of the preparation of these samples, from the surface viewpoint (figure 1(a)) and throughout the bulk (figure 1(b)), was measured by scanning electron microscopy (SEM) and focused ion beam SEM (FIB-SEM), respectively. A typical grain size on the order of ~10 µm was obtained on this sample batch, both on the surface and within the bulk, demonstrating the quality of the recrystallization and the polishing procedures.
Once the quality of its preparation was deemed satisfactory, the sample was introduced in the ultra-high-vacuum (UHV) cluster chamber setup at AMU (base pressure <4 × 10⁻⁸ Pa)
[11], where it remained in UHV conditions until the end of the implantation–thermo-desorption series.
The sample was first thoroughly degassed at 1300 K in UHV. Then, the sample was subjected to tens of implant ation –thermo-desorption cycles in order to explore the param eter space, composed of the storage time (figure 2(a)) and the implanted deuterium ion fluence (figure 2(b)). The former parameter allows us to probe how surface desorption and bulk diffusion compete in our experimental conditions, while the latter parameter per-mits us to explore how fluence affects hydrogen isotope retention and detrapping energies. A typical experimental cycle consisted, first, in implanting the tungsten sample at ~320 K with 500 eV
+
D2 ions with a constant incident flux of 2 × 10¹⁶ D+· m−2· s−1. This low flux ensured that there was no thermal gradient on the sample during implant ation. The fluence was varied by setting the duration of ionic implantation. Then, the sample was stored at a temperature of 300 K and at a pressure of 1 × 10⁻⁷ Pa for
a storage time varying between 2 h and 135 h. The minimum storage time of 2 h was limited by the procedure allowing the retrieval of low partial pressures for D2 and HD molecules in the
thermo- desorption setup [11]. Finally, the sample temperature was increased at a rate of 1 K · s−1 while a differentially pumped
quadrupole mass spectrometer was measuring in line-of-sight HD and D2 molecules emitted by the sample. This last step is
a temper ature programmed desorption (TPD), also known as thermal desorption spectroscopy. A typical TPD result (e.g. figure 2(c) or 2(d )) displays the desorption rate of the species of interest (here deuterium) as a function of the sample temper-ature. The desorption rate is initially minimal, indicating that the retained deuterium mostly stays in the sample. When the temper-ature of the sample is increased, an increasing amount of thermal energy is provided to deuterium that starts to be able to escape
Figure 1. (a) SEM image of the surface of a typical recrystallized polycrystalline tungsten sample used in this study. Grain size is quite homogeneous and on the order of ~10 µm. (b) SEM image of a focused ion beam (FIB) cross-section from the same sample batch. Three grains located close to the surface are shown and their size is consistent with the surface observation in (a).
Figure 2. Comparison between experimental data (symbols) and MRE results (lines) for a single-trap-type single-detrapping-energy model. Experimental data in (a), (b) and (d ) are adapted from [11].
the sample, which is manifested by an increase of the desorption rate. The maximum of the desorption rate (the so-called ‘desorp-tion peak’) is obtained for a specific temperature which depends on the kinetics of desorption as well as the remaining quantity of deuterium retained in the sample. Finally, the desorption rate returns to its minimal value when there is no deuterium left in the sample. An analysis of the desorption peak position and width provides information regarding deuterium retention and its detrapping energies. The former quantity (figures 2(a) and (b)) is obtained by integration of the TPD curve (figures 2(c) and (d )). The latter information is retrieved from an adequate analysis of the rate of deuterium desorption, e.g. with suitable MRE mod-elling (see next sections). Further experimental details on the implantation–thermo-desorption apparatus can be found in the article by Bisson et al [11].
To end the thermo-desorption campaign, the sample was implanted with a fluence of 1 × 10²¹ D+· m−2 at AMU and
brought to air in order to be sent for nuclear reaction analysis (NRA) at the Jožef Stefan Institute, Slovenia. About 30 h after implantation, the sample was introduced in the NRA vacuum vessel (base pressure 1 × 10⁻⁶ Pa) and exposed to a beam of 3He with variable kinetic energy in the MeV range. Using the
D(3He, p)α nuclear reaction, a depth profile of the deuterium
concentration was obtained up to 7 µm. Further experimental details on the NRA setup and analysis can be found in the article by Markelj et al [12]. Integration of the NRA deute-rium profile yields the deutedeute-rium retention within the probed depth, which agrees within less than a factor of two with the deuterium retention obtained by thermo-desorption [11].
Finally, several samples from the present recrystallized batch were analysed with an Auger electron spectrometer (Omicron SpectaLEED) in a UHV chamber with a base pres-sure of 2 × 10⁻⁸ Pa. This way the chemical composition in the
near-surface region was probed before and after the annealing procedure described above.
While the details of the experimental results will be described in section 3, it is important to note that the origi-nality of the thermo-desorption dataset, obtained from room-temperature implantation of low-energy deuterium ions, is to exhibit a single desorption peak. This feature makes it pos-sible to test the usual assumption that the number of trap types present in a material, and used in MRE modelling, is (at least) equal to the number of desorption peaks.
2.2. MRE models: single trap—single detrapping energy
The experiments we wish to model need to be handled at the mesoscopic scale because of the time and space scales involved. Models based on the chemical reaction rate theory (alternatively transition state theory) are commonly applied for this purpose. These models typically employ either the kinetic Monte Carlo or the mean field (effective medium) method here referred to as MRE. One-dimensional (1D) MRE codes are frequently used for extracting energetic information about the interaction of PFC materials with ion beams and plasmas [2, 5, 13]. We have recently developed such a code, MHIMS (for migration of hydrogen isotopes in materials) [4],
which describes numerous elementary steps encountered in real experiments. With MHIMS, one can simulate the implant-ation of hydrogen isotopes below the surface with their sub-sequent diffusion into the bulk or toward the surface and their trapping on bulk defects. Detrapping of hydrogen isotopes and diffusion are thermally activated processes, and thus they are active during the entire simulation i.e. from the beginning of the implantation to the end of a thermo-desorption or NRA experiment, including all the practical steps in between such as the storage time described in section 2.1.
Even though an arbitrary number of defect trap types can be implemented in the MHIMS code, in the present paper we preferably set up only one type of defect trap because of the single desorption peak measured experimentally. Indeed, one is generally able to fit any observable with a model that includes a large number of free parameters. However, we aim at testing whether the simplest model can reproduce our extensive experimental dataset and then seeing if its eventual failure can guide the construction of a more complex model with physical ground.
We will now describe briefly the MHIMS code; further details can be found in the article by Hodille et al [4]. A simple diagram such as the one shown in figure 3 repre-sents the potential energy experienced by a hydrogen iso-tope trapped in the bulk on its path to desorption. In order to escape from a trap, the hydrogen isotope needs to overcome a detrapping barrier Edetrap. Then, it has to surmount diffusion
barriers Ediff to reach the surface, go deeper in the bulk or
become trapped in another defect site. For tungsten, the dif-fusion well corresponds to a tetrahedral interstitial position [14–19] while the trapping well depends on the type of defect considered (vacancy, grain boundary site…). Finally, if two hydrogen isotopes reach the surface, they can recombine and form a desorbing molecule. The latter process has been shown not to be rate limiting in the experiments [11] simulated in this paper, and thus the desorption process is considered to be instantaneous in the present simulations. However, we inform the reader that the description of surface processes has been included in a recent upgrade of the MHIMS code [20]. Every barrier is surmounted with thermal energy, so we use the following Arrhenius formulation of kinetic rates:
= −
vprocess v0processexp( Ebarrier/k TB ), where Ebarrier can be one
of the process barriers listed above, vprocess0 is the rate constant
Figure 3. Potential energy diagram of a hydrogen isotope (represented by a filled circle) in tungsten, here trapped at a defect with a single detrapping energy. Edetrap and Ediff are explained in the text.
of the process, kB is the Boltzmann constant and T is the
sample temperature.
These rates are used to evolve the concentrations (in m−3)
of hydrogen isotopes trapped in defects, ct, as well as the
con-centration of hydrogen isotopes diffusing as interstitial atoms in the bulk, cm, with the following set of equations:
/ ϕ ( ) ( ) ν / /
∂ (1)cm∂ =t · 1−r f x· + diff·∂2cm∂ − ∂ ∂x2 ct t
/ ν ( / ) ( ) ν
∂ ∂ = (2)ct t trap· c nm m · nt−ct − detrap·ct where t and x are the temporal and spatial variables. Desorption of hydrogen isotopes occurs when particles arrive at x = 0 and the boundary condition is set to cm(x = 0) = 0 (instantaneous
desorption).
On the right-hand side of equation (1), the first term describes the implantation of impinging hydrogen isotope ions at a flux ϕ (in m−2· s−1) having a reflection probability r
and being deposited in the bulk as diffusing particles with an implantation profile f(x) (in m−1). The second term is Fick’s
law of diffusion where νdiff is the temperature-dependent
dif-fusion coefficient (in m2 · s−1). The third term expresses the
loss/gain of diffusing hydrogen isotopes into/from defect traps at a rate defined by equation (2).
On the right-hand side of equation (2), the first term defines the increase in concentration of trapped hydrogen isotopes as being proportional to the fraction of bulk interstitial sites containing a diffusing hydrogen isotope (cm/nm) and to the
concentration of empty trapping sites (nt − ct), in m−3. nm is
the constant concentration of bulk interstitial sites (in m−3)
where hydrogen isotopes can reside between two diffusion processes, the tetrahedral interstitial sites in tungsten [19] with six sites per unit cell of this body centred cubic crystal. nt is
the constant concentration of the defect trapping site (in m−3)
which depends on the sample under study and is assumed to be uniform throughout the bulk in this study (see section 3). The second term describes the decrease in concentration of trapped hydrogen isotopes following a simple thermal detrapping process.
Rate constants are defined in the following way: νdiff0 = D √m
H HI
/ , where DH is the
temperature-inde-pendent hydrogen diffusion coefficient (in m2· s−1) and
mHI is the ratio of mass of the hydrogen isotope to the
hydrogen atom. mHI = 2 here;
ν0trap= νdiff0 /( )λ2, where defect trapping of the diffusing
hydrogen isotope occurs from a tetrahedral interstitial
(Td) site (i.e. we work on the assumption of a low trap
concentration (nt nm)), and λ is the distance between the defect site and the Td site, approximately estimated by
the distance between two Td sites;
vdetrap0 is the usual first-order pre-exponential factor of a thermally activated process.
The MHIMS code, as it is presented here, can solve an MRE model of a tungsten sample able to retain implanted deuterium with a unique type of defect trap. It will therefore exhibit a single desorption peak, as shown in figures 2(c) and (d ), and this will be discussed in section 3.2.
2.3. MRE models: single trap—multi-detrapping energy
In recent years, first-principles calculations in the frame-work of the DFT have shown that a tungsten defect site can accommodate more than one hydrogen isotope. Furthermore, the detrapping energy of the defect site has been found to be dependent on the number of hydrogen isotopes bound to the tungsten defects site. This behaviour is somehow quite gen-eral, since it has been found by DFT for vacancies [14–19], dislocations [21] and grain boundaries [21, 22] in tungsten, and it has been recently included in MRE model codes by Schmid et al [23] and Hodille et al [9]. The latter implementa-tion used in the present work, called MHIMS-Reservoir [9], can be summarized with the potential energy diagrams of figure 4. Note that in the present application of the code, we have restricted the simulation of hydrogen isotopes to deute-rium atoms, the species implanted in the present experiments. Each trap in the bulk is able to bind several deuterium atoms and hence each trap is described with a filling level representative of the number of bound deuterium atoms. A different detrapping energy corresponds to each filling level and thus an index l is added to the code in order to follow the filling level of the trap and its corresponding detrapping energy Eldetrap. The exchange between the different filling levels induced by the detrapping or trapping process is taken into account by adding two more terms on the right-hand side of equation (2), see details in [9]. The remainder of the code is similar to the standard MHIMS code. The MHIMS-Reservoir code solves an MRE model of a tungsten sample with a unique type of defect trap in which the detrapping energy is a function of the number of deuterium atoms bonded to it. Thus, as the temperature of the sample is increased and deute-rium atoms are detrapped, the detrapping energy is changing.
Figure 4. Principle of the single-trap-type multi-detrapping-energy MRE model: each trap has a hydrogen isotope filling level l, the value of which determines the detrapping energy. Filled circles represent deuterium atoms.
This may appear in the MRE model as a broader desorption peak or the presence of multiple desorption peaks, depending on how spaced these detrapping energies are. This will be evi-denced and discussed in section 3.3.
3. Results and discussion
3.1. Single-trap-type single-detrapping-energy: MHIMS code parametrization
Having measured a single desorption peak for deuterium in our experimental conditions, the first step in constructing an MRE model for the sample is to test whether the single-trap-type single-detrapping-energy MRE model, the simplest model one can devise, can reproduce the experimental dataset. In order to set the parameters of the MRE model described in section 2.2, we chose to favour experimental observations. Therefore, we set the MRE parameters according to the following decreasing order of preference: (1) experimentally derived parameters (ϕ, DH, Ediff,
Edetrap), (2) parameters from a binary collision code (SRIM [24])
benchmarked on experimental observations (r, f(x)), and (3) DFT values (λ, vdetrap0 , nm); see table 1. The only free parameter left is
the density of trapping sites in our sample, nt.
We note that the experimental diffusion parameters (DH and Ediff) are the ones extracted from Frauenfelder [25],
which are considered to be the best available in the literature [26]. For the detrapping energy Edetrap, we extracted its value
from our experimental dataset considering that the storage time dependency of deuterium retention in figure 2(a) is actually an isothermal desorption experiment and using a first-order desorption kinetic analysis [11] with the attempt frequency
vdetrap0 calculated by Fernandez et al within DFT [19]. Finally, we chose a density of trapping sites nt independent of the bulk
depth because it was found experimentally that our samples have a consistent morphology from the surface throughout the bulk, see figures 1(a) and (b).
3.2. Single-trap-type single-detrapping-energy: comparison with experiments
In order to converge the MHIMS simulation, we minimized the difference between the simulation results and the exper-imental data describing the retention as a function of the
storage time (figure 2(a)) and as a function of incident ion fluence (figure 2(b)). By doing so we determined the only free parameter, nt, i.e. the concentration of uniformly distributed
defect trapping sites. The agreement is quantitative for both sets of measurements. However, if the prediction of the deu-terium retention, i.e. the integral of the TPD measurements, is quantitatively correct, the TPD simulations (figures 2(c) and (d )) do not agree with the measurements.
Figure 2(c) shows that the TPD simulation results repro-duce only qualitatively the experimental observation. Both in experiments and simulations, the maximum rate of desorption shifts by about 30 K to higher temperatures as the storage time is increased from 2 h to 135 h. This behaviour can be explained by hydrogen isotopes diffusing deeper in the bulk (not shown) as the storage time increases. However, the obvious ence between simulations and experiments is the differ-ence in the temperature position and width of the desorption peaks. The position and the width of the simulated TPD peaks
(position ~405 K, full width at half maximum—FWHM
~75 K) are systematically smaller than the experimental ones (position ~455 K, FWHM ~150 K). Such a difference cannot be ascribed to a difference in Ediff, since decreasing Ediff to
the DFT value of 0.2 eV [19] does not significantly change the hydrogen isotope bulk distribution, nor the position and width of the simulated TPD peaks (not shown). The simulated TPD peak positions can approach the experimental ones if the Edetrap value is increased, which necessitates a decrease
in nt in order to keep the TPD integral correct. However, this
change of (Edetrap; nt) results in a disagreement on the storage
time dependency of the absolute retention and does not sig-nificantly improve the peak width. Thus another physical pro-cess should be found to fix the difference of the TPD peak position and width. The usual way to deal with a TPD peak width discrepancy and/or some shallow bumps in the TPD is to invoke additional types of trapping sites with slightly dif-ferent (0.2–0.3 eV) detrapping energy [2, 4, 13]. However, by careful analysis of figure 2(d ) one can find a simpler physical explanation that keeps the number of trap types in the MRE model to only one, i.e. to the same number of TPD peaks observed experimentally.
A striking experimental result from figure 2(d ) is the observation that the temperature position of the maximum rate of desorption shifts to a lower temperature and then remains
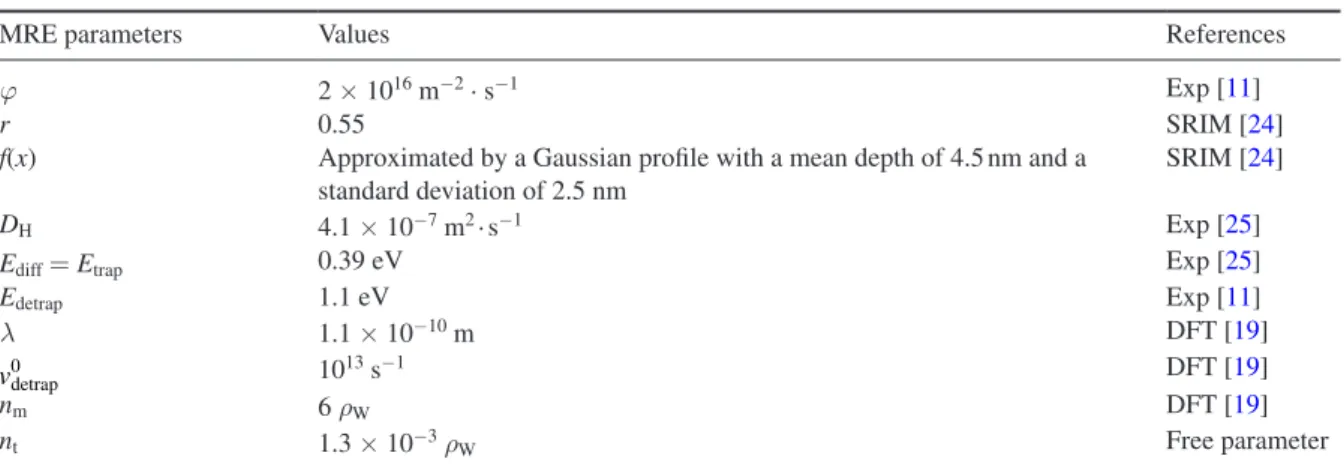
Table 1. Initialization of parameters for the single-trap–single-energy MRE model. ρW = 6.3 × 1028 m−3.
MRE parameters Values References
ϕ 2 × 10¹⁶ m−2· s−1 Exp [11]
r 0.55 SRIM [24]
f(x) Approximated by a Gaussian profile with a mean depth of 4.5 nm and a standard deviation of 2.5 nm
SRIM [24]
DH 4.1 × 10⁻⁷ m2· s−1 Exp [25]
Ediff = Etrap 0.39 eV Exp [25]
Edetrap 1.1 eV Exp [11]
λ 1.1 × 10⁻¹⁰ m DFT [19]
vdetrap0 1013 s−1 DFT [19]
nm 6 ρW DFT [19]
constant as the hydrogen fluence is increased. The oppo-site behaviour is obtained with the single-trap-type single- detrapping-energy MRE model, highlighting its failure to describe the correct physics underlying the experiments. As shown by Bisson et al [11], the experimental behaviour cannot be explained by a second-order surface rate-limiting step, but instead a bulk property may be invoked. Indeed, as discussed in section 2.3, recent DFT studies have demonstrated that a single defect site can trap multiple hydrogen isotopes and that the detrapping energy from the defect site is dependent on the number of trapped hydrogen isotopes. In particular, it was shown that Edetrap tends to decrease when the number of
trapped hydrogen isotopes around a defect site increases. As discussed by Bisson et al [11], this trend is consistent with the experimental observation of figure 2(d) where the TPD peak position is decreasing to a lower temperature (i.e. the deuterium is less strongly bound) when the deuterium fluence increases. Therefore, these DFT calculations seem to be a good lead to follow in order to develop an MRE model that keeps the ‘one TPD peak—one type of defect trap’ correspondence.
3.3. Single-trap-type multi-detrapping-energy grain boundary model with MHIMS-Reservoir: an MRE model parametrized with DFT
Given the polycrystalline nature of the sample used in the present study, it is natural to focus on defects that are related to grain boundaries. Note that we have modelled other types of defects but none alone give better results than the ones pre-sented here. Xiao and Geng have shown with DFT that a Σ3(1 1 1) grain boundary defect site can accommodate up to seven hydrogen isotopes [21] with detrapping energies Edetrap
ranging from 1.5 eV to 0.5 eV (Ediff from [19] has been added
to the binding energy from [21]). Since we will now use DFT results to define detrapping energies, we will also use DFT results to define diffusion and trapping energies. Table 2 presents a summary of the parameters used in the single-trap-type multi- detrapping-energy DFT-MRE model (‘grain boundary DFT-MRE model’) and which are different from the trap-type
single-detrapping MRE model (‘single-detrapping-energy MRE
model’, table 1). One can notice that the level-dependent detrap-ping energy initially decreases as the amount of bound deuterium increases until l = 4. Then Eldetrap tends to increase with further increase of the filling level l. This complete behaviour is imple-mented in the MHIMS-Reservoir code, even though in practice one may notice that a trap with filling level l > 3 should not (and will not) be populated significantly in the low-flux room-temper-ature conditions of our experimental setup.
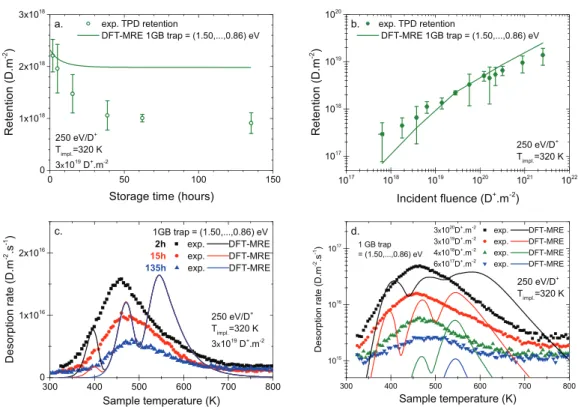
3.4. Single-trap-type multi-detrapping-energy grain boundary DFT-MRE model: comparison with experiments
Convergence of the simulation was realized by minimizing the difference between experimental results from figure 5(b) and the modelled retention as a function of deuterium implantation fluence. This way the only free parameter, nt, was determined.
First, it is clear that the obtained density of the uniformly distributed defect site is lower for the grain boundary
DFT-MRE model than for the single-detrapping-energy MRE model. This result is consistent with the fact that each Σ3(1 1 1) grain boundary defect site can accommodate more than one deuterium atom. Furthermore, detrapping energies below 1.0 eV (i.e. for filling levels l > 3) will lead to a rapid release of deuterium atoms at room temperature which is not observable on the time scale typical of our experiments. Therefore, deuterium atoms will accumulate on a defect site up to the filling level l = 3 and the density of defect site nt should be three times smaller for the grain
boundary DFT-MRE model than for the single-detrapping-energy MRE model of section 3.2, as shown in table 2 compared to table 1.
With this new simple DFT-MRE model, one can reproduce qualitatively the storage time dependency of deuterium reten-tion (figure 5(a)). The model exhibits the correct exponential decay of retention, with a modelled time constant of ~10 h, close to the 19 ± 5 h determined experimentally. However, the extent of reduction of the retention is underestimated in the model, ~11% instead of ~55% in the experiment. This dis-crepancy can be understood by considering the kinetics behind detrapping which will cause filling levels l = 1, 2, with detrap-ping energies of 1.30 eV and 1.50 eV, to not release deuterium atoms at room temperature on the experimental time scale. Thus in this model, the maximum retention loss observed after the end of the implantation stage should be 33% (1/3), origi-nating from the thermal release of l = 3. Here, we obtained 11% because the observation window started 2 h after the end of the implantation and because part of the deuterium released from l = 3 diffused towards the bulk.
The grain boundary DFT-MRE model gives its most noticeable improvement when comparing its results with TPD measurements (figures 5(c) and (d )). The first benefit of the grain boundary DFT-MRE model is its ability to obtain broad desorption peaks as well as correct peak positions for the ‘TPD peak envelope’. Note that the three-peak structure of the TPD peak envelope is a direct translation of the ~0.2 eV separation between the three filling levels l = 1, 2, 3 (table 2). We shall see in section 3.5 that this structure is a result of our simple DFT-MRE model.
Figure 5(c) shows that the DFT-MRE modelled TPD
peak envelope width (~150–200 K) is closer to the exper-imental TPD width of ~150 K than the previous MRE model
Table 2. Initialization of parameters for the single-trap –multi-detrapping-energy ‘grain boundary DFT-MRE model’. Only parameters different from table 1 are shown. ρW = 6.3 × 1028 m−3.
DFT-MRE parameters Values References Ediff = Etrap 0.20 eV DFT [19] Grain boundary El detrap l = 1: 1.50 eV; DFT [21] l = 2: 1.30 eV; l = 3: 1.10 eV; l = 4: 0.52 eV; l = 5: 0.62 eV; l = 6: 0.90 eV; l = 7: 0.86 eV
(FWHM ~75 K). Furthermore, it is still rendering correctly the TPD peak envelope shifts of ~30 K to higher temperatures with increasing storage time from 2 h to 135 h. Analysis of the DFT-MRE model explains that the observed TPD peak shift is due to the release of deuterium from the grain boundary defect site with filling levels l = 3, which ends up being filled at l = 2 after a storage time of several tens of hours.
The best improvement of the DFT-MRE model can be appreciated in figure 5(d) where it is modelled that the TPD peak envelope shifts to a lower temperature by ~50 K when the fluence increases, consistent with the experimental obser-vation. This is in stark contrast with the result of the previous single-trap–single-energy MRE model which erroneously found the opposite behaviour. The DFT-MRE model analysis shows that at the lowest experimental fluence (~1017 D+· m−2),
grain boundary defect sites are populated with only one deute-rium atom (l = 1) and a deutedeute-rium fluence of ~1019 D+· m−2
is needed to obtain sufficient filling of defect sites up to l = 3. The apparent smearing of the three-peak structure at a flu-ence >1020 D+ · m−2 (i.e. at implantation durations longer
than 3 h) seems to be related to the effect of bulk diffusion which should shift TPD peak positions to higher temperatures and broaden the TPD spectra, leading to an overlapping of the different desorption peaks related to the different filling levels.
3.5. Future developments: description of grain boundaries in a DFT-MRE model
We now turn to future developments we believe to be impor-tant to reach the goal of a quantitatively accurate tokamak wall MRE model. It was shown in section 3.4 that only the implementation of a simple one-trap–multi-detrapping-energy
DFT-MRE model was able to reproduce (at least) qualitatively all the parameter space explored in thermo-desorption experi-ments. This supports the necessity of implementing sound microscopic physics in any macroscopic wall MRE model. As discussed in the previous section, the simulated TPD peak envelope presented a three-peak structure that we linked to the 0.2 eV spacing between filling levels of the Σ3(1 1 1) grain boundary model. Of course, this latter model configuration does not represent the variety of defect site configurations of grain boundaries but only a specific type of grain boundary. Other configurations will probably give slightly different detrapping energies. Thus, if one could implement a large number of relevant grain boundary defect site configurations, one should get a TPD peak envelope which is smoother than the ones obtained in figure 5 and that should resemble better the experimental TPD measurements.
In order to support this argument, we implemented a two-grain boundary-defect-site—multi-detrapping-energy DFT-MRE model based on recent DFT calculations. The first grain boundary defect site used the DFT results for the Σ3(1 1 1) configuration of Xiao and Geng [21], while the second grain boundary defect site used the DFT results of Zhou et al obtained on a Σ5(3 1 0)/( 0 0 1) tilt configura-tion [22]. For the latter defect site, the maximum filling level found for the most stable hydrogen isotope configuration (I2) was l = 2 and we assumed that the potential energy profile presented in figure 10 of [22] for l = 1 (El= =1.15 eV
detrap1 )
remains similar for l = 2 except for the reduction of 0.13 eV in binding energy indicated in table 1 of [22]. The relative weight of each defect site was set equal.
Figure 6 presents a comparison between the single-grain-boundary-defect site (1 GB) and the two-grain-single-grain-boundary-defect
Figure 5. Comparison between experimental data (symbols) and DFT-MRE results (lines) for a single-trap-type multi-detrapping-energy grain boundary model. Experimental data in (a), (b) and (d ) are adapted from [11]. DFT data from [21] are used for the DFT-MRE model.
site (2 GB) DFT-MRE models. The smoothing effect of the 2 GB DFT-MRE model, relative to the 1 GB DFT-MRE model, is evidenced in figure 6(a) where the three-peak structure of the TPD envelope becomes less marked. Additionally, we observed a quantitative improvement of the storage time dependency of the deuterium retention for the 2 GB DFT-MRE model as compared to the 1 GB DFT-MRE model (not shown). While the extent of reduction of the retention was ~11% in the 1 GB DFT-MRE model, instead of ~55% in the experiment (figure 5(a)), it reaches ~25% in the 2 GB DFT-MRE model. Indeed, the addition of the second grain boundary defect site in the model results in two additional filling levels with detrapping energies in the 1.0–1.1 eV range which are responsible for the isothermal desorption at room temperature (see sections 3.2, 3.4 and [11]). Thus, we pro-pose that a more systematic study of multi-hydrogen isotope trapping on grain boundary defect sites should be performed in order to accurately describe the role of grain boundaries of polycrystalline tungsten materials. Indeed, it is sometimes argued that grain boundaries may act as a ‘short-circuit’ for hydrogen isotope diffusion in polycrystalline tungsten [27].
However, our simulation results show that, at least in certain configurations, grain boundaries can act as ‘deep traps’ that should be responsible for the long-term retention observed in the experiments simulated here (see figure 5(c)). Thus a more systematic study of the effect of grain boundary types on the retention of hydrogen isotopes in tungsten should be performed, e.g. as has been realized for other metals [28].
3.6. Future developments: accounting for surface contamination with oxygen in DFT-MRE models
Finally, we will present results which should help define new research directions. In figure 6(b) we display the deuterium bulk profile in our recrystallized polycrystalline tungsten sample obtained 30 h after an implantation with a fluence of 1 × 10²¹ D+ · m−2. It was found that deuterium is able
to diffuse in the bulk up to a 800 nm depth. However, both the single-trap-type MRE model and the grain boundary DFT-MRE models underestimated the diffusion length, since deuterium in simulations cannot go further than ~250 nm, as well as overestimated the concentration of deuterium in this diffusion length by a factor of 3–4, which is greater than the measured concentration taking into account uncertainties. The reason for this discrepancy is the total defect density nt Figure 6. (a) The TPD smoothing effect of the two-grain-boundary
site (2 GB) DFT-MRE model as compared to the single- grain-boundary site (1 GB) DFT-MRE model is illustrated for two-deuterium fluence. (b) Comparison between experimental NRA profile and different MRE and DFT-MRE models: the single-trap MRE simulation and three DFT-MRE simulations: the 1 GB model, the 2 GB model and a grain boundary +5 nm defective oxide layer model (2 GB + 5 nm oxide). Experimental data in (a) are adapted from [11]. DFT data from [21, 22, 30] are used for the DFT-MRE models.
Figure 7. Auger electron spectra of a recrystallized tungsten (W) sample as introduced in the UHV chamber (blue line) and after the UHV annealing procedure (red dotted line). It is observed that the native oxygen (O) is only slightly diminished.
Table 3. Initialization of parameters for the grain-boundary– defective-oxide-layer DFT-MRE model. Grain boundary DFT parameters are presented in table 2. ρW = 6.3 × 1028 m−3.
DFT-MRE
parameters Values References
Defective oxide layer El detrap l = 1: 1.40 eV; l = 2: 1.12 eV; DFT [30] l = 3: 1.10 eV; l = 4: 1.09 eV; l = 5: 0.60 eV; l = 6: 0.41 eV Defective oxide layer ntoxide Max: 1.35 × 10⁻³ ρ W Free parameter Exponential decay: ntoxidee at 5 nm
Grain boundary total density n2GBt
8.5 × 10⁻⁴ ρ
W Free
in the simulation, which is an order of magnitude too high. However, if one reduces the defect density in the model to match the measured deuterium diffusion length, one obtains absolute retention values which are too small as compared to the retention measured by NRA and TPD.
In order to resolve this discrepancy, i.e. in order to get a lower defect density in the bulk, an inhomogeneous distri-bution of defects appears to be required. However, the SEM and FIB-SEM images of our samples prior to implantation (figure 1) showed that the density of grain boundaries at the surface and throughout the bulk is consistent with a homo-geneous grain boundary defect density. Therefore, we are left with the proposition that a very thin layer of ‘damaged tungsten’ exists for our recrystallized tungsten samples in the near surface region, thinner than the FIB-SEM resolu-tion (which is impacted by the protective layer necessary for the lamella preparation), i.e. not thicker than about 10 nm. Confirmation of this hypothesis comes from Auger electron spectroscopy, which we present in figure 7.
The Auger spectra present both regions characteristic of tungsten and oxygen signatures. After the annealing proce-dure described in section 2.1, the tungsten signature becomes better resolved and more intense, showing that the contami-nation from air exposure has been removed. However, the oxygen signature only slightly decreased, demonstrating that our degassing procedure, which is very common in the lit-erature, always leaves some of the native oxide layer on the surface. This result is consistent with the desorption temper-ature of oxygen from tungsten, which is known to be above 2000 K [29].
It has been shown that WO3 tungsten oxide layers with a
thickness of several hundred nanometres act as a desorption
barrier for implanted deuterium [5]. Even though the remaining native oxide observed in the present experiments is much thinner and should have a different stoichiometry than the aforementioned WO3, we propose that the remainder of the
native oxide surface layer acts as a thin and dense defec-tive layer which will affect deuterium retention. In order to estimate the effect of such a defective oxide layer, we set up a DFT-MRE model which includes the description of the polycrystalline nature of our samples (in a similar fashion to section 3.5) as well as the presence of a thin defective oxide layer in the near-surface region. For the latter type of defective oxide, we used DFT results from Kong et al which showed that up to eight hydrogen isotopes can bind on an oxygen– vacancy complex (V–O) in tungsten [30]. We considered an exponentially decaying defective oxide layer, with ~37% of the maximum concentration at 5 nm from the surface, while the grain boundary defect site concentration remains constant. Table 3 presents a summary of the natively oxidized polycrystalline tungsten sample DFT-MRE model. Free parameters were the density of V–O defects in the oxide layer
ntoxide and the grain boundary defect site density n2GBt . Note that in order to reduce the computational cost, we included the description of V–O oxide defects only up to l = 6, which should be sufficient in our experimental conditions since for l > 6, Edetrap < 0.40 eV (Ediff from [19] has been added to the
binding energy from [30]).
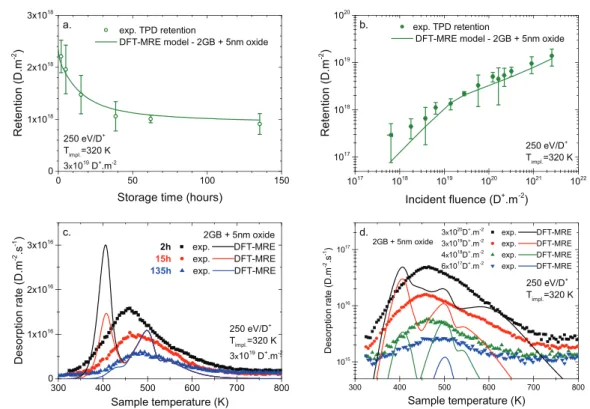
The results of this grain-boundary–defective-oxide-layer DFT-MRE model are presented in figures 6(b) and 8 and are encouraging since all thermo-desorption results and the NRA measurements are at least qualitatively reproduced. For example, figure 8(a) shows that the dynamic retention with storage time observed experimentally is now reproduced quantitatively.
Figure 8. Comparison between experimental data (symbols) and DFT-MRE results (lines) from a grain boundary +5 nm defective oxide layer model. Experimental data in (a), (b) and (d ) are adapted from [11]. DFT data from [21, 22, 30] are used for the DFT-MRE model.
Furthermore, the TPD peak envelope is better reproduced (figure 8(d )) since the TPD width rendered by the DFT-MRE 2 GB + oxide model agrees better with the experimental TPD experiments than e.g. the 1 GB DFT-MRE model (figure 5(d)). Additionally, the evolution of the deuterium retention with ion fluence is now quantitatively reproduced, even at high fluence (figure 8(b)). We note that in this latter graph a kink in the rate of increase of retention is observed at a fluence of a few 1019 D+· m−2. We interpret this behaviour as a manifestation
of the concentration of mobile particles reaching its steady state. Indeed, the migration limited regime of the retention dependency with fluence starts only once this steady-state value is reached, which depends on the deuterium impinging flux and sample temperature. In our experimental conditions it should occur in the fluence range of 1019 D+· m−2. Finally,
the most significant improvement is the quantitative agree-ment with the NRA deuterium depth profile (figure 6(b)). Both the diffusion length and the absolute concentration of deuterium up to a few microns in the simulation match the NRA measurement, within the experimental uncertainty.
Of course, the defective oxide layer description we implemented in this last DFT-MRE model might be crude. Nevertheless, we used the sole DFT results available in the literature, to our knowledge, and the obtained positive results should be seen as an encouraging preliminary result. Therefore, we consider that ample research time should be devoted to the study of tungsten oxide and its effect on the retention of deuterium in polycrystalline tungsten.
4. Summary and perspectives
We presented a joint experiment-simulation study of deute-rium retention in recrystallized polycrystalline tungsten aimed at guiding the development of an MRE model for PFCs used in all metal tokamaks. The presented implantation and thermo-desorption experiments probed a large parameter space on a single sample and always exhibited a single desorption peak. The latter observation allowed the development of an MRE model in a systematic manner.
Starting with the simplest model possible, a single trap type with a single detrapping energy, we found that it is possible to reproduce at least qualitatively only three of the four exper-imental thermo-desorption results. The failure of the simplest MRE model to reproduce the TPD peak shift to lower temper-ature with increasing fluence was analysed and we argued that it is possible to keep the simplicity of a single-trap-type model to rationalize all experimental observations. Indeed, a phys-ical interpretation was found from the DFT literature: defects in tungsten can accommodate more than one hydrogen isotope per defect site, and the detrapping energy is dependent on the number of hydrogen isotopes bound to the defect site.
Because the experimental dataset has been obtained from polycrystalline tungsten, we described the setup of a single-trap-type DFT-MRE model based on a single-grain-boundary defect site with multi-detrapping energy defined by DFT. The results of this simple DFT-MRE model show an improve-ment in simulating the experiimprove-ment dataset since all four
experimental thermo-desorption results are at least qualita-tively reproduced. The DFT-MRE model exhibits structures in the simulated TPD measurements that do not exist in the experiments. We argued that this is a result of the single site approximation of the grain boundary DFT-MRE model and demonstrated that the inclusion of a more complete descrip-tion of the grain boundary sites should smear out the structure of the simulated TPD.
Next, we compared the DFT-MRE model with NRA deu-terium profile measurements and found a discrepancy of the grain boundary DFT-MRE model in terms of the deuterium diffusion length and concentration. Based on FIB-SEM obser-vations and Auger electron spectroscopy, we rationalize the difference between the grain boundary DFT-MRE model and the NRA measurements by the existence of a remaining few nanometres of the native tungsten oxide surface layer. Finally, we implemented a grain-boundary –defective-oxide-layer DFT-MRE model which was successful in simulating the whole thermo-desorption and NRA experimental dataset. Our experimental results demonstrated that the usual annealing procedures used in the literature should leave the remainder of the native tungsten oxide layer, and that accounting for it in modelling can improve simulation results. This finding strongly suggests that oxide layers should be taken into account in building an accurate tokamak wall model. We will focus our future studies on this oxide problem. In summary, the interplay between well-controlled experiments and the systematic test and development of an MRE model supported by multi-scale modelling down to an atomic scale description such as the one obtained by DFT, is the foundation of our inte-grated approach and has already provided some interesting new results.
Acknowledgments
This work has been carried out thanks to the support of the A*MIDEX project (no. ANR-11-IDEX-0001-02) funded by
the ‘Investissements d’Avenir’ French government program, managed by the French National Research Agency (ANR). This work has been carried out within the framework of the EUROfusion Consortium and has received funding from the Euratom research and training programme 2014–2018 under grant agreement no. 633053. The views and opinions expressed herein do not necessarily reflect those of the European Com-mission. Work performed under EUROfusion WP PFC. References
[1] Longhurst G.R. 2008 Tmap7 User Manual, INEEL/EXT-04-02352 (Idaho National Laboratory (INL)) (https://doi. org/10.2172/952013)
[2] Schmid K., Rieger V. and Manhard A. 2012 Comparison of hydrogen retention in W and W/Ta alloys J. Nucl. Mater.
426 247
[3] Sang C. et al 2014 Modelling of hydrogen isotope retention in the tungsten divertor of EAST during ELMy H-mode Fusion Eng. Des. 89 2214
[4] Hodille E.A. et al 2015 Macroscopic rate equation modeling of trapping/detrapping of hydrogen isotopes in tungsten materials J. Nucl. Mater. 467 424
[5] Ogorodnikova O.V., Roth J. and Mayer M. 2003 Deuterium retention in tungsten in dependence of the surface conditions J. Nucl. Mater. 313–6 469
[6] Guterl J., Smirnov R.D., Krasheninnikov S.I., Zibrov M. and Pisarev A.A. 2015 Theoretical analysis of deuterium retention in tungsten plasma-facing components induced by various traps via thermal desorption spectroscopy Nucl. Fusion 55 093017
[7] Ahlgren T., Heinola K., Vörtler K. and Keinonen J. 2012 Simulation of irradiation induced deuterium trapping in tungsten J. Nucl. Mater. 427 152
[8] Hu A. and Hassanein A. 2014 Modeling hydrogen isotope behavior in fusion plasma-facing components J. Nucl. Mater. 446 56
[9] Hodille E.A. et al 2016 Study of hydrogen isotopes behavior in tungsten by a multi trapping macroscopic rate equation model Phys. Scr. 2016 014011
[10] Kalinin G. et al 2001 ITER R&D: vacuum vessel and in-vessel components: materials development and test Fusion Eng. Des. 55 231
[11] Bisson R. et al 2015 Dynamic fuel retention in tokamak wall materials: an in situ laboratory study of deuterium release from polycrystalline tungsten at room temperature J. Nucl. Mater. 467 432
[12] Markelj S. et al 2014 In situ nuclear reaction analysis of D retention in undamaged and self-damaged tungsten under atomic D exposure Phys. Scr. 2014 014047
[13] Poon M., Haasz A.A. and Davis J.W. 2008 Modelling deuterium release during thermal desorption of D+-irradiated tungsten J. Nucl. Mater. 374 390 [14] Liu Y.-L. et al 2009 Vacancy trapping mechanism for
hydrogen bubble formation in metal Phys. Rev. B
79 172103
[15] Heinola K., Ahlgren T., Nordlund K. and Keinonen J. 2010 Hydrogen interaction with point defects in tungsten Phys. Rev. B 82 094102
[16] Johnson D.F. and Carter E.A. 2010 Hydrogen in tungsten: absorption, diffusion, vacancy trapping, and decohesion J. Mater. Res. 25 315
[17] Ohsawa K., Goto J., Yamakami M., Yamaguchi M. and Yagi M. 2010 Trapping of multiple hydrogen atoms in a tungsten monovacancy from first principles Phys. Rev. B
82 184117
[18] You Y.-W. et al 2013 Dissolving, trapping and detrapping mechanisms of hydrogen in bcc and fcc transition metals AIP Adv. 3 012118
[19] Fernandez N., Ferro Y. and Kato D. 2015 Hydrogen diffusion and vacancies formation in tungsten: density functional theory calculations and statistical models Acta Mater.
94 307
[20] Hodille E.A. et al 2017 Simulations of atomic deuterium exposure in self-damaged tungsten Nucl. Fusion
57 056002
[21] Xiao W. and Geng W.T. 2012 Role of grain boundary and dislocation loop in H blistering in W: a density functional theory assessment J. Nucl. Mater. 430 132
[22] Zhou H.-B. et al 2010 Investigating behaviours of hydrogen in a tungsten grain boundary by first principles: from dissolution and diffusion to a trapping mechanism Nucl. Fusion 50 025016
[23] Schmid K., Von Toussaint U. and Schwarz-Selinger T. 2014 Transport of hydrogen in metals with occupancy dependent trap energies J. Appl. Phys. 116 134901
[24] Ziegler J.F., Ziegler M.D. and Biersack J.P. 2010 SRIM—the stopping and range of ions in matter (2010) Nucl. Instrum. Methods Phys. Res. B 268 1818
[25] Frauenfelder R. 1969 Solution and diffusion of hydrogen in tungsten J. Vac. Sci. Technol. 6 388
[26] Lu G.-H., Zhou H.-B. and Becquart C.S. 2014 A review of modelling and simulation of hydrogen behaviour in tungsten at different scales Nucl. Fusion 54 086001
[27] Tanabe T. 2014 Review of hydrogen retention in tungsten Phys. Scr. 2014 014044
[28] Oudriss A. et al 2012 Grain size and grain-boundary effects on diffusion and trapping of hydrogen in pure nickel Acta Mater. 60 6814
[29] Engel T., Niehus H. and Bauer E. 1975 Adsorption of oxygen on W(1 1 0):I. The p(2 × 1) structure Surf. Sci. 52 237
[30] Kong X.-S. et al 2013 The role of impurity oxygen in hydrogen bubble nucleation in tungsten J. Nucl. Mater.