HAL Id: hal-03163379
https://hal.sorbonne-universite.fr/hal-03163379
Submitted on 9 Mar 2021
HAL is a multi-disciplinary open access
archive for the deposit and dissemination of
sci-entific research documents, whether they are
pub-lished or not. The documents may come from
teaching and research institutions in France or
abroad, or from public or private research centers.
L’archive ouverte pluridisciplinaire HAL, est
destinée au dépôt et à la diffusion de documents
scientifiques de niveau recherche, publiés ou non,
émanant des établissements d’enseignement et de
recherche français ou étrangers, des laboratoires
publics ou privés.
Two-dimensional phase cartography for high-harmonic
spectroscopy
Antoine Camper, Emmanouil Skantzakis, Romain Géneaux, François Risoud,
Elizabeth English, Zsolt Diveki, Nan Lin, Vincent Gruson, Thierry Auguste,
Robert Lucchese, et al.
To cite this version:
Antoine Camper, Emmanouil Skantzakis, Romain Géneaux, François Risoud, Elizabeth English, et
al.. Two-dimensional phase cartography for high-harmonic spectroscopy. Optica, Optical Society of
America - OSA Publishing, 2021, 8 (3), pp.308. �10.1364/optica.403859�. �hal-03163379�
Two-dimensional phase cartography for
high-harmonic spectroscopy
Antoine Camper,
1Emmanouil Skantzakis,
1Romain Géneaux,
1François Risoud,
2Elizabeth English,
1,3Zsolt Diveki,
1Nan Lin,
1Vincent Gruson,
1Thierry Auguste,
1Bertrand Carré,
1Robert R. Lucchese,
4Alfred Maquet,
2Richard Taïeb,
2Jérémie Caillat,
2Thierry Ruchon,
1AND
Pascal Salières
1,*
1LIDYL, CEA, CNRS, Université Paris-Saclay, CEA Saclay, 91191 Gif-sur-Yvette, France
2Sorbonne Université, CNRS, Laboratoire de Chimie Physique-Matière et Rayonnement, LCPMR, F-75005 Paris, France 3NPL, Hampton Road, Teddington, TW11 0LW, UK
4Lawrence Berkeley National Laboratory, Berkeley, California 94720-8196, USA *Corresponding author: [email protected]
Received 27 July 2020; revised 13 January 2021; accepted 14 January 2021 (Doc. ID 403859); published 2 March 2021
Extremely nonlinear spectroscopy based on high-order-harmonic generation has become a powerful investigation method for attosecond dynamics in gas and solid targets. In particular, the phase of harmonic emission was shown to carry profound insight into atomic and molecular structure and dynamics. However, current techniques offer phase measurements only along specific directions, thus providing partial characterization. Here we report on a new approach combining optical and quantum interferometers measuring along two dimensions the intensity and phase of har-monic emission from aligned molecules in the exact same experimental conditions. This two-dimensional cartography technique measures the phase with no arbitrary offset and no uncertainty on its sign. Measurements along different dimensions can be combined in two ways: either a single mapping or a redundant mapping allowing high-precision phase recovery using a Shack–Hartmann-like algorithm. We demonstrate both methods in a nitrogen test case, which allows disentangling structural and dynamical effects. Two-dimensional phase cartography paves the way to high-resolution high-harmonic spectroscopy for applications such as quantum orbital tomography and attosecond charge migration in molecules. © 2021 Optical Society of America under the terms of theOSA Open Access Publishing Agreement https://doi.org/10.1364/OPTICA.403859
1. INTRODUCTION
High-harmonic spectroscopy (HHS) has opened the perspective of studying electronic and nuclear motion in all states of matter with both attosecond and Ångström resolution. Studies have extended from atomic and molecular gases [1–8] to the solid state [9–11]. In molecules, a wealth of ultra-fast processes such as vibrations [12,13], bond breaking [14], conical intersection [15], and charge migration [4,5] have been successfully investigated. HHS relies on the advanced characterization (amplitude, phase, polarization) of harmonic emission resulting from the interaction of the target system with a strong laser field. At the molecular level, a tunnel-ionized electron wave packet (EWP) is accelerated at each cycle of the oscillating laser field and subsequently recombines with its parent molecular ion, releasing its kinetic energy in the form of a burst of extreme ultraviolet (XUV) photons [16,17]. This harmonic emission encodes a wealth of structural and dynami-cal information on the target. In particular, the phase evolution across the high-order harmonic spectrum is a very fine probe of the attosecond dynamics occurring at the molecular level. More specifically, the harmonic phase encodes: (i) the relative timing of the different harmonic orders, allowing, e.g., probing attosecond
dynamics by chirp encoded recollision (PACER)-type measure-ments to uncover attosecond nuclear dynamics and structural rearrangements [2,18]; (ii) dynamical interference between dif-ferent ionization channels, revealing electron rearrangement and hole migration upon ionization [3–5]; and (iii) structural interfer-ence in the recombination dipole, allowing reconstruction of the molecular orbitals through a tomographic procedure [1,5,19–21].
While the attosecond resolution of HHS arises from the timescale of the recombination event within the elementary proc-ess of high-order harmonic generation (HHG), the Ångström spatial resolution is a consequence of both the short de Broglie wavelength of the recombining electron, and its well-defined recollision direction, parallel to the driving laser linear polariza-tion. However, in the harmonic signal emitted by a macroscopic molecular ensemble, the sought-after single-molecular response is convoluted with the experimental angular distribution of molecules, which, for random alignment, smears out the detailed spatial information. It is therefore necessary to laser-prealign the molecules in the laboratory frame, thus fixing the electron recol-lision direction in the molecular frame with a precision set by the degree of alignment.
Research Article Vol. 8, No. 3 / March 2021 / Optica 309
Up to now, the phaseφ of the high-order harmonics generated in aligned molecular samples has been measured mostly along the spectral dimension (harmonic photon energyhν) for a specific
alignment angle (θ0), which will be referred to here asφ(θ0, hν),
using the reconstruction of attosecond beating by interference of two-photon transitions (RABBIT) electronic interferometry tech-nique [5,21,22]. Other measurements grant access to the phase as a function of the alignment angleθ for each harmonic photon energyhν0, which hereafter will be referred to asφ(θ, hν0), using
optical interferometry (e.g., two-source optical interferometry (TSI) [4,23–25] and other techniques such as gas mixing [26] or transient grating [27]). Comparing the results obtained with this wealth of techniques in different laboratories is difficult for at least two reasons. First, different experimental conditions such as the degree of molecular alignment and the infrared (IR) driving intensity can drastically change the results of phase measurements [4,28–30]. Second, because of the incomplete measurement, arbi-trary phase shifts have to be introduced in all of these approaches implemented individually to reconstruct the completeφ(θ, hν) map. This results in partial and sometimes contradictory pictures of the same phenomenon (compare e.g., [5,24,31] for nitrogen). To date, only one attempt at mapping the phase of the harmonic emission in two dimensions, called linked attosecond phase inter-ferometry (LAPIN), has been published [32]. This pioneering work based on the combination of TSI and gas mixing provides the phase difference with a reference gas, which allows performing molecular orbital tomography. Since it does not actually measure an absolute spectral phase variation, it does not give access to a reference-free fully consistent 2D map without relying on the theoretical knowledge of the spectral phase of the reference gas.
Here, we introduce a 2D cartography technique that measures the phase of the attosecond emission from aligned molecules across the macroscopic momentum space in two dimensions,φ(θ, hν). Our experimental arrangement, which combines RABBIT and TSI in the same experimental conditions, allows referencing the two sets of experimental results to one another and removes the need for arbitrary phase shifts. We demonstrate two ways to map the phase across a 2D space dubbed (i) combined harmonic attosecond spectroscopy by two-source EUV interferometry and RABBIT (CHASSEUR) and (ii) mixed approaches for the measurement of the total harmonic phases (MAMMOTH). CHASSEUR links every pair of coordinates of the macroscopic momentum space by one path only, whereas in MAMMOTH, the multiple connections between coordinates contained in the redundant information are combined using a Shack–Hartmann-like algorithm. In both cases and in contrast to techniques such as gas mixing [26] and transient grating [27], the sign of the resulting phase map defined asφ(θ, hν) − φ(θ0, hν0) is resolved. Below,
we describe the experimental setup, explain the CHASSEUR and MAMMOTH techniques, and qualify them in the case of the nitrogen molecule. The experimental results are compared to simulations based on the quantitative rescattering (QRS) theory [33,34], and reveal the interplay between structural and dynamical effects in the 20–40 eV spectral range.
2. PRINCIPLE OF 2D PHASE CARTOGRAPHY In our experimental setup for XUV phase cartography,the spectral variation of the phase is accessed by interference of two-photon
XUV-IR transitions in the ionization of a gas target (RABBIT electron interferometry). In the presence of a weak fundamental
beam, the photo-electron spectra resulting from the ionization of a rare gas target by a comb of odd harmonic orders emphasize side band peaks in between the harmonic peaks. The side bands are created by two-photon XUV-IR photoionization, through stimulated emission or absorption of an IR photon simultaneously to the absorption of an XUV photon. The group delay across the HHG spectra is revealed by analyzing the oscillations of the side bands’ amplitude resulting from the interference between the two photoionization paths as the delay between the XUV and IR beams is scanned. Control with subcycle precision over the delay between the XUV beam and an auxiliary IR beam (dress-ing beam) is achieved with a Mach–Zehnder-type holey-mirror interferometer (Fig.1).
The angular variation of the phase is accessed by optical
interfer-ence of the XUV beam with a referinterfer-ence XUV beam (TSI optical interferometry). It requires two phase-locked harmonic sources, the alignment of one of them with a second auxiliary IR beam (alignment beam), and the high stability of the far-field spatial interference pattern. Combining these two interferometry tech-niques raises a number of challenges, since they require, if not antagonistic, at least stringent conditions. The experimental setup relies on a phase plate mode-conversion approach [35]. First, a fiber-based mode filtering is used to clean up the laser beam spatial profile [36]. Second, a 0 −π phase plate is introduced in the gen-eration beam to convert it to a transverse electromagnetic mode (TEM01), thus creating two bright IR spots at focus, resulting in
two phase-locked harmonic sources [25]. The robustness of this approach is crucial in this experiment. This is the key to reaching interferometric stability in TSI, even starting from an annular beam for generation and placing the XUV photon spectrometer far downstream the sources, after an intermediate step of refocusing of the two XUV beams with a toroidal mirror. Furthermore, the phase relationship between the two IR spots at focus is not arbitrary: it is fixed toπ by the TEM01mode. In the nonlinear process, this phase
difference is multiplied by the harmonic orderq (odd) so that the
relative phase between the two harmonic beams isπ modulo 2π for all orders. The RABBIT trace, which provides the harmonic group delay, will thus be the same for the two harmonic sources that are reimaged in the time-of-flight magnetic bottle electron spectrometer (TOF-MBES) (for similar alignment conditions in the two sources). The high contrast of the oscillations in our measured total RABBIT trace confirms this point and ensures a meaningful spectral phase extraction. Finally, the electron and light interferometers being online, switching between them is straight-forward, and the RABBIT spectrograms and TSI optical fringe patterns can be recorded one after each other in a timely manner, so that the experimental conditions, in particular the driving laser intensity, stay identical.
3. RECONSTRUCTION OF BIDIMENSIONAL PHASE MAPS
CHASSEUR is the simplest way of combining RABBIT and TSI. When shining an alignment beam on one of the two har-monic sources, TSI gives access, for each harhar-monic order, to the phase differenceφ(θ, hν0) − φ(is o, hν0), where the unaligned
isotropic source serves as a reference. Then, the spectral varia-tion of the referenceφ(is o, hν) can be recovered by performing RABBIT on the two unaligned harmonic sources. As illustrated in Fig.2(a), this approach, where a single RABBIT spectrogram
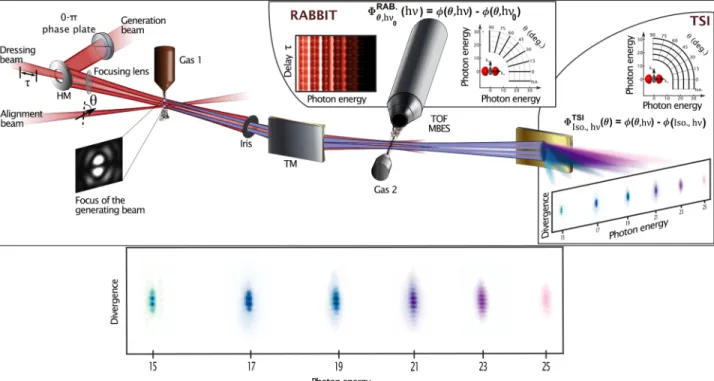
Fig. 1. Schematic layout of the experimental setup for 2D phase cartography based on a three-beam double interferometer. The IR generation beam is made annular by reflection off a holey-mirror (HM) and propagated through a 0 −π phase plate to create two bright spots at focus of a lens, inducing harmonic emission in gas jet 1. It is then filtered out with an iris. A first auxiliary IR beam (dressing beam) is propagated collinearly through the HM. It is sufficiently attenuated not to perturb harmonic emission in gas jet 1. A toroidal mirror (TM combined with a plane mirror, not shown) refocuses both the IR-dressing and XUV beams into the active region of a time-of-flight magnetic bottle electron spectrometer (TOF-MBES), inducing two-photon XUV-IR ionization of gas jet 2. The measurement of the photoelectron spectrum as a function of the XUV-IR delayτ (RABBIT) gives access to the spectral phase of the attosecond emission for a given alignment angle. A typical RABBIT trace is shown in the upper inset. For TSI, a second auxiliary IR beam (alignment beam) is overlapped with only one of the two harmonic sources, which is modified by the induced impulsive molecular alignment. The alignment angleθ is set by the IR beam polarization direction, controlled using a half-wave plate. In the far field, the different harmonic orders are spatially separated by means of a flat-field spectrometer and detected with micro-channel plates and a phosphor screen imaged with a charge-coupled device camera. The overlap between the beams originating from the two sources features a fringe pattern whose vertical position reflects the phase difference between the emission from the refer-ence and from the molecules aligned atθ for each harmonic order. A typical fringe pattern is shown in the lower inset.
and M TSI fringe patterns are recorded, offers a single way to reconstruct the 2D phase map. To go from one (θ1,hν1) point in
the macroscopic momentum space to (θ2,hν2) withθ1andθ2two
alignment angles andhν1andhν2two harmonic photon energies,
one first needs to move along a circle of constant energy using TSI measurements to connect to (iso,hν1), second, use the RABBIT
isotropic measurement to change the circle and get to (iso,hν2),
and finally again a TSI measurement to reach (θ2,hν2). We applied
CHASSEUR to the harmonic emission of the nitrogen molecule, serving as a test case to clarify the conflicting reported results [5,24,31]. Assembling the data according to the above procedure, we obtain the phase map reported in Fig.2(e) (for more details on the assembling procedure, seeSupplement 1).
MAMMOTH is a more advanced approach that requires, in addition to the M TSI fringe patterns, the measurement of N RABBIT traces for different alignment angles [Fig. 2(b)]. For these traces, the two sources are identically excited by overlapping the alignment pump with both of them. This is controlled by recording the intensity and phase contrast of the harmonics while scanning the delay between the alignment beam and the harmonic generation beam (more details inSupplement 1). When required, the pump beam diameter and energy are adjusted to maintain the same degree of alignment. This approach allows to completely double-map the macroscopic momentum space.
The redundant information on the phase resulting from this oversampling potentially generates millions of experimental phase maps since any pair of points in the macroscopic momentum space is now connected by an overwhelming number of paths [Fig.2(c)]. All these phase maps would be identical in the case of a perfect measurement with no error and no noise. Computing all the pos-sible phase maps generated by these paths is a rather demanding and inefficient task that can be avoided by looking at the double mapping from a different point of view. In optical metrology, Shack–Hartmann sensors [38] are used to reconstruct wavefronts by measuring phase derivatives along two orthogonal directions. In the same way, MAMMOTH measures the derivative of the phase map along two different dimensions. Following this idea, we developed an iterative algorithm reconstructing the most probable phase map behind the measurement of its derivative along the two dimensions (seeSupplement 1). The result is displayed in Fig.2(f ). Despite small differences, the phase maps presented in Figs.2(e) and2(f ) are remarkably similar. In addition, MAMMOTH offers information on the final error of the reconstruction. The low error obtained here is thus the first proof of consistency of the RABBIT and TSI results, and the demonstration of the validity of the proposed arrangement for XUV phase cartography.
On these two phase maps, all points are meaningful. In par-ticular, the sign of the phase is fully determined, in contrast to
Research Article Vol. 8, No. 3 / March 2021 / Optica 311
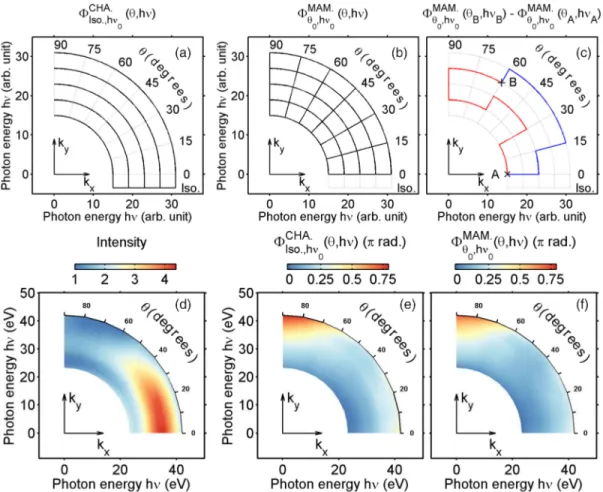
Fig. 2. Principles and results of the CHASSEUR and MAMMOTH techniques. (top row) The RABBIT technique gives access to the phase differ-ence between consecutive harmonic orders for a given angular distribution of molecules (sampling along the radial coordinate). TSI samples the phase of each harmonic order as a function of the molecule alignment angle (sampling along the angular coordinate). More details about RABBIT and TSI can be found inSupplement 1. (a) CHASSEUR principle. One RABBIT trace for the isotropic sample connects theM phase variations measured by TSI.
(b) MAMMOTH principle.N RABBIT spectrograms and M TSI fringe patterns form a double mapping of the phase over the macroscopic momentum
space. (c) With the MAMMOTH redundant mapping, a high number of paths connect any pair of points of the macroscopic momentum space. Here the red and blue paths are two arbitrary possibilities connecting A and B. (bottom row) Experimental map over the macroscopic momentum space of (d) harmonic intensity and phase of theN2emission (e) as measured following the CHASSEUR procedure and (f ) as reconstructed with the MAMMOTH procedure. The quadratic component of the phase along the spectral dimension induced by the EWP excursion in the continuum (related to the atto-chirp [37]) has been subtracted to highlight the structural/dynamical effects.
techniques such as gas mixing [26] and transient grating [27]. As detailed inSupplement 1, the very last arbitrary constant is the absolute group delay corresponding to a global linear spectral phase. This value was arbitrarily set to the one predicted by the QRS simulations presented below.
Another important difference from the gas mixing, transient grating, and LAPIN [32] techniques is that CHASSEUR is intrin-sically polarization resolved. Indeed, on one hand, TSI relies on interferences between an isotropic and an aligned harmonic source driven by a linearly polarized laser. While the former is fully sym-metric and emits harmonics that are linearly polarized along the polarization of the driving laser, the harmonics emitted from the latter can be elliptically polarized [39–42]. Only the component parallel to the driving field contributes to the measured fringe pattern. On the other hand, the only RABBIT measurement needed in CHASSEUR is taken for the harmonic emission from the unaligned sample that is linearly polarized. Therefore, the two techniques both provide the phase of the emission polarized along the polarization direction of the driving laser, allowing the measurements to be consistent. In the case of MAMMOTH,
although both polarizations could contribute to the RABBIT for aligned molecules, the p-polarized component is strongly
attenuated (one order of magnitude) by the reflections on the gold toroidal and plane mirrors (not shown in Fig.1for clarity) used to refocus the beam in the TOF-MBES, effectively making the MAMMOTH technique also polarization resolved. We note that the perpendicular component could also be accessed through the combined high-harmonic interferometries for vectorial spectros-copy (CHIVES) technique [42], and the complete polarization state, through the molecular polarimetry method [43].
4. DISCUSSION
To illustrate the power of this 2D cartography technique, we now use the phase maps to investigate the structural and dynamical effects in the HHG emission from nitrogen. The fact that the phase is measured along the two dimensions avoids normalization previously used in the literature, e.g., atθ = 90◦
for the angular measurements [4,31], or at harmonic orderq = 17 for the spectral
measurements [5,30]. Such normalization was artificially shifting the possible phase variations occurring at these reference positions
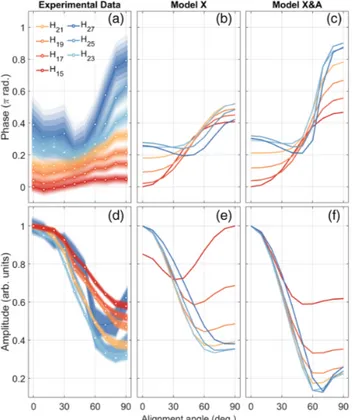
Fig. 3. Evidence of multichannel contributions in HHG from N2 at large angles and high orders. Phase (first row) and amplitude (second row) of the harmonic emission measured by [(a) and (d), respectively] CHASSEUR and [(b) and (e), resp.] predicted by QRS simulations for the X channel, and [resp., (c) and (f )] both X and A channels, for H15 (red) to H27 (dark blue). Clearly the X-only simulations do not allow to reproduce the experimental trends.
to other zones of the phase map, thus introducing disorder into the whole map. Instead, let us first consider the angular dependence of the phase of harmonics H15-27 obtained by CHASSEUR and shown in Fig.3(a). We observe a clear change in the angular dependence with increasing order. In particular, at high orders (H23-27), a minimum appears in the phase aroundθ = 40−50◦
followed by a marked phase jump from 50◦
to 90◦
whose mag-nitude increases with order. Note the significant ∼1 rad (0.35π) variation at 90◦
from H23 to H27, which should prevent from normalizing at this angle. These phase variations are associated with absolute intensity minima at 70◦for H25 and H27, coming
together with local maxima at 90◦
[Fig.3(d)]. Partial observation of these effects was previously interpreted as either a pure scattering effect in the recombination dipole matric element (DME) of the highest occupied molecular orbital (HOMO) [31], associated with the X ionization channel, or as the signature of a dynamical interference between the above channel and the one corresponding to HOMO-1 (second highest occupied orbital), associated with the A channel [3,5,20].
Our reference-free measurements provide valuable input to val-idate the refined theoretical models that are developed to describe the strong field laser–molecule interaction. At the same time, they give insight into multichannel dynamics in molecular HHG. To illustrate this, we here compare with the predictions of two basic models including either one or two channels within the frame of the QRS theory [30,34]. The molecular harmonic dipole is written as the coherent sum of the X and A channel contributions (seeSupplement 1):
DN2(θ) = DX(θ) + DA(θ)
=γX(θ)dX(θ)CX+γA(θ)ei18A−Xd
A(θ)CA. (1)
Each contribution is the product of the complex amplitudes reflecting the three-step emission process: the angle-resolved ion-ization ratesγX andγAtaken as first-order Legendre polynomials
[7,44], the auto-correlation functionsCX orCA accounting for
vibrations in the ion during the EWP excursion [30,45], and the DMEsdX ordA describing the recombination of the EWP with
the parent ion. The latter are computed using accurate scattering waves for the continuum states [46,47]. The spreading of the EWP is supposed to be identical in the high-harmonic plateau for both X and A channels. The phase difference accumulated by the EWP during the excursion time between the A and X channels is calcu-lated as1Ipτ, where Ipis the channel specific ionization potential,
andτ is the excursion time of the EWP. In Eq. (1), the spectral dependence is included indX,A,CX,A, and18A−X. In this model,
the influence of the laser field on recombination and the channel couplings [48] during ionization and continuum excursion are neglected. To account empirically for all the missing effects, a sin-gle adjustable parameter, namely, the ansin-gle-dependent ionization rate for channel A, is used. Finally, the molecular harmonic dipole
DN2(θ) is convoluted with the angular distribution induced by the
alignment laser beam. The different contributions are computed with the following experimental parameters: generation inten-sity 150 TW · cm−2, generation wavelength 800 nm, rotational
temperature of the gas jet 90 K, and impulsive alignment intensity 50 TW · cm−2.
The model including only the X channel [Figs.3(b) and3(e)] predicts very smooth amplitude and phase angular dependences that evolve slowly with harmonic order. It thus fails to reproduce the experimental trend observed for the high orders. Note that the QRS theory does not apply too close to the ionization threshold and is thus not expected to reproduce the behavior of low-order harmonics. The results of the X and A model presented in Figs.3(c) and 3(f ) show a much faster variation with harmonic order, including the gradual appearance of a dip in the phase around 50◦
followed by a strong phase jump and corresponding sharper amplitude minima. This qualitatively reproduces the experimental trends for both phases and amplitudes. This is an indication of the A-channel (HOMO-1) contribution at large angles (around 90◦
) and high orders, interfering with the X-channel (HOMO) con-tribution, which results in phase jumps and intensity minima in the harmonic emission. Indeed, as was already noticed [3,48,49], γA/γX is much less unfavorable to channel A contribution for
molecules aligned around 90◦
than around 0◦
. Another way to describe this multichannel interference is to consider that tunnel ionization from both HOMO and HOMO-1 orbitals creates a coherent superposition of the X and A ionic states associated with a hole in the molecular electron cloud. During the EWP excursion in the continuum, this hole moves from one side of the molecule to the other side and is probed at recombination. Our phase measure-ments are thus consistent with a multichannel dynamics associated with an attosecond hole migration, in agreement with the results reported in [5,30], and in contrast to the results obtained with transient alignment grating [31]. This can be explained by the fact that the 2D phase cartography approach: (i) does not require any arbitrary normalization and (ii) is polarization resolved. The agreement between the experimental results and the X and A model is still not perfect, which is due to the simplicity of the model and
Research Article Vol. 8, No. 3 / March 2021 / Optica 313
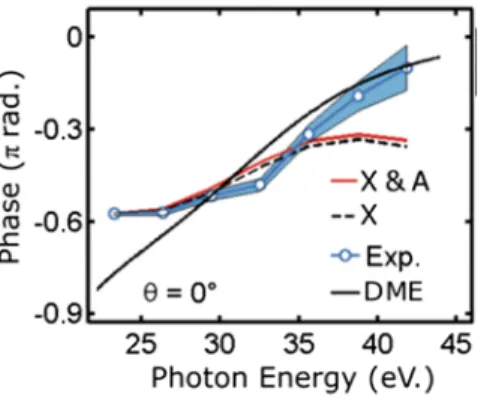
Fig. 4. Evidence of structural distortions in nitrogen harmonic emis-sion at 0◦
. Phase of theN2 harmonic emission measured forθ = 0◦by CHASSEUR (blue) and predicted by QRS simulations including both X and A channels (red) and only the X channel (black dashed line). DME is the phase of the dipole matrix element computed with the HOMO as ground state, and the accurate scattering wave-functions as continuum states, forθ = 0◦(i.e., not convoluted with the angular distribution). It exhibits a fast variation across the shape resonance centered at 30 eV.
points to the necessity of including more ionization channels as well as cross-channels [50,51].
To further illustrate the possibilities of the technique, let us now look in the spectral dimension atθ = 0◦
where the A-channel contribution is negligible due to its nodal plane. As shown in Fig.2(d), there is a strong intensity enhancement around H23 (34.5 eV) consistent with the presence of a shape resonance in the HOMO recombination DME [52–55]. The harmonic spectral phase for molecules aligned at 0◦
measured by CHASSEUR is shown in Fig.4. It increases steadily over the 20–40 eV range by a total amount of 0.5π. The X-channel model prediction repro-duces the phase increase with, however, some saturation at high orders, resulting in an overall qualitative agreement. The origin of the fast phase variation in this spectral region is to be found in the variation of the accurate HOMO scattering-wave DME at the angleθ = 0◦
, shown as solid line in Fig.4. We thus conclude that the phase variation measured at 0◦
is the signature of the HOMO shape resonance. This raises the question of whether the small deviations observed in Fig.4between experiment and theory are due to the influence of the laser field on the recombination process. This was invoked when harmonics were generated in the vicin-ity of resonances, either theoretically [56–60] or experimentally [61–63]. We performed a detailed theoretical study and found no influence of the laser field in our case (seeSupplement 1). Our results are consistent with the prediction in [57] that the signature of a spectrally broad enough resonance would not be affected by the laser field if its lifetime is much shorter than the laser period. The shape resonance inN2is about 5 eV broad corresponding to
a few hundreds of attosecond lifetime, to be compared with the 2.7 fs period of the Ti:sapphire laser. The deviation observed in Fig.4could rather be due to the recombination to the B channel (HOMO-2). Indeed, it has been predicted that, at low angles, the channel B contribution becomes particularly important [48,50] due to correlation driven tunneling [64].
5. CONCLUSION AND OUTLOOK
The 2D phase cartography presented and qualified here in nitro-gen allowed disentangling structural and dynamical effects that
had led to conflicting interpretations. It opens the road to high-resolution HHS for quantum orbital tomography or attosecond charge migration studies in molecules. In the case of a single ion-ization channel, the advanced characterion-ization of the spectral intensity and phase for a set of alignment angles in a tomographic way will give access to the molecular recombination dipole with high precision; this dipole can then be used to perform a quantum orbital reconstruction with Ångström spatial resolution. In the case of several ionization channels, the detailed amplitude and phase information will reveal the molecular-frame electronic dynamics with attosecond resolution; this is particularly rel-evant for the study of attosecond charge migration during strong field processes [65]. The relative simplicity of the CHASSEUR experimental scheme and the somewhat more complex imple-mentation of the MAMMOTH approach offer large degrees of versatility. This will allow for comprehensive studies exploring a broad range of laser parameters (pump–probe delays, wave-lengths, intensities, etc.) and a variety of larger systems that could be aligned along different internuclear axes. The molecular photo-excitation can also be extended from rotational to vibrational or dissociative wave packets, which could be studied through a phase map of the pump–probe trace in time and frequency. Finally, the CHASSEUR/MAMMOTH procedures give access to polarization-resolved phase maps of the attosecond emission, which is of crucial importance for accurate experimental studies. Phase cartography can be further extended to vectorial light char-acterization by combining with transient grating spectroscopy [42] or molecular polarimetry [43].
Funding. U.S. Department of Energy, Office of Science, Basic Energy Sciences, Chemical Sciences, Geosciences, and Biosciences Division (DE-AC02-05CH11231); Agence Nationale de la Recherche (ANR-10-LABX-0039-PALM, ANR-11-EQPX0005-ATTOLAB, ANR-15-CE30-0001-CIMBAAD); Marie Curie Intra European Fellowship (300685-MolWave); Marie Curie Initial Training Network (238362-ATTOFEL); COST (CA18222-AttoChem Action); Laserlab-Europe (EU-H2020 871124).
Acknowledgment. We thank Yann Mairesse, Hartmut Ruf, Amélie Ferré, and Julien Baudoin Bertrand for fruitful discussions and their help in setting up and developing the photon spectrometer.
Disclosures. The authors declare no conflicts of interest.
Supplemental document. SeeSupplement 1for supporting content.
REFERENCES
1. J. Itatani, J. Levesque, D. Zeidler, H. Niikura, H. Pépin, J. C. Kieffer, P. B. Corkum, and D. M. Villeneuve, “Tomographic imaging of molecular orbitals,”Nature432, 867–871 (2004).
2. S. Baker, J. S. Robinson, C. A. Haworth, H. Teng, R. A. Smith, C. C. Chiril ˘a, M. Lein, J. W. G. Tisch, and J. P. Marangos, “Probing proton dynamics in molecules on an attosecond time scale,”Science312, 424–427 (2006).
3. B. K. McFarland, J. P. Farrell, P. H. Bucksbaum, and M. Gühr, “High har-monic generation from multiple orbitals in n2,”Science322, 1232–1235
(2008).
4. O. Smirnova, Y. Mairesse, S. Patchkovskii, N. Dudovich, D. Villeneuve, P. Corkum, and M. Y. Ivanov, “High harmonic interferometry of multi-electron dynamics in molecules,”Nature460, 972 (2009). 5. S. Haessler, J. Caillat, W. Boutu, C. Giovanetti-Teixeira, T. Ruchon,
T. Auguste, Z. Diveki, P. Breger, A. Maquet, B. Carré, R. Taïeb, and P. Salières, “Attosecond imaging of molecular electronic wavepackets,”
Nat. Phys.6, 200–206 (2010).
6. D. Baykusheva, M. S. Ahsan, N. Lin, and H. J. Wörner, “Bicircular high-harmonic spectroscopy reveals dynamical symmetries of atoms and molecules,”Phys. Rev. Lett.116, 123001 (2016).
7. S. B. Schoun, A. Camper, P. Salières, R. R. Lucchese, P. Agostini, and L. F. DiMauro, “Precise access to the molecular-frame complex recom-bination dipole through high-harmonic spectroscopy,”Phys. Rev. Lett.
118, 033201 (2017).
8. D. Azoury, O. Kneller, M. Krüger, B. D. Bruner, O. Cohen, Y. Mairesse, and N. Dudovich, “Interferometric attosecond lock-in measurement of extreme-ultraviolet circular dichroism,”Nat. Photonics13, 198 (2019). 9. S. Ghimire, A. D. DiChiara, E. Sistrunk, P. Agostini, L. F. DiMauro, and
D. A. Reis, “Observation of high-order harmonic generation in a bulk crystal,”Nat. Phys.7, 138–141 (2010).
10. T. T. Luu, M. Garg, S. Y. Kruchinin, A. Moulet, M. T. Hassan, and E. Goulielmakis, “Extreme ultraviolet high-harmonic spectroscopy of solids,”Nature521, 498–502 (2015).
11. S. Ghimire and D. A. Reis, “High-harmonic generation from solids,”Nat. Phys.15, 10–16 (2019).
12. N. L. Wagner, A. Wüest, I. P. Christov, T. Popmintchev, X. Zhou, M. M. Murnane, and H. C. Kapteyn, “Monitoring molecular dynamics using coherent electrons from high harmonic generation,”Proc. Natl. Acad. Sci.103, 13279–13285 (2006).
13. A. Ferré, A. E. Boguslavskiy, M. Dagan, V. Blanchet, B. D. Bruner, F. Burgy, A. Camper, D. Descamps, B. Fabre, N. Fedorov, J. Gaudin, G. Geoffroy, J. Mikosch, S. Patchkovskii, S. Petit, T. Ruchon, H. Soifer, D. Staedter, I. Wilkinson, A. Stolow, N. Dudovich, and Y. Mairesse, “Multi-channel electronic and vibrational dynamics in polyatomic resonant high-order harmonic generation,”Nat. Commun.6, 5952 (2015). 14. H. J. Wörner, J. B. Bertrand, D. V. Kartashov, P. B. Corkum, and D. M.
Villeneuve, “Following a chemical reaction using high-harmonic interfer-ometry,”Nature466, 604–607 (2010).
15. H. J. Wörner, J. B. Bertrand, B. Fabre, J. Higuet, H. Ruf, A. Dubrouil, S. Patchkovskii, M. Spanner, Y. Mairesse, V. Blanchet, E. Mével, E. Constant, P. B. Corkum, and D. M. Villeneuve, “Conical intersection dynamics in no2probed by homodyne high-harmonic spectroscopy,” Science334, 208–212 (2011).
16. K. J. Schafer, B. Yang, L. F. DiMauro, and K. C. Kulander, “Above thresh-old ionization beyond the high harmonic cutoff,”Phys. Rev. Lett.70, 1599–1602 (1993).
17. P. B. Corkum, “Plasma perspective on strong field multiphoton ionization,”Phys. Rev. Lett.71, 1994–1997 (1993).
18. S. Haessler, W. Boutu, M. Stankiewicz, L. J. Frasinski, S. Weber, J. Caillat, R. Taïeb, A. Maquet, P. Breger, P. Monchicourt, B. Carré, and P. Salières, “Attosecond chirp-encoded dynamics of light nuclei,”J. Phys. B42, 134002 (2009).
19. C. Vozzi, M. Negro, F. Calegari, G. Sansone, M. Nisoli, S. De Silvestri, and S. Stagira, “Generalized molecular orbital tomography,”Nat. Phys.
7, 822–826 (2011).
20. Z. Diveki, R. Guichard, J. Caillat, A. Camper, S. Haessler, T. Auguste, T. Ruchon, B. Carré, A. Maquet, R. Taïeb, and P. Salières, “Molecular orbital tomography from multi-channel harmonic emission in n2,”Chem. Phys.
414, 121–129 (2013).
21. T. T. Gorman, T. D. Scarborough, P. M. Abanador, F. Mauger, D. Kiesewetter, P. Sàndor, S. Khatri, K. Lopata, K. J. Schafer, P. Agostini, M. B. Gaarde, and L. F. DiMauro, “Probing the interplay between geometric and electronic-structure features via high-harmonic spectroscopy,”J. Chem. Phys.150, 184308 (2019).
22. W. Boutu, S. Haessler, H. Merdji, P. Breger, G. Waters, M. Stankiewicz, L. J. Frasinski, R. Taïeb, J. Caillat, A. Maquet, P. Monchicourt, B. Carré, and P. Salières, “Coherent control of attosecond emission from aligned molecules,”Nat. Phys.4, 545–549 (2008).
23. X. Zhou, R. Lock, W. Li, N. Wagner, M. M. Murnane, and H. C. Kapteyn, “Molecular recollision interferometry in high harmonic generation,”
Phys. Rev. Lett.100, 073902 (2008).
24. R. M. Lock, X. Zhou, W. Li, M. M. Murnane, and H. C. Kapteyn, “Measuring the intensity and phase of high-order harmonic emission from aligned molecules,”Chem. Phys.366, 22–32 (2009), Attosecond Molecular Dynamics.
25. A. Camper, T. Ruchon, D. Gauthier, O. Gobert, P. Salières, B. Carré, and T. Auguste, “High-harmonic phase spectroscopy using a binary diffrac-tive optical element,”Phys. Rev. A89, 043843 (2014).
26. B. K. McFarland, J. P. Farrell, P. H. Bucksbaum, and M. Gühr, “High-order harmonic phase in molecular nitrogen,”Phys. Rev. A80, 033412 (2009).
27. Y. Mairesse, N. Dudovich, D. Zeidler, M. Spanner, D. M. Villeneuve, and P. B. Corkum, “Phase sensitivity of high harmonic transient grating spec-troscopy,”J. Phys. B43, 065401 (2010).
28. H. J. Wörner, J. B. Bertrand, P. Hockett, P. B. Corkum, and D. M. Villeneuve, “Controlling the interference of multiple molecular orbitals in high-harmonic generation,”Phys. Rev. Lett.104, 233904 (2010). 29. R. Torres, T. Siegel, L. Brugnera, I. Procino, J. G. Underwood, C. Altucci,
R. Velotta, E. Springate, C. Froud, I. C. E. Turcu, S. Patchkovskii, M. Y. Ivanov, O. Smirnova, and J. P. Marangos, “Revealing molecular structure and dynamics through high-order harmonic generation driven by mid-IR fields,”Phys. Rev. A81, 051802 (2010).
30. Z. Diveki, A. Camper, S. Haessler, T. Auguste, T. Ruchon, B. Carré, P. Salières, R. Guichard, J. Caillat, A. Maquet, and R. Taïeb, “Spectrally resolved multi-channel contributions to the harmonic emission in n2,” New J. Phys.14, 023062 (2012).
31. A. Rupenyan, J. B. Bertrand, D. M. Villeneuve, and H. J. Wörner, “All-optical measurement of high-harmonic amplitudes and phases in aligned molecules,”Phys. Rev. Lett.108, 033903 (2012).
32. J. B. Bertrand, H. J. Wörner, P. Salières, D. M. Villeneuve, and P. B. Corkum, “Linked attosecond phase interferometry for molecular frame measurements,”Nat. Phys.9, 174–178 (2013).
33. A.-T. Le, R. R. Lucchese, S. Tonzani, T. Morishita, and C. D. Lin, “Quantitative rescattering theory for high-order harmonic generation from molecules,”Phys. Rev. A80, 013401 (2009).
34. A.-T. Le, R. R. Lucchese, and C. D. Lin, “Quantitative rescattering theory of high-order harmonic generation for polyatomic molecules,”Phys. Rev. A87, 063406 (2013).
35. A. Camper, A. Ferré, N. Lin, E. Skantzakis, D. Staedter, E. English, B. Manschwetus, F. Burgy, S. Petit, D. Descamps, T. Auguste, O. Gobert, B. Carré, P. Salières, Y. Mairesse, and T. Ruchon, “Transverse electromag-netic mode conversion for high-harmonic self-probing spectroscopy,”
Photonics2, 184–199 (2015).
36. B. Mahieu, D. Gauthier, M. Perdrix, X. Ge, W. Boutu, F. Lepetit, F. Wang, B. Carré, T. Auguste, H. Merdji, D. Garzella, and O. Gobert, “Spatial qual-ity improvement of a Ti:sapphire laser beam by modal filtering,”Appl. Phys. B118, 47–60 (2015).
37. Y. Mairesse, A. de Bohan, L. J. Frasinski, H. Merdji, L. C. Dinu, P. Monchicourt, P. Breger, M. Kova ˇcev, R. Taeb, B. Carré, H. G. Muller, P. Agostini, and P. Salières, “Attosecond synchronization of high-harmonic soft x-rays,”Science302, 1540–1543 (2003).
38. B. Platt and R. V. Shack, “History and principles of Shack-Hartmann wavefront sensing,”J. Refract. Surg.17, S573–S577 (2001).
39. J. Levesque, Y. Mairesse, N. Dudovich, H. Pépin, J.-C. Kieffer, P. B. Corkum, and D. M. Villeneuve, “Polarization state of high-order har-monic emission from aligned molecules,”Phys. Rev. Lett.99, 243001 (2007).
40. X. Zhou, R. Lock, N. Wagner, W. Li, H. C. Kapteyn, and M. M. Murnane, “Elliptically polarized high-order harmonic emission from molecules in linearly polarized laser fields,”Phys. Rev. Lett.102, 073902 (2009). 41. Y. Mairesse, S. Haessler, B. Fabre, J. Higuet, W. Boutu, P. Breger, E.
Constant, D. Descamps, E. Mével, S. Petit, and P. Salières, “Polarization-resolved pump–probe spectroscopy with high harmonics,”New J. Phys.
10, 025028 (2008).
42. A. Camper, A. Ferré, V. Blanchet, F. Burgy, D. Descamps, S. Petit, T. Ruchon, and Y. Mairesse, “Combined high-harmonic interferometries for vectorial spectroscopy,”Opt. Lett.40, 5387–5390 (2015).
43. L. Barreau, K. Veyrinas, V. Gruson, S. J. Weber, T. Auguste, J.-F. Hergott, F. Lepetit, B. Carré, J.-C. Houver, D. Dowek, and P. Salières, “Evidence of depolarization and ellipticity of high harmonics driven by ultrashort bichromatic circularly polarized fields,”Nat. Commun.9, 4727 (2018). 44. D. Pavi ˇci ´c, K. F. Lee, D. M. Rayner, P. B. Corkum, and D. M. Villeneuve,
“Direct measurement of the angular dependence of ionization for n2, O2,
and CO2in intense laser fields,”Phys. Rev. Lett.98, 243001 (2007).
45. S. Patchkovskii, “Nuclear dynamics in polyatomic molecules and high-order harmonic generation,”Phys. Rev. Lett.102, 253602 (2009). 46. R. E. Stratmann and R. R. Lucchese, “A graphical unitary group
approach to study multiplet specific multichannel electron correlation effects in the photoionization of O2,”J. Chem. Phys.102, 8493–8505
(1995).
47. R. E. Stratmann, R. W. Zurales, and R. R. Lucchese, “Multiplet-specific multichannel electron-correlation effects in the photoionization of NO,”
J. Chem. Phys.104, 8989–9000 (1996).
48. Y. Mairesse, J. Higuet, N. Dudovich, D. Shafir, B. Fabre, E. Mével, E. Constant, S. Patchkovskii, Z. Walters, M. Y. Ivanov, and O. Smirnova, “High harmonic spectroscopy of multichannel dynamics in strong-field ionization,”Phys. Rev. Lett.104, 213601 (2010).
Research Article Vol. 8, No. 3 / March 2021 / Optica 315 49. S. Petretti, Y. V. Vanne, A. Saenz, A. Castro, and P. Decleva,
“Alignment-dependent ionization of n2, O2, and CO2in intense laser fields,”Phys. Rev. Lett.104, 223001 (2010).
50. Y. Xia and A. Jaro ´n-Becker, “Multielectron contributions in elliptically polarized high-order harmonic emission from nitrogen molecules,”Opt. Lett.39, 1461–1464 (2014).
51. O. Smirnova and M. Ivanov, Multielectron High Harmonic Generation: Simple Man on a Complex Plane (Wiley, 2014), pp. 201–256, Chap. 7. 52. J. B. Bertrand, H. J. Wörner, P. Hockett, D. M. Villeneuve, and P. B.
Corkum, “Revealing the cooper minimum of n2 by molecular frame
high-harmonic spectroscopy,”Phys. Rev. Lett.109, 143001 (2012). 53. J. L. Dehmer, D. Dill, and S. Wallace, “Shape-resonance-enhanced
nuclear-motion effects in molecular photoionization,”Phys. Rev. Lett.
43, 1005–1008 (1979).
54. C. Jin, J. B. Bertrand, R. R. Lucchese, H. J. Wörner, P. B. Corkum, D. M. Villeneuve, A.-T. Le, and C. D. Lin, “Intensity dependence of multiple orbital contributions and shape resonance in high-order harmonic generation of aligned n2molecules,”Phys. Rev. A85, 013405 (2012).
55. ß, X. Ren, V. Makhija, A.-T. Le, J. Tro, S. Mondal, C. Jin, V. Kumarappan, and C. Trallero-Herrero, “Measuring the angle-dependent photoioniza-tion cross secphotoioniza-tion of nitrogen using high-harmonic generaphotoioniza-tion,”Phys. Rev. A88, 043421 (2013).
56. V. Strelkov, “Role of autoionizing state in resonant high-order harmonic generation and attosecond pulse production,”Phys. Rev. Lett.104, 123901 (2010).
57. M. Tudorovskaya and M. Lein, “High-order harmonic generation in the presence of a resonance,”Phys. Rev. A84, 013430 (2011).
58. M. V. Frolov, N. L. Manakov, T. S. Sarantseva, and A. F. Starace, “Analytic confirmation that the factorized formula for harmonic generation
involves the exact photorecombination cross section,”Phys. Rev. A
83, 043416 (2011).
59. F. Risoud, M. Lévêque, C. Labeye, J. Caillat, A. Maquet, P. Salières, R. Taïeb, and T. Shaaran, “Laser-induced blurring of molecular structure information in high harmonic spectroscopy,”Sci. Rep.7, 17302 (2017). 60. M. Labeye, F. Risoud, C. Lévêque, J. Caillat, A. Maquet, T. Shaaran, P.
Salières, and R. Taïeb, “Dynamical distortions of structural signatures in molecular high-order harmonic spectroscopy,”Phys. Rev. A99, 013412 (2019).
61. A. D. Shiner, B. E. Schmidt, C. Trallero-Herrero, H. J. Wörner, S. Patchkovskii, P. B. Corkum, J.-C. Kieffer, F. Légaré, and D. M. Villeneuve, “Probing collective multi-electron dynamics in xenon with high-harmonic spectroscopy,”Nat. Phys.7, 464–467 (2011).
62. J. Rothhardt, S. Hädrich, S. Demmler, M. Krebs, S. Fritzsche, J. Limpert, and A. Tünnermann, “Enhancing the macroscopic yield of narrow-band high-order harmonic generation by Fano resonances,”Phys. Rev. Lett.
112, 233002 (2014).
63. S. Haessler, V. Strelkov, L. B. E. Bom, M. Khokhlova, O. Gobert, J.-F. Hergott, F. Lepetit, M. Perdrix, T. Ozaki, and P. Salières, “Phase dis-tortions of attosecond pulses produced by resonance-enhanced high harmonic generation,”New J. Phys.15, 013051 (2013).
64. L. Torlina, M. Ivanov, Z. B. Walters, and O. Smirnova, “Time-dependent analytical r-matrix approach for strong-field dynamics. II. Many-electron systems,”Phys. Rev. A86, 043409 (2012).
65. P. M. Kraus, B. Mignolet, D. Baykusheva, A. Rupenyan, L. Horný, E. F. Penka, G. Grassi, O. I. Tolstikhin, J. Schneider, F. Jensen, L. B. Madsen, A. D. Bandrauk, F. Remacle, and H. J. Wörner, “Measurement and laser control of attosecond charge migration in ionized iodoacetylene,”