OATAO is an open access repository that collects the work of Toulouse
researchers and makes it freely available over the web where possible
Any correspondence concerning this service should be sent
to the repository administrator:
[email protected]
This is an author’s version published in:
http://oatao.univ-toulouse.fr/25059
To cite this version:
Murat, Pauline
and Ferret, Pierre-Jacques and Coslédan, Sylvie and Simon,
Valérie
Assessment of targeted non-intentionally added substances in cosmetics
in contact with plastic packagings. Analytical and toxicological aspects. (2019)
Food and Chemical Toxicology, 128. 106-118. ISSN 0278-6915
Assessment of targeted non-intentionally added substances in cosmetics in
contact with plastic packagings. Analytical and toxicological aspects
Pauline Murat
3•\
Pierre-Jacques Ferret
C,
Sylvie Coslédan
3•
*
, Valérie Simon
b•chbnte Analytlquut Conpatlbiiité, Pierre fubre Denno-Cosmétique, 17 Allée CanUie Soulo, 31320, Vlgi>ulet-Aw;U, Franœ b Laboratoire de Chbnie AtTO-ln<fustmlle (LCA), Univenlli de Toulouse, INRA, INPT, Toulouse, Prome
• Sécll'lti Proœdts et Cosméti,vlt)lance, Pinre Fabre Dermo-Cosmél14ue, 3 Avenue Hwm Curie1!, 3103S, Toulouse Cedex, Prome
ARTIC L E INFO A BSTRACT
Keywords:
Container-content Interactions Non-lntentionally added substances
Gas chromatography-mass spectrometry Paclœging
Cosmetlcs Safety assessment
Container-content interactions are common in the food and pharmaceutical industries. However, these studies are more complicated in the cosmetic industry, and it is necessary to ensure consumer safety. The objective of this work was to develop a strategy for the toxicological evaluation of leachables for cosmetic packagings. Eleven common plastic packagings were selected to evaluate interactions with 5 simulants (acidic, alkaline and neutral water, 30% and 96% ethanol) chosen to mimic cosmetics behavior. A GC-MS method was developed to screen for 12 non-intentionally added substances of particular concern: 10 phthalates, bisphenol A and distearyl thiodipropionate (European Pharmacopoeia plastic additive 17). Results were analyzed using a toxicological procedure established for this study. Sorne phthalates and bisphenol A were detected in several samples, but only one contaminant, diisobutyl phthalate (DiBP), was found to be above the set concentration threshold. Using toxicological data, this concentration was found to be safe for users. 96% ethanol appeared to be the strongest simulant in term of extraction, with a maximum concentration of 491 µg/L for DiBP in a 100% styrene--acry lonitrile copolymer packaging. In water simulants, Jess contaminants were extracted, with concentrations under 20µg/L.
1. Introduction
Packaging in cosmetics plays an important role firstly for marketing purposes and secondly, and most importantly, for product protection against light or microbiological contamination. The complexity in de veloping a new packaging relies on the choice of the manufacturing material to have specific properties to achieve its desired functionality in the final type of container. Type of container also has an influence on the ease of use as well as on consumer safety through delivered dose (Gomez Berrada et al., 2017). A special consideration has to be taken with the different interactions that can exist between the content and packaging more commonly named as container content interactions (CCO. CCI studies are common in the food and pharmaœutical in dustries. They highlight the possible migration of molecules from the packaging to the product, which may impact the product quality, effi cacy and consumer safety. European legislation has published regula tions to define these studies: the European Pharmacopoeia (European Directorate for the Quality of Medicines & HealthCare (EDQM), 2013) for the pharmaceutical industry, regulation EC n•20171745 for medical devices (European Parliament and Council of the European Union,
• Corresponding author.
E-mail address: [email protected] (S. Cœlédan).
2017) and food regulations CE n•10;2011 (European Commission, 2011) and EC n•2018/213 (European Commission, 2018, p. 213) for the food and food contact packaging industries. The cosmetic industry is also conœmed via cosmetic regulation EC n•1223;2009 (European Parl iament and Council of the European Union, 2009). However, in contrast to the two other legislations, titis document does not provide thresholds concerning authorized migration limits such as specific mi gration limits. The only information available for CCI studies are a list of prohibited substances and Article 17 stating that "the non intended presenœ of a small quantity of a prohibited substance, stemming from impurities of natural or synthetic ingredients, the manufacturing pro cess, storage, migration from packaging, which is technically un avoidable in good manufacturing practiœ, shall be permitted provided that such presence is in conformity with Article 3". Article 3 states that "a cosmetic product made available on the market shall be safe for human health [ ... )". Certain substances are so prohibited when they are deliberately introduced but can be tolerated if they are proved to be non intentionally added and unavoidable. Annex 1 also attests that the cosmetic product safety report must contain information on impurities, traces and other pertinent facts concerning the packaging material
(purity, stability, etc.). The absence of threshold values and standar dized protocols complicates the CCI studies in the cosmetic industry. Nevertheless, CCI studies are legitimate to ensure consumer safety and
product conformity and are of increasing interest in thisfield (Charron
et al., 2018).
More than 30% of worldwide plastic production is used for dis
posable packagings (Thompson et al., 2009). Plastics are the choice
materials for packagings because of their ease of use, lightness and low
cost. There are more than 30 different plastics used as packaging ma
terials. Moreover, additives are added to plastics to give them specific
properties such as greater softness,flexibility or resistance (Bradley and
Coulier, 2007; Cao, 2008;Thompson et al., 2009). Additives can be, among others, plasticizers, UV absorbers, antioxidants, dyes or lu
bricants (Bi et al., 2013; García Ibarra et al., 2018; Lau and Wong,
2000). Because they are not chemically bound to the polymer, they can
migrate from the container to the content (Fasano et al., 2012;Gimeno
et al., 2012;Hahladakis et al., 2018) and are consequently considered as potential leachables.
Leaching consists of the migration of a compound from the con tainer to its content in normal conditions (leachables) of use or in ex treme conditions (extractables). Thus, leachables and extractables can be additives but also non intentionally added substances (NIAS)
(Bignardi et al., 2017;Muncke, 2011). NIAS are compounds that are
present in a packaging material but do not have been added for a technical reason. They can be impurities, degradation products or also
environmental contaminants (Bach et al., 2012;Lau and Wong, 2000;
Nerin et al., 2013).
CCI studies are carried out to monitor leachables and represent important challenges for industries. Trace levels of leachables in com
plex matrices present a first difficulty in their evaluation. Diesters of
1,2 benzenedicarboxylic acid, commonly known as phthalates, are man made substances mostly used as plasticizers in plastic materials in
order to improve theirflexibility (Meeker et al., 2009;Net et al., 2015).
They can also be found as impurities in raw materials and can so be
considered as NIAS. Used since the 1920s (Net et al., 2015), they have
recently come under the spotlight because of their potential hazards and suspected toxicological risks to human health. Indeed, studies have proved that some were endocrine disrupters and/or CMR chemicals (Fabjan et al., 2006; Meeker et al., 2009). Bisphenol A (2,2′ bis(4
hydroxyphenyl)propane) is also known to be an endocrine disruptor and is used predominantly as a starting material to make plastics (Careghini et al., 2015). In Europe, it is prohibited in cosmetic products
(European Parliament and Council of the European Union, 2009) and
limited in food products (European Commission, 2018, p. 213). Dis
tearyl thiodipropionate is also restricted in Regulation CE N°10/2011 concerning plastic materials intended to come into contact with food;
and identified as the seventeenth plastic additive of European Phar
macopoeia (Council of Europe and European Directorate for the Quality
of Medicines & HealthCare (EDQM), 2010).
Measuring trace levels of contaminants is a real challenge for ana lysts, because of the need to attain very low detection and/or quanti fication limits (In the order of μg/L or mg/L). Therefore, gas chroma
tography mass spectrometry (GC MS) is often used in CCI studies for
its sensitivity, in food (Amiridou and Voutsa, 2011;Cacho et al., 2012;
Casajuana and Lacorte, 2004;Fasano et al., 2012;Fierens et al., 2012;
Guo et al., 2012), pharmaceutical (Gimeno et al., 2014;Jenke et al., 2013;Pan et al., 2008;Roberts et al., 2016) and cosmetic (Chen et al., 2005;Gimeno et al., 2012;Guo and Kannan, 2013;Shen et al., 2007;
Thomas et al., 2014) studies. Liquid chromatography is also used,
whether it is with UV,fluorescence (Cirillo et al., 2015;Feng and Jiang,
2012; Jenke et al., 2013; Viñas et al., 2015) or mass spectrometric
detection (Ferrer et al., 2011;Lateef, 2016;Viñas et al., 2015;Zhang
et al., 2016).
Toxicological evaluations are quite complex in the cosmetic in dustry because of the prohibition of tests on animals since 2009. Plastic materials can contain potentially dangerous substances, such as ad ditives, monomers or NIAS, and toxicologists are responsible for the packaging risk evaluation according to Regulation CE N°1223/2009. Adapted strategies must be developed to overcome these risks and to highlight the importance of controlling cosmetic packagings and their potential contaminants.
Food packagings are prone to leach different types of contaminants depending on the type of food they contain, the temperature, the time
of contact; the conditioning surface/volume ratio… In order to avoid
the difficulty of analyzing food directly, strategies using simulants have
been developed (Bi et al., 2013;Cacho et al., 2012;Fasano et al., 2012)
and are listed in the EC 10/2011 ((European Commission, 2011)). Si
mulants consist of simple matrices such as water, ethanol, olive oil or Abbreviations
(r)PET (recycled) PE terephthalate
ADD17 Distearyl thiodipropionate (European Pharmacopoeia
plastic additive n°17)
BBP benzylbutyl phthalate
BMD benchmark dose
BPA bisphenol A
CCI container content interactions
CMR carcinogenic, mutagenic and reprotoxic (substances)
COEX coextruded
DEHP diethylhexyl phthalate
DEP diethyl phthalate
DHP dihexyl phthalate
DiBP diisobutyl phthalate
DiPP diisopentyl phthalate
DMEP bis(2 methoxyethyl) phthalate
DnBP di n butyl phthalate
DNEL derived no effect level
DnPP di n pentyl phthalate
EFSA European Food Safety Authority
EVOH ethylene vinyl alcohol
GC gas chromatography
HDPE high density PE
IS internal standard
LLDPE linear low density PE
LOD limit of detection
LOQ limit of quantification
MoS margin of safety
MS mass spectrometry
ND not detected (below the LOD)
NIAS non intentionally added substances
NOAEL no observed adverse effect limit
PE polyethylene
PI packaging item
PiPP n pentyl isopentyl phthalate
PP polypropylene
REACH Registration, Evaluation, Authorization and Restriction of
Chemicals
RfD reference dose
SAN styrene acrylonitrile copolymer
SCCS Scientific Committee on Consumer Safety
SED systemic exposure dose
TDI tolerable daily intake
TTC threshold of toxicological concern
US EPA United States Environmental Protection Agency
UV ultra violet
Diisopentyl phthalate (DiPP, 98%) and n pentyl isopentyl phthalate
(PiPP, 99.0% mixed of isomers) were obtained from Euromedex
(Souffelweyersheim, France). n Octadecane (≥99.0%) and absolute
ethanol came from VWR (Fontenay sous Bois, France) and heptane (99%) from Carlo Erba (Val de Reuil, France).
For simulants, ethanol (96%) was purchased from Cristalco
(Chateaubriand, France). Citric acid (≥99.5%) was purchased from
Sigma Aldrich (St. Quentin Fallavier, France). Disodium hydrogen phosphate dihydrate (≥99.5%) and sodium hydroxide (1M) were ob
tained from VWR (Fontenay sous Bois, France). Purified water was
obtained from a Merck Millipore Milli Q system (Millipore, Bedford, MA, USA). Physical chemical properties, toxicological and regulatory information and the intended use of the studied substances are de
scribed inTable 2.
2.3. Migration tests
In the food industry, different simulants are used to mimic contact
with different foods. For example, vegetable oil is used to simulate li
pophilic products, and acetic acid 3% (w/v) hydrophilic foods
(European Commission, 2011). This strategy may also be used for
cosmetic studies with an adaptation of the simulants used to mimic cosmetic products. The aim of this method is to define representative
simulants capable of creating“worse case” situations. A large number
of cosmetics are oil in water emulsions. In these products, the con tinuous phase exposed to migration is predominantly aqueous. There fore, water is a useful simulant for cosmetics. In order to be more ac curate, three types of water were used: acidic, neutral and alkaline. Acidic water was prepared with citric acid and disodium hydrogen
phosphate dihydrate (pH≃ 4). Alkaline water was prepared with so
dium hydroxide solution (pH≃ 11). Demineralized water was used as
the neutral water simulant (pH≃ 7).
Cosmetic products can also contain alcohol. It is often the case with
acne, hairfixative or fine fragrance products. To simulate these cate
gories of products, ethanol was used at two different concentrations:
96% for products with a high concentration in alcohol and 30% for products with a lower concentration. 96% Ethanol was chosen on the basis of previous experiments performed in the laboratory that showed a higher tendency of most of the studied compounds to migrate to it. Ethanol 30% was also studied in order to control the action of the combination water/ethanol in proportion closer to real cosmetic pro ducts.
Studied packagings were filled with the different simulants.
Volumes were measured with glass measuring cylinders. The bottles were closed by screwing or clipping their respective caps whereas tubes
werefilled by the top and thermally sealed.
Code Material Appearance Volume (mL) Shape and type Closing system
Theoretical surface in contact with the cosmetic product (cm2)
Surface/volume ratio
PI1 100% PET Clear, colorless 100 Elliptical bottle Cap 124 0.91
PI2 100% PET Clear, colorless 100 Cylindrical bottle Cap 115 0.90
PI3 50% PET/50% rPET Clear, light yellow 200 Elliptical bottle Cap 209 0.90
PI4 100% PP Opaque, white 500 Elliptical bottle Pump 362 0.89
PI5 100% PP Opaque, dark green 600 Cylindrical bottle Pump 396 0.86
PI6 100% SAN Opaque, white 15 Cylindrical bottle Pump 63 1
PI7 100% HDPE Opaque, white 100 Cylindrical bottle Cap 112 0.89
PI8 70% LLDPE/30% XLDPE Opaque, white 40 Cylindrical tube Cap 60 1
PI9 COEX 70% LLDPE/30% XLDPE//EVOH
Opaque, white 50 Cylindrical tube Cap 61 1
PI10 COEX 70% LLDPE/30% XLDPE//EVOH
Opaque, white 50 Cylindrical tube Cap 66 1
PI11 70% HDPE/30% LLDPE Opaque, white 40 Cylindrical tube Cap 59 1
PI: packaging item; rPET: recycled PET; HDPE: high density PE; LLDPE: low linear density PE; XLDPE: cross-linked low-density PE; COEX: coextruded; EVOH: Ethylene vinyl alcohol.
alternative simulants and are mimicking the food behavior inside the container. They are easier to analyze, often after an extraction step. In
the pharmaceutical industry, simulants can be used too (Jenke et al.,
2005; Roberts et al., 2016) but case by case studies are often made on
each packaging/product couple (Zhang et al., 2016).
The aim of this work was to study selected NIAS based on a pre established list of potential toxic risks. Inspired by food and pharma ceutical works, a case study is presented in which 11 potential cosmetic packagings are evaluated and their leachables analyzed using a GC MS method developed to screen for 10 phthalates (including 9 that are regulated in Europe: benzylbutyl phthalate (BBP), di n butylphthalate (DnBP), diethylhexyl phthalate (DEHP), diisobutyl phthalate (DiBP), bis(2 methoxyethyl) phthalate (DMEP), di n pentyl phthalate (DnPP), dihexyl phthalate (DHP), diisopentyl phthalate (DiPP) and n pentyl isopentyl phthalate (PiPP)), bisphenol A and distearyl thiodipropionate (European Pharmacopoeia plastic additive 17) which is regulated by
the Regulation CE n°10/2011 (European Commission, 2011). All of
these substances are of particular toxicological concern (Thompson
et al., 2009).
2. Materials and methods 2.1. Selected packagings
Eleven common cosmetic packagings made up of polyethylene ter ephthalate (PET), polyethylene (PE), polypropylene (PP) and styrene acrylonitrile copolymer (SAN) were selected from different European suppliers. For three materials (100% PET, 100% PP and COEX 70% PEBDL/30% PEBDR), two sources of packagings were purchased in order to compare the differences between packagings made up of the same materials but originating from different suppliers.
Descriptions of each item are given in Table 1. The surface in con
tact with the product is calculated according to the shape. This surface corresponds to the surface in contact with the cosmetic formula in a
marketed product (i.e. at the filling volume indicated in Table 1).
2.2. Chemicals and reagents
For reference standards, benzylbutyl phthalate (BBP, 98%), di n butylphthalate (DnBP, 99%), diethylhexyl phthalate (DEHP, 99.7%), diethyl phthalate (DEP, 99.5%), diisobutyl phthalate (DiBP, 99%), bis (2 methoxyethyl) phthalate (DMEP, 98.9%), di n pentyl phthalate (DnPP, ≥99.0%), dihexyl phthalate (DHP, ≥99.0%), bisphenol A (BPA, ≥99%), distearyl thiodipropionate (ADD17, European Pharmacopoeia Reference Standard) and 4,4′ dibromobiphenyl (98%) were purchased from Sigma Aldrich (St. Quentin Fallavier, France).
Table 1
Table 2 Physico-chemical characteristics of targeted compounds. Compound Abbreviation CAS number Molar mass (g/mol) Structure Solubility Boiling point (Physical state) Toxicological risk a Use European legislation m/z ratios (Stock solution n°) Benzylbutyl phthalate BBP 85-68-7 312.37 Water: 2.69 mg/L (25 °C) (1) Soluble in ethanol (2) 370 °C (1) (L) R1B Endocrine disruptor Plasticizer (softener) of PVC or other polymers, in sealants, adhesives, paints, inks and lacquers (3) CE n°10/2011: SML = 30 mg/kg + restrictions CE n°1223/2009: prohibited 91; 104; 149; 150; 206 (solution n°2) Di-n-butyl phthalate DnBP 84-74-2 278.35 Water: 11.2 mg/L (25 °C) (1) Very soluble in alcohol (4) 340 °C (1) (L) R1B Endocrine disruptor Plasticizer, solvent for oil-soluble dyes, insecticides and other organics, antifoam agent, textile fi ber lubricant, fragrance fi xative, insect repellent (4) CE n°10/2011: SML = 0.3 mg/kg + restrictions CE n°1223/2009: prohibited 104; 149; 150; 205; 223 (solution n°2) Diethylhexyl phthalate DEHP 117-81-7 390.57 Water: 0.34 mg/L (25 °C) (1) Soluble in ethanol (2) 384 °C (1) (L) R1B Endocrine disruptor Plasticizer in PVC applications and fl exible vinyls (4) CE n°10/2011: SML = 1.5 mg/kg + restrictions CE n°1223/2009: prohibited 71; 149; 150; 167; 279 (solution n°1) Diethyl phthalate DEP 84-66-2 222.24 Water: 1080 mg/L (25 °C) (1) Miscible with alcohol (4) 295 °C (1) (L) Endocrine disruptor Manufacturing celluloid, solvent for cellulose acetate in manufacturing varnishes and dopes, denaturing alcohol, Vehicle for fragrance and cosmetic ingredients (4) – 76; 105; 149; 150; 177 (solution n°2) Di-isobutyl phthalate DiBP 84-69-5 278.35 Water: 20.3 mg/L (20 °C) (1) Soluble in ethanol (2) 297 °C (1) (L) R1B Plasticizer for nitrocellulose, cellulose ether, polyacrylate and polyacetate dispersions. Gelling aid in combination with other plasticizers used for plastic, lacquers, adhesives, explosive material and nail polish (5) Absent from CE n°10/2011: prohibited CE n°1223/2009: prohibited 76; 104; 149; 150; 167; 223 (solution n°1) Diisopentyl phthalate DiPP 605-50-5 306.40 Insoluble in water (4) Very soluble in ethanol (6) 339 °C (7) (L) R1B Plasticizer for nitrocellulose and resin lacquers, preventing foam in manufacturing of glue, in rubber cements (8) CE n°1223/2009: prohibited 71; 104; 149; 237 (solution n°2) Bis(2-methoxyethyl) phthalate DMEP 117-82-8 282.30 Water: 8500 mg/L (25 °C) (1) Soluble in ethanol (2) 340 °C (1) (L) R1B Plasticizer in the production of nitrocellulose, acetyl cellulose, polyvinyl acetate, polyvinyl chloride and polyvynilidene chloride. Solvent, enameled wire, fi lm, high-strength varnish and adhesive, in pesticides (8) CE n°1223/2009: prohibited 59; 104; 149; 207; 281 (solution n°1) Di-n-pentyl phthalate DnPP 131-18-0 306.41 Water: 0.189 mg/L (25 °C) (1) Soluble in ethanol (2) 342 °C (9) (L) R1B Plasticizer in polyvinyl chloride (9) Absent from CE n°10/2011: prohibited (10) CE n°1223/2009: prohibited 104; 149; 150; 207; 237 (solution n°2) N-pentyl isopentyl phthalate PiPP 776297-69-9 306.41 Water: no available data Soluble in ethanol (11) 371 °C b (L) R1B Plasticizer in plastic material (12) CE n°1223/2009: prohibited 71; 149; 219; 237 (solution n°1) Dihexyl phthalate DHP 84-75-3 334.46 Water: 0.24 mg/L (20 °C) (1) 210 °C (5 mmHg) (6) (L) R1B Endocrine disruptor Plasticizer for cellulose and vinyl plastics (13) Absent from CE n°10/2011: prohibited (10) 149; 207; 233; 251; 281 (solution n°1) (continued on next page )
Table 2 (continued ) Compound Abbreviation CAS number Molar mass (g/mol) Structure Solubility Boiling point (Physical state) Toxicological risk a Use European legislation m/z ratios (Stock solution n°) Ethanol: no available data Bisphénol A BPA 80-05-7 228.29 Water: 120 mg/L (25 °C) (1) Soluble in alcohol (4) 220 °C (1) (S) R2 Endocrine disruptor Monomer used for polycarbonate and epoxy resins (4) CE n°2018/213: SML = 0.05 mg/kg CE n°1223/2009: prohibited 91; 119; 213; 214; 228 (solution n°2) Distearyl thiodipropionate (plastic additive n°17) ADD17 693-36-7 683.17 Insoluble in water Ethanol: no available data Very soluble in benzene and ole fi n polymers (14) MP: 61 °C (6) (S) – Plastic additive (15) CE n°10/2011: SML(t) = 5 mg/kg European Pharmacopoeia 106; 111; 125; 139; 178; 325 (solution n°2) References: (1) ( Howard and Chemical Rubber Company, 1997 ); (2) ( AFNOR, 2014 ); (3) ( European Chemicals Agency, 2010 ); (4) ( O'Neil and Merck and Co, 2006 ); (5) ( European Chemicals Agency, 2009 ); (6) ( Haynes, 2014 ); (7) ( Environment Agency Austria, 2012 ); (8) ( Federal Institute for Occupational Safety and Health, 2011 ); (9) ( Bureau for Chemical Substances, 2013 ); (10) ( Agence nationale de sécurité sanitaire alimentation, environnement, travail, 2015 ); (11) ( Gimeno et al., 2014 ); (12) ( Federal Institute for Occupational Safety and Health, 2012 ); (13) ( Federal Institute for Occupational Safety and Health, 2013 ); (14) ( Larrañaga et al., 2016 ); (15) ( Council of Europe and European Directorate for the Quality of Medicines & HealthCare (EDQM), 2010 ). a Globally Harmonized System of Classi fi cation and Labelling of Chemicals (GHS). b Data generated by CS ChemProp L: Liquid/S: Solid at atmospheric pressure and ambient temperature; Pressure not speci fi ed = atmospheric pressure.
source were 250 °C and 230 °C, respectively. The electron impact en ergy was 70 eV. The compounds were detected in selected ion mon
itoring (SIM) mode according to m/z ratios presented inTable 2. Dwell
time is 50 ms for all compounds except for DMEP and DiPP (25 ms) because 4,4′ dibromobiphenyl is detected in the same m/z window.
Concentration thresholds were determined using regulations
(European Commission, 2011;2018;European Parliament and Council
of the European Union, 2009, p. 200), internal data and systemic ex
posure dose (SED) calculation. The concentration thresholds defined
are: 0.5 mg/kg for phthalates, 0.05 mg/kg for BPA and 5.0 mg/kg for ADD17. The analytical method development must therefore attain an LOQ at these values for the corresponding compounds.
Internal standards (IS) are 4,4′ dibromobiphenyl for phthalates, as
indicated in the AFNOR norm NF EN 16521 (AFNOR, 2014), and for
BPA, since the molecular structures are similar, and n octadecane for ADD17. Individual phthalates, BPA and IS solutions were individually prepared by weighing 10 mg of each compound in 10 mL of absolute ethanol. ADD17 was prepared at the same concentration but with heptane as the dilution solvent. Solid compounds in solvent were placed in an ultrasonic bath for 10 min until complete dissolution. Compounds
were separated into two stock solutions (Table 2) in order to avoid too
many m/z zones on the same chromatograms and to allow better de tection of the peaks. Diluted solutions were prepared to obtain cali bration curves for each compound. Dilution solvent varied as a function of the matrix: demineralized water for aqueous simulants; 30% ethanol
for 30% ethanol simulant and absolute ethanol for 96% ethanol. 4,4′
dibromobiphenyl and n octadecane stock solutions were added to each
solution to obtainfinal IS concentrations of 500 μg/L and 200 μg/L
respectively.
Fig. 1. Workflow of the strategy for migration studies.
The migration tests strategy is described on Fig. 1. Inert glass con
tainers were used to stock simulants considered as control samples. One was kept at 4 °C and the other in a climatic chamber at 50 °C, in order to verify the effect of heat on the matrices. Moreover, these control sam ples were used to prove that no contamination had occurred during preparation, emptying and storage steps. This experimental condition permitted an accelerated aging process of the products. Packagings were emptied after storage under accelerated conditions (50 °C/1 month) and kept at 4 °C in order to be sure that the migration is stopped.
55 sets (packaging/simulant) were studied in duplicate. Moreover, 10 blanks were prepared, with 120 samples in total.
Before analysis, simulants in inert glass containers were removed from the refrigerator and left to come to room temperature, before being transferred to chromatographic vials.
2.4. Analytical procedure
All analyses were performed on an Agilent 7890A gas chromato graphy system coupled with an Agilent 5975C inert XL MSD with quadripole (Les Ulis, France) equipped with an electron impact ioni zation source and a Gerstel MPS 2 autosampler. A HP 5MS capillary column (30 m length, 0.25 mm, 0.25 μm film thickness) was used for separation. The temperature of the injector was set to 280 °C. Injection volumes varied depending on the matrix: 1.0 μL was injected for 96% ethanol, 0.8 μL for 30% ethanol and 0.5 μL for aqueous samples. Injection was in split mode (ratio 2:1). Helium was used as a carrier gas at a constant flow of 1 mL/min. The temperature gradient began at 100 °C and was raised to 200 °C at 30 °C/min. Then, the temperature was increased to 280 °C at 5 °C/min and continued at 50 °C/min, until 320 °C (held for 5 min). The temperature of the transfer line and ion
=
y
Recovery (%) y¯exp . 100
theo (1)
Where‾yexpis an experimental area value obtained by calculating the
average of the ratio between compound and internal standard peak
areas of 3 replicates. ytheois a theoretical area value obtained from the
calibration curve equation, with the concentration of the spiked
solutions.
The precision of analysis was estimated by calculating the relative standard deviation of the 3 replicates of spiked samples.
Laboratory control samples (one for each simulant), were analyzed with each set of samples to examine background contamination. A full set of calibration standards was analyzed before each set of samples and control standards were injected during the sets in order ensure system stability. Before each injection set, solvent blank (absolute ethanol, water or 30% ethanol) were injected to ensure the absence of peaks at the retention times of the studied compounds.
In order to confirm that no contamination occurred, control samples were analyzed. If one of the target compounds was detected in a control sample, the control sample peak area was subtracted from the sample peak area.
Validation was performed in absolute ethanol and neutral demi
neralized water. Parameters were also verified in ethanol 30% in order
to be sure that the method is valid in that simulant too.
Fig. 2. Workflow of the toxicological evaluation strategy; NOAEL: no observed adverse effect level; MoS: margin of safety; TTC: threshold of toxicological concern;
SCCS: Scientific Committee on Consumer Safety; SED: systemic exposure dose. Some other considerations must be taken depending on chemical specificity and
according to the TTC concept (i.e. organophosphates, carbamates, metals…).
2.5. Method validation
LOQs were determined by injecting the lowest concentration solu tion (in ethanol and in water) until a signal to noise ratio of at least 10:1 was obtained for each compound. LODs are considered to be LOQs/3. Linearity was determined by injecting solutions at eight dif ferent concentrations from the LOQ. Repeatability is evaluated by in jecting six times a solution containing contaminants at the selected concentration threshold. Accuracy is determined by analyzing blanks of absolute ethanol and water spiked at two different levels in triplicate (the selected concentration threshold and twice this value). The re
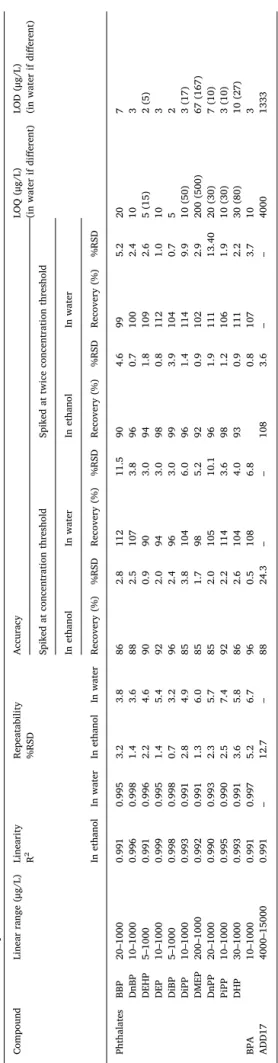
Table 3 Overview of the method performance characteristics. Compound Linear range (μ g/L) Linearity 2R Repeatability %RSD Accuracy LOQ (μ g/L) (in water if di ff erent) LOD (μ g/L) (in water if di ff erent) Spiked at concentration threshold Spiked at twice concentration threshold In ethanol In water In ethanol In water In ethanol In water In ethanol In water Recovery (%) %RSD Recovery (%) %RSD Recovery (%) %RSD Recovery (%) %RSD Phthalates BBP 20 –1000 0.991 0.995 3.2 3.8 86 2.8 112 11.5 90 4.6 99 5.2 20 7 DnBP 10 –1000 0.996 0.998 1.4 3.6 88 2.5 107 3.8 96 0.7 100 2.4 10 3 DEHP 5– 1000 0.991 0.996 2.2 4.6 90 0.9 90 3.0 94 1.8 109 2.6 5 (15) 2 (5) DEP 10 –1000 0.999 0.995 1.4 5.4 92 2.0 94 3.0 98 0.8 112 1.0 10 3 DiBP 5– 1000 0.998 0.998 0.7 3.2 96 2.4 96 3.0 99 3.9 104 0.7 5 2 DiPP 10 –1000 0.993 0.991 2.8 4.9 85 3.8 104 6.0 96 1.4 114 9.9 10 (50) 3 (17) DMEP 200 –1000 0.992 0.991 1.3 6.0 85 1.7 98 5.2 92 0.9 102 2.9 200 (500) 67 (167) DnPP 20 –1000 0.990 0.993 2.3 5.7 85 2.0 105 10.1 96 1.9 111 13.40 20 (30) 7 (10) PiPP 10 –1000 0.995 0.990 2.5 7.4 92 2.2 114 3.6 98 1.2 106 1.9 10 (30) 3 (10) DHP 30 –1000 0.993 0.991 3.6 5.8 86 2.6 104 4.0 93 0.9 111 2.2 30 (80) 10 (27) BPA 10 –1000 0.991 0.997 5.2 6.7 96 0.5 108 6.8 0.8 107 3.7 10 3 ADD17 4000 –15000 0.991 – 12.7 – 88 24.3 –– 108 3.6 –– 4000 1333 NB: there are no results for ADD17 in water because this compound is in solution in heptane, which is not soluble in water.
2.6. Toxicological procedure and analysis
The toxicological strategy offers four options for the safety evalua tion of different packagings.
Materials and analytical researches combined with toxicological approach were performed to guarantee the compatibility between the
container and its content and consequently consumer safety (Fig. 2).
For this purpose, several toxicological values were used: The Tolerable Daily Intake (TDI), the Reference Dose (RfD) and the Derived no Effect Level (DNEL). The TDI is the estimated concentration of a substance which can be ingested daily over a lifetime without sig
nificant risks to human health. TDIs are set out by the EFSA (European
Food Safety Authority) and are based on selected and appropriate stu dies. The RfD set out by the US EPA is defined as “an estimate” (with some uncertainties) of a daily exposure to the human population (in cluding sensitive subgroups) that is likely to be without an appreciable risk of deleterious effects during a lifetime. Finally, the DNEL (oral or dermal) is defined as the level of exposure to a substance above which humans should not be exposed. All of these values were derived from NOAEL, LOAEL or benchmark dose (BMD) with uncertainty factor for
reflection of limited data if necessary. The discrepancies between these
different values are due to the fact that US EPA, EFSA and REACH use
point of departure values based on different studies, different endpoints and/or different scenarios. As previously explained, different values furthermore arise depending on whether NOAEL, LOAEL or BMD are used, and which safety or uncertainty factors are applied.
Exposure assessment of phthalates was performed using the fol lowing information and by considering the worst case scenario. For this purpose, we considered a total amount of product applied each day equal to 18 g (according to the last version of the SCCS guidance notes (Scientific Committee on Consumer Safety, 2015)), a total bioavail
ability equivalent to 100%, a body weight of 60 kg for an adult and only the highest detected concentrations were used for the systemic ex posure calculation of each impurity.
3. Results and discussion 3.1. Method performance
The validation parameters are summarized in Table 3. For studied
compounds (except ADD17), LOD and LOQ were 2 and 5 μg/L for DEHP and DiBP respectively; 67 and 200 μg/L for DMEP respectively in ethanolic samples. ADD17 values determined only in ethanolic samples were 1333 and 4000 μg/L respectively. In water samples, LOD and LOQ were 2 and 5 μg/L for DiBP to 167 and 500 μg/L for DMEP. These values
are comparable to those reported in the literature (Bi et al., 2013; Ferrer
et al., 2011; Gimeno et al., 2012; Thomas et al., 2014). Even if there were no pre concentration steps, LOQ were always smaller than the selected concentration threshold and consequently, the protocol is adapted to the study.
A large linearity ranging from the LOQ to 1000 μg/L was observed for each target compound (to 15000 μg/L for ADD17). Correlation
coefficients were greater than 0.990 as recommended by the standar
dization ISO 12787 (AFNOR, 2011). Repeatability was less than 8%
RSD except for ADD17 (13%). The spiking recoveries varied between 90% and 114% for water samples and between 85% and 108% for ethanol samples (96%) and were reproducible as demonstrated by the RSD values which were lower than 10%.
Validation parameters in 30% ethanol were considered as accep table and are available as supplementary data.
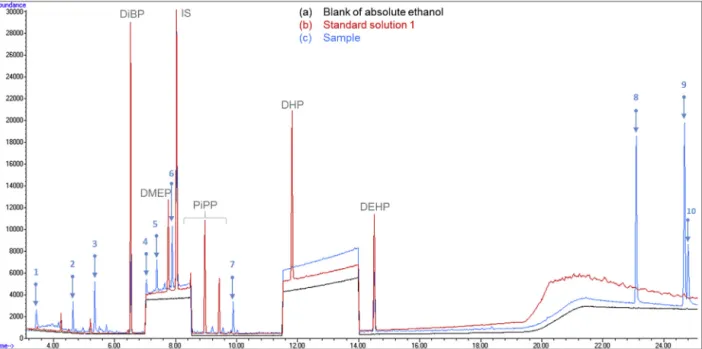
Fig. 3 shows examples of GC MS chromatograms: (a) a blank of absolute ethanol, (b) a standard solution n°1 in absolute ethanol at the selected concentration threshold and (c) a sample of simulant 96% ethanol after one month in PI8 (70% LLDPE/30% XLDPE).
3.2. Migration results
Fig. 4highlights how many compounds over the 12 studied were
detected in each tested packaging. As can be seen on this graph, there are more contaminants detected in PI4 to PI11 than in PI1 to PI3. PI8 (70% LLDPE/30% XLDPE) is actually the packaging with the highest
number of target compounds detected (6 out of the 12 studied). On the contrary, in PI3 (50% PET/50% rPET), none of the contaminants were detected (< LOD) whatever the simulant. This packaging can be con
sidered the“cleanest” pack of this study. In several packagings (PI1,
PI5, PI7, PI8, PI9, PI10), the total number of contaminants extracted corresponds to the number of contaminants extracted by simulant 96% Fig. 3. GC-MS chromatograms in SIM mode obtained from (a) a blank of absolute ethanol, (b) standard solution n°1 in absolute ethanol at selected concentration
threshold (400μg/L) and (c) a sample of simulant 96% ethanol after one month in PI8 (70% LLDPE/30% XLDPE) at 50 °C with IS at 500 μg/L. The blue arrows
indicate 10 unknown peaks i.e. peaks that are neither phthalates studied nor BPA, ADD17 or IS. The profile in “tread of a stair” is due to evolution of m/z during the
analysis. (For interpretation of the references to color in thisfigure legend, the reader is referred to the Web version of this article.)
Fig. 4. Number of selected contaminant(s) detected in each packaging reviewed. NB: alkaline water is absent from this graph because none of the studied compounds
was detected in this simulant. TOTAL corresponds to the sum of all the different contaminants detected in the packaging in all the simulants. Boxed texts are pairs
made up of the same materials but coming from different suppliers (PI1 and PI2 in 100% PET; PI4 and PI5 in 100% PP; PI9 and PI10 in COEX 70% LLDPE/30%
54μg/L for PI8. This last packaging was the most contaminated, but even with the sum of all compounds, the total concentration is still
under the selected concentration threshold of 500μg/L in this simulant.
The higher concentrations were observed with 96% ethanol, in which
the sum of the contaminants reached a concentration of 681μg/L in
PI8. BBP and DEHP were the principal compounds extracted. The se
lected concentration threshold is 400μg/L in 96% ethanol. The total
concentration of contaminants extracted from PI6 and PI8 is above this threshold.
Migration results are exposed inTable 4. Numerical values are given
when compounds were detected at a concentration higher than their LOQ. Among the 65 detections, only 35 were above the LOQ. Only DiBP
was detected above its selected concentration threshold (500μg/L in
the three water simulants and 30% ethanol; 400μg/L in 96% ethanol).
491μg/L (equal to 0.6 ppm) of this contaminant was found in the si
mulant 96% ethanol contained in the packaging in 100% SAN (PI6). A toxicological evaluation is therefore required in order to determine if this concentration of DiBP presents a risk for consumer safety. DEP was the most detected contaminant, being present in 16 samples. DnBP and DiBP were also found in at least 10 samples.
Comparing the packagings made up of the same materials but
coming from different suppliers (PI1 vs 2, PI4 vs 5 and PI9 vs 10), the
contamination profiles were not exactly the same. Even if the 100% PET
packagings (PI1 and PI2) did not leach the same compounds in the same simulants, they leached very few and very low concentrations of con taminants. On the contrary, PI4 and PI5, the 100% PP packagings leached far more contaminants as with PI9 and PI10 (COEX 70% LLDPE/30% XLLDPE//EVOH). These differences can probably be ex
plained by differences in the quality of the raw materials chosen by
suppliers.
This study focused on 12 selected compounds of toxicological in
terest but also highlighted 10 unidentified compounds (named “un
known peaks 1 to 10” on the chromatogram presented onFig. 3.) These
compounds should be identified to evaluate their toxicological potential and risk for consumers. Although the selected ion monitoring acquisi
tion mode is not dedicated to the identification of molecules, some
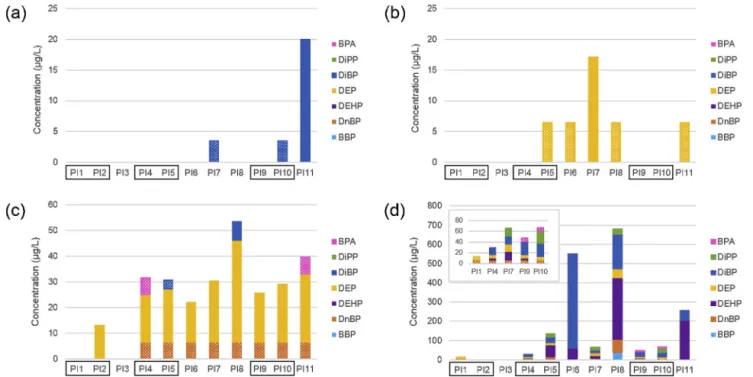
Fig. 5. Total concentration of studied contaminants in each packaging reviewed in (a) acidic water, (b) neutral water, (c) 30% ethanol and (d) 96% ethanol. NB: there is no graph for alkaline water because no target compounds were detected in this simulant. Bars with dots corresponds to concentrations between LOD and LOQ;
values for these concentrations were calculated as following: LOD + LOQ/2. Boxed texts are pairs made up of the same materials but coming from different suppliers
(PI1 and PI2 in 100% PET; PI4 and PI5 in 100% PP; PI9 and PI10 in COEX 70% LLDPE/30% XLDPE//EVOH). DEP concentration in acidic water (a) is not represented
on graph (a) since it is not possible to detect its contaminant under 300μg/L.
ethanol. This is not the case for the other packagings which demon strate specific behavior versus the simulant type. Both ethanol simu lants extracted in 10 packs out of 11, proving that ethanol has the strongest extraction potential of the simulants tested.
Fig. 5 presents the nature of the contaminants detected in each packaging as a function of the simulants used. Five compounds: ADD17, PiPP, DnPP, DMEP and DEHP were not detected at all. Moreover, none of the compounds studied were detected in alkaline water.
An analytical issue occurred during the detection of DEP in acidic water. Actually, at the retention time of DEP, acidic water chromato grams were much disrupted (chromatogram available in supplementary data). Because of this phenomenon, it was not possible to detect DEP in this simulant below 300 μg/L. This concentration is below the selected concentration threshold and this issue was considered as acceptable.
Consequently, this contaminant is not represented on Fig. 5a.
DiBP was the only contaminant detected in acidic water (Fig. 5a). Its
concentration varied from below the LOQ in packagings PI7 (100% HDPE) and PI10 (COEX 70% LLDPE/30% XLDPE//EVOH) to 20 μg/L in PI11 (70%HDPE/30%LLDPE). This contaminant was detected in only
these 3 packagings. In neutral water (Fig. 5b), as in acidic water, only
one compound was detected: DEP. It was present in 5 packagings over the 11 studied. The maximum concentration observed was in PI7 (100% HDPE). The contaminants detected in these two simulants are not the same. This observation can be explained by the fact that the con centrations measured were relatively low (close to the LOD/LOQ). Moreover, no data was found on the effect of pH on the solubility of phthalates. It is noticed that none of the compounds studied were ob served in packagings PI1 to PI4 and PI9 for the water simulants. The concentrations of DEP and DiBP measured were more than thirty times lower than in 96% ethanol.
In ethanol 30% and 96%, extraction rates were higher, both in terms of the concentrations and number of contaminants detected. In 30%
ethanol (Fig. 5c), 4 compounds were extracted. DEP and DnBP were the
most frequently extracted compounds detected in 9 packagings out of 11. Their maximum concentrations were measured at 40 μg/L and 7 μg/ L respectively. The total concentration varied from below the LOD to
Table 4 Migration tests results in the 5 simulants studied in μ g/L. Simulants Contaminants PI1 PI2 PI3 PI4 PI5 PI6 PI7 PI8 PI9 PI10 PI11 Acidic water Phthalates DEP: < 300 DEP: < 300 DEP: < 300 DEP: < 300 DEP: < 300 DEP: < 300 DEP: < 300 DiBP: < LOQ DEP: < 300 DEP: < 300 DEP: < 300 DiBP: < LOQ DEP: < 300 DiBP: 20.0 BPA < LOD < LOD < LOD < LOD < LOD < LOD < LOD < LOD < LOD < LOD < LOD Neutral water Phthalates < LOD < LOD < LOD < LOD DEP: < LOQ DEP: < LOQ DEP: 17.1 DEP: < LOQ < LOD < LOD DEP: < LOQ BPA < LOD < LOD < LOD < LOD < LOD < LOD < LOD < LOD < LOD < LOD < LOD Alkaline water Phthalates < LOD < LOD < LOD < LOD < LOD < LOD < LOD < LOD < LOD < LOD < LOD BPA < LOD < LOD < LOD < LOD < LOD < LOD < LOD < LOD < LOD < LOD < LOD 30% Ethanol Phthalates < LOD DEP: 13.1 < LOD DnBP: < LOQ DEP: 18.6 DnBP: < LOQ DEP: 20.7 DiBP: < LOQ DnBP: < LOQ DEP: 15.5 DnBP: < LOQ DEP: 23.9 DnBP: < LOQ DEP: 39.8 DiBP: 7.3 DnBP: < LOQ DEP: 19.2 DnBP: < LOQ DEP: 22.6 DnBP: < LOQ DEP: 26.6 BPA < LOD < LOD < LOD < LOQ < LOD < LOD < LOD < LOD < LOD < LOD < LOQ 96% Ethanol Phthalates DnBP: < LOQ DEP: < LOQ < LOD < LOD DnBP: < LOQ DEHP: < LOQ DEP: < LOQ DiBP: 12.4 DnBP: 16.2 DEHP: 59.8 DEP: 12.5 DiBP: 30.1 DiPP: 17.6 DEHP: 59.5 DiBP: 491.0 DnBP: < LOQ DEHP: 15.6 DEP: 14.4 DiBP: 14.5 DiPP: 15.0 BBP: 37.5 DnBP: 69.2 DEHP: 320.7 DEP: 46.2 DiBP: 180.1 DiPP: 27.0 DnBP: < LOQ DEHP: < LOQ DEP: < LOQ DiBP: 24.2 DnBP: < LOQ DEP: < LOQ DiBP: 24.4 DiPP: 53.0 DEHP: 205.9 DiBP: 51.3 BPA < LOD < LOD < LOD < LOD < LOD < LOD < LOD < LOD < LOQ < LOQ < LOD ADD17 < LOD < LOD < LOD < LOD < LOD < LOD < LOD < LOD < LOD < LOD < LOD Table 5 Toxicological reference values of targeted compounds. Compound Abbreviation TDI (EFSA) mg/ kg bw/day RfD (US EPA) mg/kg bw/day DNEL dermal (REACH) mg/kg bw/day DNEL oral (REACH) mg/kg bw/day Acidic water Neutral water Alkaline water 30% Ethanol 96% Ethanol SED μg/kg bw/day (worst case) Conclusion Benzylbutyl phthalate BBP 0,5 0,2 4,5 0,5 Not detected Not detected Not detected Not detected Not detected – acceptable Di-n-butyl phthalate DnBP 0,01 0,1 0,07 0,007 Not detected Not detected Not detected < LOQ Up to 69,2 (PI8) 0,02 acceptable Diethylhexyl phthalate DEHP 0,05 0,02 0,72 0,036 Not detected Not detected Not detected Not detected Up to 320,7 (PI8) 0,096 acceptable Diethyl phthalate DEP 0,5# 0,8 7,5 0,75 < 300 Up to 17,1 (PI7) Not detected Up to 39,8 (PI8) Up to 46,2 (PI8) 0,013 acceptable Di-isobutyl phthalate DiBP ND –– 0,008 Up to 20 (PI11) Not detected Not detected Up to 7,3 (PI8) Up to 491 (PI6) 0,147 acceptable Diisopentyl phthalate DiPP –– 0,07 0,007 Not detected Not detected Not detected Not detected Up to 53 (PI10) 0,016 acceptable # a TDI for DEP was not set by the SCF or EFSA, but the TDI of 0.5 mg/kg bw/day was proposed by the World Health Organization ( Sekizawa et al., 2003 ), and may therefore be considered. All other toxicological reference values (TDI, RfD and DNEL) come from the websites of EFSA, US EPA and REACH respectively.
4. Conclusion
Cosmetic products are used on a daily basis by adults, teenagers but also children and babies. Exposition to plastic additives through the use of hygiene or beauty products must be controlled and evaluated to ensure consumer safety.
A strategy developed to evaluate new packagings through the ana lysis of 12 toxicologically selected compounds were presented. This work combines analytical chemistry and toxicological evaluation and aim to be a base for developing a model applicable to all the NIAS. Eleven packagings were put in contact with 5 simulants chosen to mimic cosmetics behavior in order to reinforce the safety evaluation of the cosmetic containers. Some phthalates and BPA were detected in several simulants but without any risks for consumers. DiBP and DEHP were detected at high concentrations compared to the chosen con centration threshold. However, these quantities were proved to be safe for users.
A more exhaustive study could be led to identify other molecules of toxicological interest. Screening studies would enable an extension of the studied compounds panel.
The analytical method presented in this paper could be associated with suitable extraction techniques to extend the study to oily simulants such as liquid paraffin or glycerin. These matrices would allow to cover a larger panel of cosmetic products, since they are close to water in oil
emulsions or formulas with high contents of glycerin or liquid paraffin.
Moreover, the leaching of phthalate is probably accentuated because of
their lipophilic profile.
Acknowledgement
The authors acknowledge Maude Galonnier, Tiffany Masnou, Anna
Legrand and Virginie Murez for their contribution to this work. They also wish to acknowledge Richard Roe for checking English language. Appendix A. Supplementary data
Supplementary data to this article can be found online athttps://
doi.org/10.1016/j.fct.2019.03.030. References
O'Neil, M.J., Merck & Co (Eds.), 2006. The Merck Index: an Encyclopedia of Chemicals,
Drugs, and Biologicals, 14. Merck handbooks. Merck, Whitehouse Station, NJ. AFNOR, 2011. ISO 12787: Cosmetics - Analytical Methods - Validation Criteria for
Analytical Results Using Chromatographic Techniques (No. ISO 12787). AFNOR, 2014. Cosmétiques— Méthodes analytiques — Méthode CG-SM pour
l’identi-fication et l’analyse de 12 phtalates dans des échantillons de produits cosmétiques prêts à être injectés dans un système analytique. 71.100.70.
Agence nationale de sécurité sanitaire alimentation, environnement, travail, 2015. Connaissances relatives à la réglementation, à l’identification, aux propriétés chi-miques, à la production et aux usages des composés de la famille des phtalates (Tome 1) (Rapport d’étude). Maison-Alfort.
Amiridou, D., Voutsa, D., 2011. Alkylphenols and phthalates in bottled waters. J. Hazard Mater. 185, 281–286.https://doi.org/10.1016/j.jhazmat.2010.09.031.
Bach, C., Dauchy, X., Chagnon, M.-C., Etienne, S., 2012. Chemical compounds and tox-icological assessments of drinking water stored in polyethylene terephthalate (PET) bottles: a source of controversy reviewed. Water Res. 46, 571–583.https://doi.org/ 10.1016/j.watres.2011.11.062.
Bi, X., Pan, X., Yuan, S., Wang, Q., 2013. Plasticizer contamination in edible vegetable oil in a U.S. Retail market. J. Agric. Food Chem. 61, 9502–9509.https://doi.org/10. 1021/jf402576a.
Bignardi, C., Cavazza, A., Laganà, C., Salvadeo, P., Corradini, C., 2017. Release of non-intentionally added substances (NIAS) from food contact polycarbonate: effect of ageing. Food Control 71, 329–335.https://doi.org/10.1016/j.foodcont.2016.07.013. Bradley, Coulier, 2007. An Investigation into the Reaction and Breakdown Products from Starting Substances Used to Produce Food Contact Plastics (No. FD 07/01). Food Standards Agency.
Bureau for Chemical Substances, 2013. Proposal for Identification of a Substance as a CMR CAT 1A or 1B, PBT, vPvB or a Substance of an Equivalent Level of Concern -Dipentyl Phthalate.
Cacho, J.I., Campillo, N., Viñas, P., Hernández-Córdoba, M., 2012. Determination of al-kylphenols and phthalate esters in vegetables and migration studies from their packages by means of stir bar sorptive extraction coupled to gas chromato-graphy–mass spectrometry. J. Chromatogr. A 1241, 21–27.https://doi.org/10.1016/ j.chroma.2012.04.018.
Cao, X.-L., 2008. Determination of phthalates and adipate in bottled water by headspace solid-phase microextraction and gas chromatography/mass spectrometry. J. Chromatogr. A 1178, 231–238.https://doi.org/10.1016/j.chroma.2007.11.095. Careghini, A., Mastorgio, A.F., Saponaro, S., Sezenna, E., 2015. Bisphenol A,
non-ylphenols, benzophenones, and benzotriazoles in soils, groundwater, surface water, sediments, and food: a review. Environ. Sci. Pollut. Res. 22, 5711–5741.https://doi. org/10.1007/s11356-014-3974-5.
Casajuana, N., Lacorte, S., 2004. New methodology for the determination of phthalate esters, bisphenol a, bisphenol a diglycidyl ether, and nonylphenol in commercial whole milk samples. J. Agric. Food Chem. 52, 3702–3707.https://doi.org/10.1021/ jf040027s.
Charron, C., De Vaugelade, S., Richard, F., Largitte, A., Pirnay, S., 2018. Optimization of the method of the content-containing interaction evaluation for cosmetic products by gas chromatography-mass spectrometry. Int. J. Cosmet. Sci. 40, 269–275.https://doi. org/10.1111/ics.12460.
Chen, H., Wang, C., Wang, X., Hao, N., Liu, J., 2005. Determination of phthalate esters in cosmetics by gas chromatography withflame ionization detection and mass spec-trometric detection. Int. J. Cosmet. Sci. 27, 205–210.
Cirillo, T., Latini, G., Castaldi, M.A., Dipaola, L., Fasano, E., Esposito, F., Scognamiglio, G., Francesco, F.D., Cobellis, L., 2015. Exposure to di-2-ethylhexyl phthalate, di- N -butyl phthalate and bisphenol a through infant formulas. J. Agric. Food Chem. 63, 3303–3310.https://doi.org/10.1021/jf505563k.
Council of Europe, European Directorate for the Quality of Medicines & HealthCare (EDQM), 2010. European Pharmacopoeia. Council of Europe, Strasbourg. Environment Agency Austria, 2012. Proposal for Identification of a Substance as a CMR
CAT 1A or 1B, PBT, vPvB or a Substance of an Equivalent Level of Concern -Diisopentylphthalate.
European Chemicals Agency, 2009. 15 New Substances of Very High Concern to Be Added to the Candidate List [Press Release].
European Chemicals Agency, 2010. Evaluation of New Scientific Evidence Concerning the Restrictions Contained in Annex XVII to Regulation (EC) No 1907/2006 (REACH) -Review of New Available Information for Benzyl Butyl Phthalate.
European Commission, 2011. Commission Regulation (EU) No 10/2011 of 14 January 2011 on Plastic Materials and Articles Intended to Come into Contact with Food (Regulation No. 10/2011). European Union.
European Commission, 2018. Commission Regulation (EU) 2018/213 of 12 February 2018 on the Use of Bisphenol A in Varnishes and Coatings Intended to Come into Contact with Food and Amending Regulation (EU) No 10/2011 as Regards the Use of that Substance in Plastic Food Contact Materials (Regulation No. 2018/213). European Directorate for the Quality of Medicines & HealthCare (EDQM), 2013. 3.1
Materials and containers. In: European Pharmacopoeia. Council of Europe, Strasbourg.
European Parliament and Council of the European Union, 2009. Regulation (EC) No 1223/2009 of the European Parliament and of the Council of 30 November 2009 on Cosmetic Products (Regulation No. 1223/2009). European Union.
European Parliament and Council of the European Union, 2017. Regulation (EU) 2017/ 745 of the European Parliament and of the Council of 5 April 2017 on Medical Devices (Regulation No. 2017/745).
Fabjan, E., Hulzebos, E., Mennes, W., Piersma, A.H., 2006. A category Approach for re-productive effects of phthalates. Crit. Rev. Toxicol. 36, 695–726.https://doi.org/10. 1080/10408440600894914.
Fasano, E., Bono-Blay, F., Cirillo, T., Montuori, P., Lacorte, S., 2012. Migration of phthalates, alkylphenols, bisphenol A and di(2-ethylhexyl)adipate from food peaks are thought to be related to the phthalate family of compounds. It
is well established that phthalate fragmentation under electronic im pact mode forms a characteristic protonated phthalic anhydride mole
cular ion at m/z 149 except for dimethyl phthalate (Jeilani et al., 2011).
This is the main ion detected for peaks 1, 2, 5, 8, 9 and 10 and the second one for peak 4. As for DMEP, the latter presents a main peak at 207. No information can be extracted from the mass spectra of the other unknown peaks.
3.3. Toxicological analysis of results
The results obtained were compared to the toxicological reference
values (results are presented Table 5). Because the following com
pounds BBP, DMEP, DnPP, PiPP, DHP, BPA and ADD17 were not de tected (whatever the pack and simulants used), assessment cannot be performed. For the other impurities (DnBP, DEHP, DEP, DiBP and DiPP), calculated SED were 0,02, 0,096, 0,013, 0,147 and 0,016 μg/ kg bw/day respectively: all of these values were always below the re ference values used (expressed as mg/kg bw/day) as well as the TTC value. Moreover, it should be noted that these impurities are found preferentially with the simulant ethanol and more precisely with 96% ethanol. In view of such low exposures of these impurities found in the samples, there would be no quantifiable risk for the consumer.
a Substance as a CMR CAT 1A or 1B, PBT, vPvB or a Substance of an Equivalent Level of Concern - Bis(2-Methoxyethyl) Phthalate.
Federal Institute for Occupational Safety and Health, 2012. Proposal for Identification of a Substance as a CMR CAT 1A or 1B, PBT, vPvB or a Substance of an Equivalent Level of Concern - N-Pentyl-Isopentyl Phthalate.
Federal Institute for Occupational Safety and Health, 2013. Proposal for Identification of a Substance as a CMR CAT 1A or 1B, PBT, vPvB or a Substance of an Equivalent Level of Concern - Dihexyl Phthalate.
Feng, C.-H., Jiang, S.-R., 2012. Micro-scale quantitation of ten phthalate esters in water samples and cosmetics using capillary liquid chromatography coupled to UV detec-tion: effective strategies to reduce the production of organic waste. Microchim. Acta 177, 167–175.https://doi.org/10.1007/s00604-012-0761-1.
Ferrer, E., Santoni, E., Vittori, S., Font, G., Mañes, J., Sagratini, G., 2011. Simultaneous determination of bisphenol A, octylphenol, and nonylphenol by pressurised liquid extraction and liquid chromatography-tandem mass spectrometry in powdered milk and infant formulas. Food Chem. 126, 360–367.https://doi.org/10.1016/j. foodchem.2010.10.098.
Fierens, T., Servaes, K., Van Holderbeke, M., Geerts, L., De Henauw, S., Sioen, I., Vanermen, G., 2012. Analysis of phthalates in food products and packaging materials sold on the Belgian market. Food Chem. Toxicol. 50, 2575–2583.https://doi.org/10. 1016/j.fct.2012.04.029.
García Ibarra, V., Rodríguez Bernaldo de Quirós, A., Paseiro Losada, P., Sendón, R., 2018. Identification of intentionally and non-intentionally added substances in plastic packaging materials and their migration into food products. Anal. Bioanal. Chem. 410, 3789–3803.https://doi.org/10.1007/s00216-018-1058-y.
Gimeno, P., Maggio, A.-F., Bousquet, C., Quoirez, A., Civade, C., Bonnet, P.-A., 2012. Analytical method for the identification and assay of 12 phthalates in cosmetic products: application of the ISO 12787 international standard“Cosmetics-Analytical methods-Validation criteria for analytical results using chromatographic techniques. J. Chromatogr. A 1253, 144–153.https://doi.org/10.1016/j.chroma.2012.06.090. Gimeno, P., Thomas, S., Bousquet, C., Maggio, A.-F., Civade, C., Brenier, C., Bonnet, P.-A.,
2014. Identification and quantification of 14 phthalates and 5 non-phthalate plasti-cizers in PVC medical devices by GC–MS. J. Chromatogr. B 949–950, 99–108. https://doi.org/10.1016/j.jchromb.2013.12.037.
Gomez-Berrada, M.P., Ficheux, A.S., Galonnier, M., Rolfo, J.E., Rielland, A., Guillou, S., De Javel, D., Roudot, A.C., Ferret, P.J., 2017. Influence of the container on the consumption of cosmetic products. Food Chem. Toxicol. 109, 230–236.https://doi. org/10.1016/j.fct.2017.09.005.
Guo, Y., Kannan, K., 2013. A survey of phthalates and parabens in personal care products from the United States and its implications for human exposure. Environ. Sci. Technol. 47, 14442–14449.https://doi.org/10.1021/es4042034.
Guo, Y., Zhang, Z., Liu, L., Li, Y., Ren, N., Kannan, K., 2012. Occurrence and profiles of phthalates in foodstuffs from China and their implications for human exposure. J. Agric. Food Chem. 60, 6913–6919.https://doi.org/10.1021/jf3021128.
Hahladakis, J.N., Velis, C.A., Weber, R., Iacovidou, E., Purnell, P., 2018. An overview of chemical additives present in plastics: migration, release, fate and environmental impact during their use, disposal and recycling. J. Hazard Mater. 344, 179–199. https://doi.org/10.1016/j.jhazmat.2017.10.014.
Haynes, W.M., 2014. CRC Handbook of Chemistry and Physics, 95th Edition. CRC Press, Hoboken.
Howard, P.H., Chemical Rubber Company (Eds.), 1997. Handbook of Physical Properties of Organic Chemicals. Lewis Publ, Boca Raton.
Jeilani, Y.A., Cardelino, B.H., Ibeanusi, V.M., 2011. Density functional theory and mass spectrometry of phthalate fragmentations mechanisms: modeling hyperconjugated carbocation and radical cation complexes with neutral molecules. J. Am. Soc. Mass Spectrom. 22, 1999–2010.https://doi.org/10.1007/s13361-011-0215-8.
Jenke, D.R., Jene, J.M., Poss, M., Story, J., Tsilipetros, T., Odufu, A., Terbush, W., 2005. Accumulation of extractables in buffer solutions from a polyolefin plastic container. Int. J. Pharm. 297, 120–133.https://doi.org/10.1016/j.ijpharm.2005.03.010. Jenke, D., Castner, J., Egert, T., Feinberg, T., Hendricker, A., Houston, C., Hunt, D.G.,
Lynch, M., Shaw, A., Nicholas, K., Norwood, D.L., Paskiet, D., Ruberto, M., Smith, E.J., Holcomb, F., 2013. Extractables characterization forfive materials of con-struction representative of packaging systems used for parenteral and ophthalmic drug products. PDA J. Pharm. Sci. Technol. 67, 448–511.https://doi.org/10.5731/ pdajpst.2013.00933.
Larrañaga, M.D., Lewis, R.A., Lewis, R.J., Hawley, G.G., 2016. Hawley's Condensed Chemical Dictionary, sixteenth ed. John Wiley & Sons, Inc, Hoboken, New Jersey. Lateef, S.S., 2016. Extractables and Leachables Detected in Ophthalmic Drug Products
-Detection and Identification Using High-Resolution LC/MS/MS.
Lau, O.-W., Wong, S.-K., 2000. Contamination in food from packaging material. J. Chromatogr. A 882, 255–270.
Meeker, J.D., Sathyanarayana, S., Swan, S.H., 2009. Phthalates and other additives in plastics: human exposure and associated health outcomes. Philos. Trans. R. Soc. B Biol. Sci. 364, 2097–2113.https://doi.org/10.1098/rstb.2008.0268.
Muncke, J., 2011. Endocrine disrupting chemicals and other substances of concern in food contact materials: an updated review of exposure, effect and risk assessment. J. Steroid Biochem. Mol. Biol. 127, 118–127.https://doi.org/10.1016/j.jsbmb.2010. 10.004.
Nerin, C., Alfaro, P., Aznar, M., Domeño, C., 2013. The challenge of identifying non-intentionally added substances from food packaging materials: a review. Anal. Chim. Acta 775, 14–24.https://doi.org/10.1016/j.aca.2013.02.028.
Net, S., Sempéré, R., Delmont, A., Paluselli, A., Ouddane, B., 2015. Occurrence, fate, behavior and ecotoxicological state of phthalates in different environmental matrices. Environ. Sci. Technol. 49, 4019–4035.https://doi.org/10.1021/es505233b. Pan, C., Harmon, F., Toscano, K., Liu, F., Vivilecchia, R., 2008. Strategy for identification
of leachables in packaged pharmaceutical liquid formulations. J. Pharm. Biomed. Anal. 46, 520–527.https://doi.org/10.1016/j.jpba.2007.11.032.
Roberts, D., Feilden, A., Barlow, R., D'Silva, K., Silcock, P., 2016. Confident identification of leachable impurities from pharmaceutical container closure materials using orbi-trap-mass-spectrometer-based GC-MS. (application note).
Scientific Committee on Consumer Safety, 2015. The SCCS Notes of Guidance for the Testing of Cosmetic Ingredients and Their Safety Evaluation 9th Revision (Guidance No. SCCS/1564/15). European Commission.
Sekizawa, J., Dobson, S., Touch, R.J., 2003. Diethyl Phthalate, Concise International Chemical Assessment Document. World Health Organization, Geneva.
Shen, H.-Y., Jiang, H.-L., Mao, H.-L., Pan, G., Zhou, L., Cao, Y.-F., 2007. Simultaneous determination of seven phthalates and four parabens in cosmetic products using HPLC-DAD and GC-MS methods. J. Sep. Sci. 30, 48–54.https://doi.org/10.1002/jssc. 200600215.
Thomas, C., Siong, D., Pirnay, S., 2014. Evaluation of the content - containing interaction in cosmetic products using gas chromatography-mass spectrometry. Int. J. Cosmet. Sci. 36, 327–335.https://doi.org/10.1111/ics.12130.
Thompson, R.C., Moore, C.J., vom Saal, F.S., Swan, S.H., 2009. Plastics, the environment and human health: current consensus and future trends. Philos. Trans. R. Soc. B Biol. Sci. 364, 2153–2166.https://doi.org/10.1098/rstb.2009.0053.
Viñas, P., Campillo, N., Pastor-Belda, M., Oller, A., Hernández-Córdoba, M., 2015. Determination of phthalate esters in cleaning and personal care products by dis-persive liquid–liquid microextraction and liquid chromatography–tandem mass spectrometry. J. Chromatogr. A 1376, 18–25.https://doi.org/10.1016/j.chroma. 2014.12.012.
Zhang, Y., Sun, S., Xing, X., Du, Z., Guo, Q., Yu, W., 2016. Detection and identification of leachables in vaccine from plastic packaging materials using UPLC-QTOF MS with self-built polymer additives library. Anal. Chem. 88, 6749–6757.https://doi.org/10. 1021/acs.analchem.6b01027.
packaging. Food Control 27, 132–138. https://doi.org/10.1016/j.foodcont.2012.03. 005.