Publisher’s version / Version de l'éditeur:
ECS Transactions, 16, 2, pp. 913-923, 2008-10-17
READ THESE TERMS AND CONDITIONS CAREFULLY BEFORE USING THIS WEBSITE.
https://nrc-publications.canada.ca/eng/copyright
Vous avez des questions? Nous pouvons vous aider. Pour communiquer directement avec un auteur, consultez la première page de la revue dans laquelle son article a été publié afin de trouver ses coordonnées. Si vous n’arrivez pas à les repérer, communiquez avec nous à PublicationsArchive-ArchivesPublications@nrc-cnrc.gc.ca.
Questions? Contact the NRC Publications Archive team at
PublicationsArchive-ArchivesPublications@nrc-cnrc.gc.ca. If you wish to email the authors directly, please see the first page of the publication for their contact information.
Archives des publications du CNRC
This publication could be one of several versions: author’s original, accepted manuscript or the publisher’s version. / La version de cette publication peut être l’une des suivantes : la version prépublication de l’auteur, la version acceptée du manuscrit ou la version de l’éditeur.
For the publisher’s version, please access the DOI link below./ Pour consulter la version de l’éditeur, utilisez le lien DOI ci-dessous.
https://doi.org/10.1149/1.2981930
Access and use of this website and the material on it are subject to the Terms and Conditions set forth at
INFLUENCE OF ANISOTROPIC TRANSPORT PROPERTIES OF THE GDL ON THE PERFORMANCE OF PEMFCS
Zhang, X.; Song, D.-T.; Wang, Q.-P.; Huang, C.; Liu, Z.-S.
https://publications-cnrc.canada.ca/fra/droits
L’accès à ce site Web et l’utilisation de son contenu sont assujettis aux conditions présentées dans le site LISEZ CES CONDITIONS ATTENTIVEMENT AVANT D’UTILISER CE SITE WEB.
NRC Publications Record / Notice d'Archives des publications de CNRC: https://nrc-publications.canada.ca/eng/view/object/?id=08076c90-b0b1-486a-b522-9f6abfd9b203 https://publications-cnrc.canada.ca/fra/voir/objet/?id=08076c90-b0b1-486a-b522-9f6abfd9b203
ON THE PERFORMANCE OF PEMFCS
X. Zhang, D.-T. Song ,Q.-P. Wang ,C. Huang, and Z.-S. Liu
Institute for Fuel Cell Innovation, National Research Council, 4250 Wesbrook Mall, Vancouver, BC, Canada, V6T 1W5
A two-dimensional, non-isothermal two-phase model, which includes the full anisotropy of GDL, was developed to investigate the effect of anisotropic ratios on cell performance. Among the four anisotropic ratios, the anisotropic ratio of diffusivity, γD, is the most sensitive parameter to cell performance. The present study demonstrated the possibility of improving cell performance by using innovated GDL porous materials with higher anisotropic ratios, especially higherγ . D
Introduction
The gas diffusion layers (GDLs) of PEM fuel cells, which are porous to allow for gaseous fuels to diffuse to the catalyst side, conduct electricity and heat to or from catalyst side to the current collectors. In addition, the pores of the GDLs provide pathways for removal of liquid water generated by electrochemical reaction and condensation. Although the overall cell performance has significantly been improved in the recent years, a major limitation is still from the mass transport. Cathode GDL plays a critical role in the whole mass transport because generated liquid water will block the open pore paths to impede oxygen transport to the active reaction sites.
A non-isothermal, multicomponent, two-phase diffusion layer model was presented by Senn et al. (1). Natarajan et al (2) developed a two-dimensional, two-phase, multicomponent transient model for cathode GDL. Both of them discussed the effects of temperature, relative humidity of inlet stream, thickness and porosity of GDL, size of channels and shoulders and channel-to-shoulder ration on cell performance. Their model results provided useful data on optimizing flow field design. However, in their models, they assumed that GDLs were isotropic porous media. The most commonly used GDLs for PEM fuel cells are carbon cloth or carbon paper. Due to the orientation of the underlying fibers, the GDLs show strong anisotropy leading to different transport coefficients in the in-plane and through-plane directions. Therefore, how anisotropic transport properties of GDL affect cell performance of PEMFC becomes an important issue.
Pasaogullari et al. (3) developed a 2-D non-isothermal, multiphase mixture model to investigate the effects of anisotropy of GDL. They found that maximum temperature difference in the GDL was strong function of GDL anisotropy. By a 2-D PEMFC cathode model, Pharoah et al. (4) showed that treating the GDL as an isotropic porous media yielded significant different current density prediction compared to anisotropic treatments. However, they did not take into account the effects of anisotropy of GDL on the performance of PEMFCs. In the present work, we developed a 2-D, non-isothermal, two-phase model with the full anisotropic tensors to investigate the impact of anisotropy of GDL on cell performance. The anisotropic properties of the material are described by permeability, diffusivity, electrical conductivity and thermal conductivity.
Model Description
In this study, the simulation domain was limited to cathode GDL as shown schematically in Figure 1. We assumed symmetry at the channel centerline and the land centerline. We also assumed that main axes of anisotropy overlap with geometrical coordinates and defined that anisotropic ratios γ were in-plane properties divided by through-plane properties. They are:
⎥ ⎦ ⎤ ⎢ ⎣ ⎡ = ⎥ ⎦ ⎤ ⎢ ⎣ ⎡ = ⎥ ⎦ ⎤ ⎢ ⎣ ⎡ = ⎥ ⎦ ⎤ ⎢ ⎣ ⎡ = s c k th s s th c c D th K th D D and k k K K γ γ σ σ γ γ σ 0 0 1 , 0 0 1 , 0 0 1 , 0 0 1 , , [1]
Figure 1 Schematic diagrams of simulation domain
Two-phase mass and momentum conservation---In porous GDL, two-phase flows follow separated equations for the gaseous mixture and liquid phase.
phase l lu =m ∇ρ [2] phase g gu =−m ∇ρ [3]
where the term on the right-hand side of above equations (mphase) is the interfacial mass transfer rate of phase change due to evaporation or condensation. ρl, ρg are the densities of liquid water and gaseous mixture, respectively. The superficial velocities of liquid water and gaseous mixture, ul,ug , are assumed to be expressed by Darcy’s law.
Current collector
y x L b/2 h/2 Flow Channel GDL CCL B1 B2 B3 B4 B5
l l rl l p k K u =− ∇ µ [4] g g rg g p k K u =− ∇ µ [5]
where K is the absolute permeability tensor of the GDL, while krl,krg are the relative
permeabilities of the gaseous mixture and the liquid water, which are the function of the liquid water saturation, i.e. krl =s3 and krg =(1−s3) (5). µl, µg and p ,l pg are the dynamic viscosities and the partial pressure of liquid water and gaseous mixture, respectively.
The Tomadakis-Sotirchos (TS) model enables the prediction of anisotropic permeability without any fitting parameters (6).
(
)
(
)
( )(
)
[
(
)
]
2 2 2 1 1 ln 8 p p f p d K ε ε α ε ε ε ε ε α α − + − − = + [6]where d is the fiber diameter, f α and εp are constants that depend on the fiber arrangement and the direction of flow. For 2D arrangement,
) plane -in ( 521 . 0 ) plane -through ( 785 . 0 , 11 . 0 = = = α α εp [7] th in K K K = γ [8] The capillary pressure, which is the difference between gas phase pressure and liquid phase pressure, is given by (5)
) ( cos s K p p p i i l g c = − = ℑ ε θ σ [9]
where σ is the surface tension, θ is the contact angle, s is the liquid water saturation, )
(s
ℑ is so called Leverett function.
⎪⎩ ⎪ ⎨ ⎧ > + − ≤ − + − − − = ℑ D D 90 263 . 1 21 . 2 417 . 1 90 ) 1 ( 263 . 1 ) 1 ( 21 . 2 ) 1 ( 417 . 1 ) ( 3 2 3 2 θ θ s s s s s s s [10]
⎪ ⎩ ⎪ ⎨ ⎧ < − ≥ − − = O H sat O H g O H sat O H g g vap O H sat O H g O H sat O H g g O H cond phase x x x x sp k x x x x RT p M s k m 2 2 2 2 2 2 2 2 2 ) ( ) ( ) 1 ( ε ε [11]
where kcond,kvapare the condensation and evaporation rate constant, respectively. xgH2Ois the mole fraction of water vapor and xsatH2O is the saturation molar fraction of water vapor and is a function of the operating temperature T .
Species conservation---The species conservation equations were written in terms of the mass concentration (wO2,wH2O,wN2). The species transports based on the diffusion and convection are given by:
[
2 − (1− ) 2∇ 2]
=0 ⋅ ∇ O eff O g O g g w ερ s D w ρ u [12][
V]
phase eff V g V g g w − −s D ∇w =−m ⋅ ∇ ρ u ερ (1 ) [13] V O N w w w 2 =1− 2 − [14] where Veff eff O DD 2, are the effective diffusion coefficients tensor for oxygen and water vapor, respectively. Similar to absolute permeability tensor K , according to TS model
(6), V O i D f Dieff = (ε) i ∈ 2, [15] α ε ε ε ε ε ⎟⎟ ⎠ ⎞ ⎜ ⎜ ⎝ ⎛ − − = p p f 1 ) ( [16] 264 . 0 , , 1 − ⎟ ⎟ ⎠ ⎞ ⎜ ⎜ ⎝ ⎛ − − = = p p th i in i D D D ε ε ε γ [17]
The bulk diffusivities of oxygen and water vapor (DO2,DV) are temperature dependent and given by (5): 823 . 1 7 2 15 . 273 10 1775 . 0 ⎟ ⎠ ⎞ ⎜ ⎝ ⎛ × = − T DO [18] 334 . 2 4 15 . 307 10 256 . 0 ⎟ ⎠ ⎞ ⎜ ⎝ ⎛ × = − T DV [19]
0 ) ( 32 ∇ = ⋅ ∇ − εc σc ψ [20]
where εc is volume fraction of solid phase in GDL, εc = 1−ε . σc is the electronic conductivity tensor of solid phase. ψ is the electronic potential.
Energy conservation---The energy conservation equation in this model for GDL described the conductive and convective heat transfer in GDL. We assumed that the temperatures of gas phase, liquid phase and solid phase are at local thermal equilibrium (Tl =Tg =Ts =T ):
[
]
{
−s kg +skl +ks ∇T}
+ lClp l ⋅∇T + gCgp g ⋅∇T =Hvapmphase+Q ⋅ ∇ − (1 ) ρ u ρ u [21] where l p g p l g k C Ck , , , are the effective thermal conductivities and effective specific heat capacities of liquid phase and gas phase, respectively. However, ks is the thermal conductivity tensor of the solid phase. The first term on the right-hand side of EQ. 21 is a heat source/sink due to condensation and evaporation. Hvap is the latent heat of condensation/evaporation. The second term Q is an internal volumetric source/sink because of the conduction current.
ψ σ ε ψ⋅ ∇ ∇ = c c Q 1.5 [22]
The above conservation equations are for the unknown velocities of gas phase (u ) and liquid phase (g u ), pressures of gas phase (l p ) and liquid phase (g p ), mass l
concentration of water vapor (wV) and oxygen (wO2) and common temperature (T ).
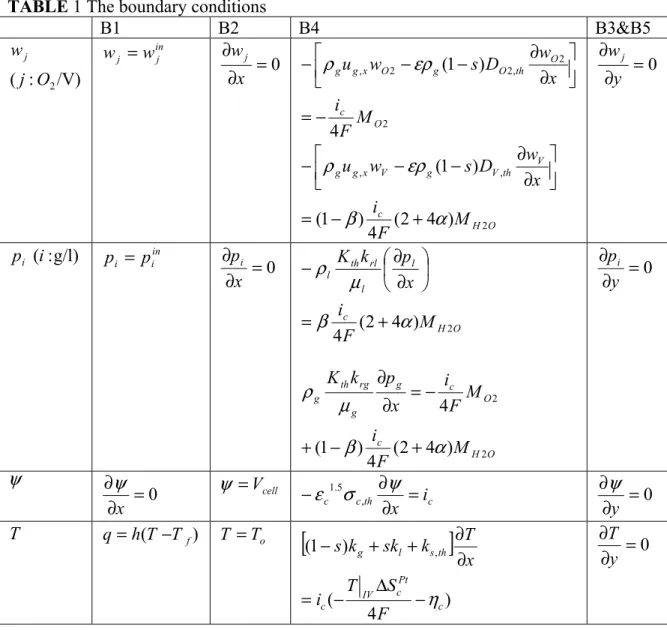
Boundary conditions--- As shown in Figure 1, there are five boundaries or interfaces. The boundary conditions are listed in Table 1.
The interface between the channel and the GDL (B1) is the inlet for the reaction gases. A convective heat transfer boundary is adopted. h is the heat transfer coefficient and Tf is the free-stream temperature(3).
At the interface of GDL and the shoulder of channels (B2), because the current collector is impermeable, the fluxes of species are zero. We assumed that electronic potential at the anode current collector is zero. As the current collector has larger electronic conductivities, i.e., the ohmic loss through the current collector is negligible. Therefore, the electronic potential at the cathode current collector is cell voltage Vcell. If we omit the concentration overpotential of the anode hydrogen oxidation reaction (HOR), the cell voltage is
m m c c ocv cell L i E V ⎟⎟ ⎠ ⎞ ⎜⎜ ⎝ ⎛ − − = σ η [23]
where Eocv is the open circuit voltage, σm is the membrane conductivity, ic is the local current density.
TABLE 1 The boundary conditions
B1 B2 B4 B3&B5 /V) : (j O2 wj in j j w w = 0 = ∂ ∂ x wj 2 2 , 2 2 , 4 ) 1 ( O c O th O g O x g g M F i x w D s w u − = ⎥⎦ ⎤ ⎢⎣ ⎡ ∂ ∂ − − − ρ ερ O H c V th V g V x g g M F i x w D s w u 2 , , ) 4 2 ( 4 ) 1 ( ) 1 ( α β ερ ρ + − = ⎥⎦ ⎤ ⎢⎣ ⎡ ∂ ∂ − − − 0 = ∂ ∂ y wj ) g/l : (i pi in i i p p = 0 = ∂ ∂ x pi O H c l l rl th l M F i x p k K 2 ) 4 2 ( 4 α β µ ρ + = ⎟ ⎠ ⎞ ⎜ ⎝ ⎛ ∂ ∂ − O H c O c g g rg th g M F i M F i x p k K 2 2 ) 4 2 ( 4 ) 1 ( 4 α β µ ρ + − + − = ∂ ∂ 0 = ∂ ∂ y pi ψ 0 = ∂ ∂ x ψ ψ =Vcell c th c c i x = ∂ ∂ −ε 1.5σ , ψ 0 = ∂ ∂ y ψ T q=h(T−Tf) T =To
[
]
) 4 ( ) 1 ( , c Pt c IV c th s l g F S T i x T k sk k s η − ∆ − = ∂ ∂ + + − =0 ∂ ∂ y TThe oxygen reduction reaction (ORR) is described via Tafel kinetics (2):
⎟ ⎠ ⎞ ⎜ ⎝ ⎛ − − = RT F s C C I i c c ref O O ref c c η α exp ) 1 ( 2 2 , [24]
Here ηc is the cathode overpotential, Ic,ref is the reference exchange current density, αc is the cathode transfer coefficient.
At the interface of GDL and CL (B4), in the same way of ref. (5), we assumed α is the net water transport coefficient across the membrane and β is the liquid water percentage to the all of the water across the interface of B4. B3 and B5 are the symmetrical boundary conditions.
The above described governing equations and boundary conditions are solved by using COMSOL Multiphysics base on the finite element technique.
Results and Discussion
Table 2 lists the important parameter values used as the base case. To investigate the impact of GDL anisotropy on the cell performance, different GDLs with varied anisotropic ratios were simulated at the same operating conditions at 333.15 K cell temperature and 1 atm operating pressure. The relative humidity of inlet air was 100%.
TABLE 2 Parameters used in the model
Parameters/properties Value
GDL thickness, L 370µm
Fiber diameter of GDL,df 9.2µm
Toray carbon paper: GDL porosity, ε 0.55
GDL contact angle, θ 110°
Half rib width, b/2 500 µm
Half channel width, h/2 500µm
Catalyst layer thickness,Lc 16µm
Membrane thickness, L m 50 µm Electronic conductivity, σc (γσc =14.28) 1250 S/m (through-plane) 17857 S/m (in-plane) Thermal conductivity, ks (γks =12.35) 1.7 W/m K (through-plane) 21W/m K (in-plane) Membrane conductivity σm 7 S/m
Entropy of ORR, ∆ScPt -326.36 J/(mol K)
Cathodic transfer coefficient, αc 1
Reference oxygen concentration, CrefO2 40.88 mol/ m3
Condensation constant, kcond 100 1/s
Evaporation constant, kvap 100 1/(atms)
Net water transport coefficient, α 0.25 Liquid water percentage, β 0.5
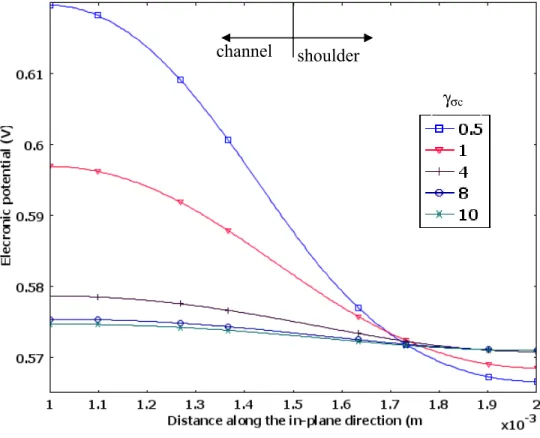
Figure 2 shows the dependence between power density and anisotropic ratio at the cathode overpotential ηc =−0.4V . Because we assumed that membrane is fully hydrated with higher proton conductivities (σm =7S/m), the current density is mainly dependent on oxygen concentration at GDL/CL interface (B4). As shown in Figure 2, because
c σ
γ has no effect on the mass transport, cell performance does not change while
c σ
γ increases. However, it affects the distribution of electronic phase potential significantly as shown in Figure 3.
8000 8500 9000 9500 10000 10500 11000 0 2 4 6 8 10 Anisotropic ratios, P ow e r de ns it y ( W /m 2 )
Figure 2 Dependence between power density and anisotropic ratio at ηc =−0.4V
Figure 3 Electronic potential distributions at the GDL-CL interface at ηc =−0.4V
The permeability directly affects the distribution of saturation. As γ increases, K because the in-plane permeability is higher, it requires a smaller pressure gradient to
γK γD γσc γks shoulder channel γσc
and has lower values as shown in Figure 4. Due to the lower saturation at higher value of
K
γ , the less reaction areas are covered by liquid water. This leads to slightly higher power density as shown in Figure2.
Figure 4 Saturation distributions at the GDL-CL interface at ηc =−0.4V
Because heat transfer from GDL is mainly through the current collector shoulder, when γksincreases, higher thermal conductivity in in-plane direction results in the more uniform temperature distribution and lower temperature in the GDL as shown in Figure 5. According to Equation [24], lower temperature leads to lower gas diffusivities and higher saturation, which makes current density decrease. However, the exponential term of the equation leads to current density increase. Therefore, at different current density,
ks
γ shows different impacts on cell performance although Figure 2 shows that as γks increases from 1 to 10, cell performance increases a few and then tends to be a constant at
V c =−0.4 η . γK shoulder channel
Figure 5 Temperature distributions at the GDL-CL interface at ηc =−0.4V
Figure 6 Oxygen mass concentration distributions at the GDL-CL interface at
V c =−0.4 η shoulder channel γD shoulder channel γks
Compared to above three anisotropic ratios, γ shows significant impact on cell D performance. When γD <1, due to lower transport coefficients in the in-plane direction,
less oxygen could reach the regions underneath the current collectors. This means that the distribution of oxygen at interface of GDL with catalyst layer is less uniform as shown in Figure 6. This results in lower power density. When γD >1, for example, γ changes D
from 1 to 2, power density increases about 6% as shown in Figure 2. This is an extremely interesting case, because compared to the other anisotropic ratios, γ is the D most sensitive parameter for cell performance. For popular used Toray carbon paper, γ D is around 1.2. This indicates that it is possible to improve cell performance by using higher γ materials for GDLs. D
Conclusions
A two-dimensional, non-isothermal two-phase model, which includes the full anisotropy of GDL, was developed to investigate the effect of anisotropic ratios on cell performance. Among the four anisotropic ratios, γ is the most sensitive parameter for D cell performance. The present study demonstrated the possibility of improving cell performance by using innovated GDL porous materials with higher anisotropic ratios, especially higherγ . D
References
1. S.M. Senn and D. Poulikakos, J. Heat Transfer, 127 (2005), 1245-1259.
2. D. Natarajan and T. V. Nguyen, J. Electrochem, Soc. 148, (2001), A1324-A1335. 3. U. Pasaogullari, P.P. Mukherjee, C.Y. Wang and K.S. Chen, J. Electrochem, Soc.
154, (2007), B823-B834.
4. J. G. Pharoah, K. Karan and W. Sun, J. Power Source 161 (2006) 214-224
5. D.T. Song, Q.P. Wang, Z.S. Liu and C. Huang, J. Power Source 159(2006) 928-942
6. J. T. Gostick, M. W. Fowler, M.D. Pritzker. M. A. Ioannidis and L. M. Behra, J. Power Source 162(2006) 228-238