HAL Id: hal-03110367
https://hal.archives-ouvertes.fr/hal-03110367
Submitted on 14 Jan 2021
HAL is a multi-disciplinary open access
archive for the deposit and dissemination of
sci-entific research documents, whether they are
pub-lished or not. The documents may come from
teaching and research institutions in France or
abroad, or from public or private research centers.
L’archive ouverte pluridisciplinaire HAL, est
destinée au dépôt et à la diffusion de documents
scientifiques de niveau recherche, publiés ou non,
émanant des établissements d’enseignement et de
recherche français ou étrangers, des laboratoires
publics ou privés.
The Dole effect over the last two glacial-interglacial
cycles
B. Malaizé, D. Paillard, J. Jouzel, D. Raynaud
To cite this version:
B. Malaizé, D. Paillard, J. Jouzel, D. Raynaud. The Dole effect over the last two glacial-interglacial
cycles. Journal of Geophysical Research: Atmospheres, American Geophysical Union, 1999, 104 (D12),
pp.14199-14208. �10.1029/1999JD900116�. �hal-03110367�
JOURNAL OF GEOPHYSICAL RESEARCH, VOL. 104, NO. D12, PAGES 14,199-14,208, JUNE 27, 1999
The Dole effect over the last two glacial-interglacial cycles
B. Malaiz6 •
Graduate School of Oceanography, University of Rhode Island, Kingston
Laboratoire des Sciences du Climat et de l'Environnement, Unit6 Mixte de Recherche
Commissariat • l'Energie Atomique-CNRS, Gif-sur-Yvette, France
D. Paillard and J. Jouzel
Laboratoire des Sciences du Climat et de l'Environnement, Unit6 Mixte de Recherche
Commissariat/t l'Energie Atomique-CNRS, Gif-sur-Yvette, France
D. Raynaud
Laboratoire de Glaciologie et G6ophysique de l'Environnement, CNRS, St Martin d'H•res, France
Abstract. Detailed
measurements
of filSO
of atmospheric
oxygen
performed
on air trapped
in the
Vostok ice cores (Antarctica) are used to extend
the record of the Dole effect over two climatic
cycles
(back to 240 kyr B.P.). Except for glacial terminations
I and II and for an unexpected
minimum occurring
around 175 kyr, the Dole effect shows
small variations
(ADole within +
0.5%o).
These small variations,
however, show a well-marked
23 kyr precessional
periodicity,
thus
confirrning
the results
obtained
by Bender et al. [ 1994a] for the first climatic cycle. To explain the
minimum value reached
around 175 kyr, we invoke the possibility
of a peak in the oceanic
productivity
linked to climatic events
induced
at low latitudes
under glacial conditions.
1. Introduction
The Dole effect denotes the natural enrichment of the
lSO/160 isotopic ratio of oxygen in the atmosphere with respect to its value in the ocean. Its present-day value is -
23.5%o (expressed in the /5 scale relative to the SMOW
standard,
which
has an •sO/160
isotope
ratio of 2005.2
x 10-6).
Most of this enrichment is due to the activity of marine and
terrestrial biospheres which transmit the f lsO signature of
oceanic and continental waters to the atmosphere via
mechanisms such as respiration and photosynthesis [Dole,
1935; Lane and Dole, 1956; Dongmann, 1974; FOrstel, 1978; Bender et al., 1985; Sowers et al., 1991].
To estimate the Dole effect in the past, we need to look at
paleoclimatic records of the f•sO of the atmospheric oxygen (hereinafter f18Oatm ) and of the kitsO of seawater (hereinafter f•SOsw). The first information is obtained fi'om the analysis of
bubbles of ancient air trapped in ice cores. The second one comes fi'om the study of deep sea sediment cores through the
f•sO of foraminifera shells, which gives access to the f•SO•w at
the time of their formation. The Dole effect in the past is then
obtained by subtracting the f•SOsw and f•SOa•n signals at the same age. Uncertainties in the ADole (the difference between
the Dole effect in the past and the Dole effect today) thus
combine uncertainties associated with each of these two
records but also errors in the relative chronologies of the ice
and of the deep sea core records. As noted by Bender et al.
'Permanently at D6partement de G6ologie et Oc6anographie, Unit6
Mixte de Recherche 5805, Environnements et Pa16oenvironnements Oc6aniques, Talence, France.
Copyright 1999 by the American Geophysical Union.
Paper number 1999JD900116.
[1994a], these latter uncertainties
can indeed induce very
large changes
in apparent
values
of the ADole record.
In 1994, Bender et al. [1994a] performed a complete study
of the Dole effect and of its variations over the first glacial-
interglacial cycle, as inferred fi'om the past variations of the
f•SOatm values recorded in the air bubbles trapped in the
Vostok ice cores. Their main result was that the Dole effect varied in the past but with a small amplitude. They concluded that the different processes affecting f18Oatm must have
somehow canceled each other. However, they identified the
presence of a precessional periodicity (-23 kyr) in the past
variations of ADole with a remarkable relation with the
summer insolation at low northern latitudes [Bender et al.,
1994a]. Such a precessional signal is also clearly seen in paleorecords of the marine productivity and terrestrial hydrological cycle at low latitudes [Clemens and Prell, 1990;
Chappellaz et al., 1990].
In this article we extend the pioneering work of Bender et
al. [1994a] to the second climatic cycle using new data obtained from Vostok ice cores down to 2750 m. To assess the influence of chronological uncertainties on our estimate of the
ADole effect, we use three different, independently derived
Vostok timescales and perform additional sensitivity studies. After discussing different parameters involved in the Dole
effect,
we present
our results
and compare
them
with the results
of Bender et al.. We confirm the conclusion of these authors
concerning the presence of a strong precessional signal in the
ADole record, and we examine its relation with the summer insolation at 20øN for the last two climatic cycles. We further
discuss one striking feature of the second climatic cycle, namely, an unexpected high variation of the Dole effect during
the insolation maximum around 175 kyr B.P., already
mentioned by Mdlibres et al. [1997]. We examine how climatically induced changes in marine and terrestrial biospheres might have influenced ADole in the past.
14,200 MALAIZE ET AL.' THE DOLE EFFECT OVER TWO CLIMATIC CYCLES 2. The Dole Effect
To understand what might have influenced the Dole effect in the past, we first summarize the mechanisms involved [Bender et al., 1994a]. During respiration most species use preferentially the light •80 oxygen isotope, which results in an enrichment in •80 for the atmospheric reservoir. Global isotope effects of-- 18.0%o for the respiration of the terrestrial biosphere and of •- 18.9%o for the respiration of the marine biosphere have been estimated [Bender et al., 1994a]. During photosynthesis the /5•O rejected in the atmosphere has the same value as the oxygen of the source water used by plants. Marine organisms use sea-water for photosynthesis, which has
a modern value close to 0%o whereas the source water for
photosynthesis on land is taken from the leaves. The/5•O of
leaf water depends
on many local parameters
such as the /5•O
of water in the soil and in the atmosphere which are difficult to estimate with accuracy. For example, soil water comes from precipitation and has already fractionated during atmospheric processes [douzel et al., 1987]. In addition, fractionation processes occurring at the surface of the leaf, including equilibrium and kinetic effects, depend on temperature and relative humidity [Craig and Gordon, 1965]. These processes lead to values higher than 0%o for the photosynthetic /5•O coming from most of the terrestrial biosphere, and therefore they contribute to enhance the global Dole effect. Bender et al.
[1994a] also mentioned that the isotopic exchange between
CO2 and O2 in the stratosphere slightly lowers •18Oatra (by •- 0.4%o). Accounting for the terrestrial and marine Dole effects (and for the slight stratospheric diminution of this effect),
these authors obtain a best present-day estimate of 20.8%o and
note the difficulty of correctly predicting the observed value of 23.5%0 [Kroopnick and Craig, 1972]. This difficulty of accounting for present-day observations should be kept in mind when interpreting past •18Oatra changes.
These past changes depend first on changes in /5•8Osw. This is because the isotopic composition of the ocean directly impacts on the marine biosphere (photosynthesis) but also because the isotopic content of continental precipitation is influenced by changes in the isotopic content of surface sea water, particularly in the tropics [douzel et al., 1994] where
much of the terrestrial
photosynthetic
production
of O2 occurs.
Paleoclimatic records of/5•Osw show variations over time as a result of the growth and decay of the continental ice sheets.
During glacial periods the atmosphere is enriched in •O
relative to modern values, just like the ocean. It is not
surprising that •18Oatra tracks/5•O,w at least when no change in
the biospheric activity is assumed [Sowers et al., 1991; Bender et al., 1985]. We should, however, note that the
change in the isotopic content of surface waters which mainly drives the change in the marine Dole effect (except for a small fraction occurring within more isolated parts of the ocean) [Bender et al., 1994a] may differ from the change in the mean isotopic content of the ocean, in particular, at the time of
meltwater events [Leuenberger, 1997].
In addition to changes in /5•O•w, other processes could influence the isotopic composition of the atmospheric oxygen [Sowers et al., 1991]. First, changes in the /5•80 of leaf water
would lead to a modification of /5•8Oa•m from terrestrial
photosynthesis. Such changes may come from changes in the hydrological cycle leading to changes in the /5•O of precipitation or from changes of environmental parameters,
such as humidity [Craig and Gordon, 1965]. Second, a change in the ratio between terrestrial and marine productivity
would lead to a variation of the Dole effect. For example, some
authors have suggested that the terrestrial primary production,
affected by changes in climate parameters and possibly in the
CO2 levels, could have been reduced by 25% with respect to
the present time during the last glacial period [Meyer, 1988].
Since the terrestrial contribution to the Dole effect is more
positive than the marine one, a decrease of the ratio between
terrestrial and marine productivities would decrease the Dole
effect. The problem is further complicated by the strong latitudinal dependency of the land Dole effect, which results
primarily from the decrease of the /5•O of precipitations with
latitude. For example, an increase in the high-latitude/low- latitude ratio of the terrestrial productivity would lead to a
decrease of the Dole effect (keeping unchanged this terrestrial
productivity). Third, a parameter concerning possible changes
in the land respiration factor should be considered, for this factor, as pointed out by Leuenberger [1997], may be itself climate dependent.
3. The 618Oat
m Vostok Record
Five boreholes have been drilled at the Russian station
Vostok (East Antarctica). In their study, Bender et al. [1994a] used samples from the 3G core only. We use here a compilation of measurements performed on samples from 3G, 4G, and 5G
cores [Sowers et al., 1991, 1993; Bender et al., 1994a; douzel et al., 1993, 1996] to obtain a detailed record of the •18Oatra
over two climatic cycles. All these isotopic data have been obtained at the Graduate School of Oceanography, Rhode Island, following the extraction method and the analytical
procedure established by Sowers et al. [1989]. All the /5•sO
measurements have been corrected by using /5•5N
measurements, for the gravitational fractionation occurring in
the tim [Sowers et al., 1989]. This also accounts for the
thermal fractionation, if we assume that both processes lead to effects having an amplitude about twice larger for/5•sO than for /5•5N (according to Severinghaus et al. [1996], the thermal
diffusion factor of pairs is of 0.0107 and 0.0069 for oxygen and nitrogen isotopes, respectively). Indeed, the estimate of the
thermal fractionation factor for nitrogen isotopes may be twice lower (J.P. Severinghaus, personal communication, 1998),
which means that only part of the correction due to thermal diffusion is taken into account for oxygen isotopes. On the other hand, effects due to thermal fractionation are very small for air bubbles trapped in the Vostok ice as there is no rapid temperature change at this site and as the associated error is
negligible. For our compilation of the •18Oatm records, we
account for the largest uncertainty of the three data sets available, i.e., 0.075%o.
A comparison of ash layers found in these three different
cores reveals slight differences (up to 3 m) between depths of
similar events recorded in 3G, 4G, and 5G. To combine the three records in one unique stack, we account for these slight
differences in depths. The final record consists of 242 evenly
spaced data points which provide a high-resolution record covering the last 240 kyr, with roughly one point every thousand years. The mixing time of the oxygen in the
atmosphere has been estimated around 1.2 kyr [Bender et al.,
1994a; Sowers et al., 1993]. This record can therefore be considered as representative of the global isotopic
MALAIZE ET AL.: THE DOLE EFFECT OVER TWO CLIMATIC CYCLES 14,201
composition of the oxygen. This is further supported by the
fact that the same •180atm signal is observed, on the first
climatic cycle, in the Greenland Ice Sheet Project 2 (GISP2) ice core in central Greenland [Bender et al., 1994b].
4. Estimating the Dole Effect
Following the approach of Sowers et al. [1993], we use the
carbonate •5•gO record of benthic foraminifera from the V 19-30 deep sea core, in the Pacific Ocean [Shackleton and Pisias,
1985] to estimate past variations of the •5]gOsw. This record,
dated by orbital tuning, has been chosen because it is a deep record situated far from any area of cold deep water formation (such as the North Atlantic) and thus should give a realistic
picture of global •5•Osw variations. Nevertheless, even deep
sea waters could have suffered small temperature variations,
hence inducing some carbonate isotopic composition
variations. We account for the influence of bottom water
temperature changes in extending to the second climatic cycle
the correction proposed by Sowers et al. for the first climatic
cycle. The V19-30 •5•O record is linearly scaled in such a way
to have values of 0%o and 1.15%o for the Holocene and the Last Glacial Maximum, respectively. By using this benthic record for estimating the marine Dole effect, we assume that these
corrected •5•Osw variations only reflect past sea level
variations and therefore can be considered as a global signal.
This should be a correct assumption except at the time of large
meltwater events [Leuenberger, 1997].
We have calculated the ADole effect for three different
Vostok timescales. The orbitally tuned timescale (OTT) is derived from an orbital tuning approach consistent with the SPECMAP marine timescale [Waelbroeck et al., 1995]. The
second timescale, called the extended glaciological timescale
modified (EGTmod), is based on a linear modification of the bottom part of the previous EGT Vostok glaciological timescale to get an age corresponding to marine stage 7.5 (- 240 kyr B.P.) for a depth of 2755 m [Jouzel et al., 1996]. The
difference between these two timescales, giving the age of the
ice, never exceeds 5 kyr. As air bubbles found in the Vostok
ice are isolated from the surface several thousand years after the
snow deposition, the gas trapped in the ice is younger than the surrounding ice. We calculate the difference between ice age and gas age using the model developed by Barnola et al.
[1991], which takes into account climatic parameters specific
to the deposition site (surface temperature or accumulation rate).
The third timescale, based on isotopic correlations (ICT),
gives directly an estimate of the age of the gas ; it simply
extends the approach adopted for the first climatic cycle by Sowers et al. [1993], who proposed to get a Vostok gas age chronology considering that after accounting for the
atmospheric reservoir effect, changes in •5]•Oa•m and •5•gO•w are
in phase (thus minimizing the difference between both records,
i.e., the ADole signal). The largest differences (- 7 kyr) are
observed between ICT and EGTmod during marine isotopic stages 5 and 7. We should keep in mind that the ICT timescale results in minimizing the Dole effect. The valididy of these
different timescales will be discussed further in this paper by
comparing our Dole effect results with other paleodata. According to these three different chronologies, the •18Oat m
record now covers approximately the last 240 kyr, enabling us
to extend the study of the Dole effect to the penultimate
• '""l
I
I
I
I
-0.s . ..:'• ? .•_, ,:•' i' , ... 0.0 +0.5 • i I ßg•
c
,,', :, ,"
, ,, ,, ,
7.30.0 -
7.1
7.5 I
0.4 - 6.5 0,8 - I I 0 50 100 I I I 150 200 250 Age (kyr B.P. ) - 520 - 500 480 - 460 - 440- 0.0
- 0.4
- 0.8
'-- 1.2
Figure 1. Variations with time of (a) the summer solstice
insolation (June 21) at 20øN [Berger, 1978], (b) the Dole effect as calculated from /5]SOa•m and /5•SO•w records, (c) the •18Oat m record from gas analysis of the Vostok ice core dated
with gas age timescales, (d) the /5•SO•w record from the V19-30
core modified as described in the text, and (e) the mean atmospheric temperature at the Vostok site (Antarctica)
(EGTmod timescale) as deduced from the ice deuterium content
[Jouzel et al., 1996]. The solid and dashed lines in figures 1 b and 1C are for the Dole record calculated using the /5•SOatm
record dated with the extended glaciological timescale modified (EGTmod) and the isotopic correlation timescale (ICT) respectively. The annotations in figure l d give the
different stages as defined by Martinson et al. [1987].
glacial-interglacial cycle. Figure 1 shows the ADole records over the last two climatic cycles for two different Vostok
timescales, i.e., EGTmod [Jouzel et al., 1996] and ICT
timescales (OTT and EGTmod giving almost similar results).
Both records used to calculate these Dole effect variations, i.e.,
8•SOatm and /5•SO•w, are also represented in figure 1 as well as
the June 21 insolation at 20øN. We follow Bender et al.
[1994a] in using this low-latitude signal in which the
precessional parameter can easily be seen for comparison with
insolation. As already pointed out by •ouzel et al. [1996]
using EGTmod, there is a striking similarity between 8•SOatm
and this insolation curve, which holds true whatever the timescale used.
For the last glacial-interglacial cycle we calculate a mean
variation of the Dole effect (taken with respect to the present-
day value) of-0.08%o with a standard variation of +0.27%o. Bender et al. [1994a] calculated a mean variation of-0.05%o,
with a standard deviation of +0.24%o. These minor differences
14,202 MALAIZE ET AL.' THE DOLE EFFECT OVER TWO CLIMATIC CYCLES timescales and different ice samples used for the •18Oat m record.
Our general conclusion is quite similar to the previous study:
The Dole effect remains relatively stable over the last 130 kyr. The amplitude of the variations stays roughly in a +0.5960 interval, except for the last two glacial terminations. For the penultimate climatic cycle, four events are clearly defined. All of them can be related to an insolation maximum: the first one
around 145 kyr B.P. (stage 6.3), the second one at 175 kyr
B.P. (stage 6.5), the third one around 195 kyr B.P. (stage 7.1), and the fourth one around 220 kyr B.P. (stage 7.3).
A spectral analysis of the complete record confirms that a precessional signal can be extracted fi'om the ADole record (Figure 2) and also gives a better statistical confidence (Table 1) than in the previous study of Bender et al. [1994a]. For the
precessional periodicity these authors calculated a f statistic
of 0.93. We found a f statistic of 0.995 for EGTmod, 0.994 for
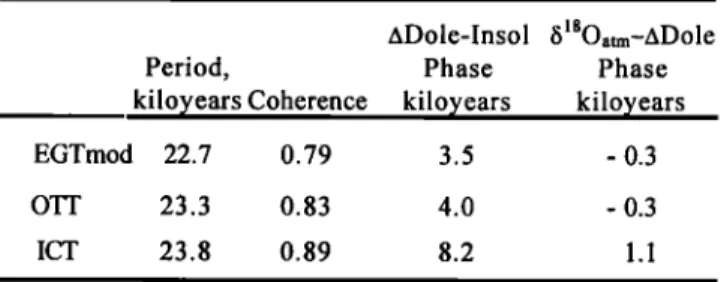
OTT, and 0.999 for ICT. A cross-spectral analysis (Blackman- Tuckey method) between the ADole record and the summer solstice insolation at 20øN shows also a good coherency between both signals (Table 2 and Figure 2). The maximum coherency is obtained around 23 kyr, with the ADole signal
lagging the insolation. This lag is - 3.5 - 4 kyr for either OTT
or EGTmod while it is of the order of 8.2 kyr for ICT (Table 2). The two extreme values (i.e. 3.5 and 8.2 kyr) define the phase
lag uncertainty linked to the timescale used. In section 5.2, we
will use these extreme mean values to compare our results with
previous studies.
When looking more precisely at individual features of the
ADole record, we have to be very careful at the representativeness of each event as some of them could be
artificially created by uncertainties in deep sea core versus ice
core chronologies. Nevertheless, the "strong event" at stage 6.5 keeps its very low value independently of the timescale
used. Bender et al. [1994a] showed that subtracting several thousand years to a timescale could change not only the timing of events in the ADole effect record but also their amplitude. To better evaluate these uncertainties, we follow
the same approach, by performing sensitivity studies in
modifying the Vostok timescales used. We added and subtracted 5 kyr to these timescales and recalculated the
ADo,
le record
keeping
the marine
timescale
unchanged.
The
results are presented in Figure 3.
1500
4 •
•] '•'X
I Cross-Spectral
Analysis
I
20 500 t cb 10 0 Insol '-0o.0 __
,...-,--
-,,
0.6• 0.4 80%
',, .,''',..,'-
0.2 0.0 0 20 40 60 60 100 120 .10Frequency (Cycte kyr )
Figure 2. Blackman-Tuckey cross spectral analysis. (top) The
spectra of /XDole records (calculated with three different
timescales) and of the summer solstice insolation signal at 20øN. Dashed lines are for results obtained using the orbitally
tuned timescale (OTT)and the ICT timescales. (bottom) The coherency between the insolation record and these /xDole
records is shown below. Horizontal lines represent the non
zero coherency (80% and 99% confidence levels).
Table 1. Spectral
Analysis
of the ADole and •18Oatm
Records
for Each Timescale.
EGTmod OTT
ICT
ADole 8•80
Period, Period,
kilo7ear,
s •f Statistic kiloyears f Statistic
23.8 0.9949 23.8 0.9992
23.8 0.9939 23.3 0.9995
23.8 0.9997 23.3 0.9998
The multitaper method has been used to obtain the results [Paillard
et al., 1996]. EGTmod, extended glaciological timescale; OTT, orbital
tuned timescale; ICT, isotopic correlation timescale.
Most events have their amplitude strongly affected by these timescale modifications. Nevertheless, each oscillation of the ADole record remains, with a time shift consistent with the modifications. ADole values during stage 6.5 always exhibit a
remarkable minimum, with a value below -0.6 to -0.859/0o. A
closer look at the marine record can easily explain this
persistent feature. During stage 6.5 the marine record does not
show any large variation, while a strong minimum is clearly
present in the atmospheric record (Figure 1). The difference between the two records is thus entirely insensitive to changes in the ice core chronology. These exceptionally low values of the Dole effect during stage 6.5 correspond to a
particular event which has no counterpart during the first glacial-interglacial cycle. The amplitude of the other ADole
excursions may not be as reliable.
Meanwhile, we note that amplitudes of precessional variations in the 818Oat m record are always larger than the ones
in the marine record. The difference must therefore be
significantly different from zero in this frequency band. Although this has to be considered with caution since the
8•80,w record deduced from the V19-30 core may not give a realistic picture of real 8•80,w variations (see section 4 ), the
significant precessional variation in the ADole signal is further supported by the cross-spectral analysis between
818Oatm and ADole. Both records are in phase within 1.4 kyr (Table 2), showing that the ADole signal is dominated by the
atmospheric isotopic variations.
We further investigate the phase relationship obtained
Table 2. Cross-Spectral Analysis Between the /XDole Record Reversed and the Record of the Average June Insolation at
20 ø N.
aDole-Insol 8•8Oatm-ADole
Period, Phase Phase
kiloyears
Coherence kiloyears
kiloyears
EGTmod 22.7 0.79 3.5 - 0.3
OTT 23.3 0.83 4.0 - 0.3
ICT 23.8 0.89 8.2 1.1
A Blackman-Tuckey method has been used for this cross spectral
analysis [Paillard et al., 1996]. We used the reversed ADole record in
order to associate minima of ADole record with maxima of June
insolation (Insol). In the last column we calculated the phase between
MALAIZE ET AL.: THE DOLE EFFECT OVER TWO CLIMATIC CYCLES 14,203 I I I
520
,
;
,
500 ;a
480 • z 460 c::440
ß•
b
-0 5
.E'•
' oo
o .E_
5-+0.5
,
o
0,
g
]
- o.o
E •
-+0.5
• • --0.5•
-0.0
E o
ø
-+0.5
i:- •
-+I.0
0 50 100 150 200 250 Age (K. yr B.P.)Figure 3. (a) The summer solstice insolation at 20øN [Berger, 1978]. The sensitivity of the ADole record to changes in timescales, this record being calculated (b) with the EGTmod timescale [douzel et al., 1996] and the ICT timescale (dashed line), (c) in adding 5 kyr to the Vostok timescales (see text), and (d) in subtracting 5
kyr.
between ADole and June insolation records, by filtering each ADole record around the 23 kyr frequency and calculating the
time lag between each minimum in the ADole and each
a k , , , , I , , , ,
5.3
5.5 h 7.1f•
7.3;i
• 7.5
5.1
"• 6,3 , i l i• .,
+0.2 - .... I .... I .... I .... I .... 0 • 1 • 1 • 2• 250 Age EGT (kyr B.P.)b -0.2- -0.1 0.0 0.1 0.2 .... I , , , , I , , , , I , 6.5, , I , , , ,
! 5.3 5.5
A 7.1
• ?..
520 ½
5. 4 '•' 63 /1' •[: 73!; 7.5,., ,., ,.,
!! ß
i!
•/ •0 •
.
•o •
' ' ' ' i .... i .... i .... I .... 0 • 1 • 1 • 200 250 Age lOT (kyr B.P.)maximum in the insolation signal (Figure 4)(Table 3). As the uncertainties, both in the absolute and relative Vostok and V19-30 chronologies, influence the estimation of these lags (see Figure 3), individual time lags are associated with a large
uncertainty,
probably of the order of + 5 kyr. Bearing
this in
mind, it is nevertheless interesting to look at the distribution pattern of these lags versus time. Changes in the June insolation intensity generally lead to changes in the Dole effect, exoept for the event occurring around 220 kyr B.P., which probably results from dating problems in the deep part of the Vostok core. These time lags are consistent with spectral analysis results with approximately constant values along the whole record when using ICT. This comes as no surprise, since this chronology was built assuming a constant phase between
Figure 4.
Time lags between the ADole record and the summer solstice insolation signal at 20øN. The ADole records have been filtered around 23 kyr with a bandwidth of 0.04 cycles per kiloyear. Time lags between ADole minima and each insolation
maxima are shown in Table 3. The dashed line is for the
insolation signal. The solid lines are for (a) the filtered record of the ADole using the EGTmod timescale [Jouzel et al, 1993 ] and (b) the filtered record of the ADole using the ICT timescale. The annotations give the different stages as defined by
14,204
MALAIZE
ET AL.: THE DOLE
EFFECT
OVER
TWO CLIMATIC
CYCLES
marine
and atmospheric
isotopic signals. On the contrary,
EGTmod and OTT tend to indicate a systematic
phase
difference
between
glacial
and interglacial
periods
with larger
lags during glacial times (3.5 - 11 kyr) than during stages
5
and 7 (-2- 3 kyr).
5. Discussion
The main
features
of the complete
ADole record
in the past
are the following. Except for stage 6.5, where the Dole effect
reaches
a minimum
value down
to -0.85%0,
variations
are quite
small with respect to present-day Dole effect. Mean variations are no larger than 0.5%0 in comparison to the present 23.5%0
enrichment.
These variations have a clear precessional
periodicity of-• 23 kyr, with maxima in the northern latitude summer insolation (20øN) followed by minima in the Dole
effect
with mean
time lag values
between
3.5 and 8.2 kyr (Table
2). To explain the remarkable constancy of the Dole effect, we
discuss
the main changes
in the global biospheric
activity
between interglacial and glacial periods. Then we focus on small variations of the Dole effect and examine climatic
changes driven at low northern latitudes by summer
insolation changes.
Finally, we suggest a hypothesis
to
explain
the exceptional
"Dole event" around
175 kyr B.P.
5.1. Glacial-interglacial variations
When the Earth enters a glaciation, climatic changes have an impact on both continental and marine biospheres. Many environmental parameters are changing, and the resulting effect on the global Dole effect is nontrivial. The dramatic drop in global temperature allows huge ice sheets to cover part of the
Northern Hemisphere continents. The high-latitude terrestrial biospheric extension is then reduced, while the low-latitude one may eventually get enlarged by the newly emerged continental margins, thus moving the overall terrestrial
biomass closer to equatorial areas. This general migration may
induce an increase in the terrestrial Dole effect since
precipitations are isotopically heavier in low latitudes than in high latitudes. In this line, we note that simulations of the distribution of water isotopes at the Last Glacial Maximum
suggest that the isotopic content of the precipitation was then higher in tropics and subtropics than it is for present-day climate [Jouzel et al., 1994; Hoffmann et al., 1999], probably as a result of some "compensation effect" between high and low latitudes [Jouzel et al., 1998]. This would tend to further increase the Dole effect. But much colder temperatures will also reduce notably the •5•80 of precipitations, at least in mid latitudes and high latitudes [Jouzel et al., 1994], thus
counteracting the previous change. Glacial climate is also
drier and has a lower pCO2 [Barnola et al., 1987]. Less humidity in the glacial atmosphere has a direct impact on the
•5•80 of water in the leaves, rising its isotopic composition
[FOrstel, 1978] and consequently the Dole effect. A lower CO2
would reduce the overall terrestrial primary production and thus lower the Dole effect [Jolly and Haxeltine, 1997]. On the other hand, a lower COa concentration during glacial period would have increased the photorespiration/carboxylation ratio and therefore raised the Dole effect (see for more details, Bender et al. [1994a]). To quantify all these counterbalancing effects, simulations of the terrestrial Dole effect, developed in different laboratories [Hoffmann et al., Past changes in ocean and land productivity as inferred from variations in the Earth's Dole effect, submitted to Science, 1999](hereinafter
referred to as Hoffmann et al., submitted manuscript, 1999) are
necessary to better understand the contribution of the
continental biosphere to the global Dole effect.
Modifications
of the oceanic
Dole effect
are probably not
coming from changes in fractionation factors involved but
more likely from variations in the primary production. In their previous work, Bender et al. [1994a] made a complete overview of most studies of marine paleoproductivity.
Analysis of tracers in low-latitude sea sediment cores seems to
show a higher ocean productivity during the Last Glacial Maximum [Sarnthein et al., 1988; Marino et al., 1992], together with stonger upwellings [Molfino and Mcintyre, 1990; Mix, 1989]. A direct consequence would be a decrease of the Dole effect. On the other hand, a decrease of the highly
productive continental shelves area as a result of the sea level
lowering would lead to a decrease in the global marine production and then to a higher Dole effect.
To sum up, most of the changes which occur in the biospheric activity, as well as the modifications of fractionation factors, have competing influences on the Dole effect. The rough constancy of the Dole effect suggests that the
effects
of all these
mechanisms
on the •O of the atmosphere
stet
almost perfectly counterbalanced.
5.2. Precessional Variations
While the ADole record does not show significant
fluctuations associated with the 100 kyr main glacial cycle,
the precessional frequency of 23 kyr is clearly present, which suggests a low-latitude mechanism. We therefore investigate the response of marine and terrestrial biospheres to changes in
insolation in the low northern latitude band. Higher summer insolation has a different impact on the atmosphere over continents than it does on the atmosphere over oceans. It
creates different pressure systems and leads to stronger winds in regions such as West Africa, Southwest Asia, the Arabian
Sea, and the west coast of South America. It also creates higher
evaporation over the oceans, enhances humidity in the atmosphere, and produces overall stronger precipitations. Such variations can be seen in paleorecords of tracers such as methane [Chappellaz et al., 1990] as well as in simulated paleoclimates [Prell and Kutzbach, 1987]. These phenomena are associated with high monsoons occurring in the low- latitude band. They can even be detected in sediments in the
Mediterranean Sea: stronger precipitations, issued from strong
East African monsoons, produced large discharges of
freshwater in the Mediterranean basin. These fYeshwater layers
on the Mediterranean surface stop the vertical mixing of waters
and create anoxic environments, which leads to a deposit of
organically enriched sediment layers, known as sapropels [Kallel et al., 1997]. The monsoon index has to exceed a certain limit to create sapropel in the Mediterranean Sea. Therefore each sapropel layer is associated with a strong
monsoon event [Rossignol-Strick, 1983].
For the terrestrial biosphere a direct consequence of
stronger precipitation is to increase the productivity. Since the low-latitude terrestrial biosphere drives •5•8Oatm toward higher values, we expect then the Dole effect to rise. However, higher humidity also minimizes the fractionation factor in the
leaf water. Once again, both mechanisms have an opposite
effect on the global Dole effect, and the influence of each phenomenon is difficult to quantify.
For the marine biosphere, recent studies tend to prove that monsoons have an impact via the stronger winds that they
MALAIZE ET AL.: THE DOLE EFFECT OVER TWO CLIMATIC CYCLES 14,205 create. Ruddiman and Mix [1993] have worked on sea surface
temperature (SST)records in the Atlantic Ocean. They made
two temperature reconstructions, at 6 and 9 kyr B.P., and
found colder temperatures around the west coast of Africa
(Guinean Upwelling). These authors concluded that the
intensity of this upwelling might have been higher at these
time periods. Results obtained at 9 kyr were the most convincing ones. Prell et al. [1990] also showed an increase of the upwelling field in the northwestern Indian Ocean, at around 9 kyr B.P. According to climate model simulations
[Prell and Kutzbach, 1987], this time period corresponds also to a maximum monsoon intensity. More likely, high monsoon
intensity could create stronger trade winds, which could
increase upwellings already existing in the low-latitude band. As the marine productivity is directly linked to the supply in nutrients, higher upwellings enhance the marine productivity. A large part of the global marine productivity is concentrated in the upwelling areas. We could then assume that such
phenomena would have a global impact and would decrease
the Dole effect.
Each monsoon maximum is related to a maximum of the summer insolation signal [Prell and Kutzbach, 1987;
Clemens and Prell, 1990] by enhancing the pressure gradient
over continents and marine areas. If we consider the summer
solstice insolation signal taken at 20øN as a reference, its last maximum intensity occurred around 11.5 kyr B.P. The
strongest monsoon recorded around 9 kyr B.P. can be related
to the solstice insolation signal with a lag of-• 2.5 kyr (which means that it is in phase with the insolation at the end of July). This observation is compatible with our investigation of the phase relationship between our ADole record and the insolation signal. Indeed, in our analysis we observe a minimum in the ADole Vostok record lagging the maximun 20øN insolation signal (taken in June) with a mean time lag of 3.5 or 4 kyr using the EGT or OTT timescales (but 8.2 kyr using the ICT timescale; compare mean values in Tables 2 and 3). Since the reservoir effect of the atmospheric •5•80 is of the order of 1.2 kyr, our results are therefore in good agreement with this monsoon hypothesis, at least when using the EGT
and OTT scales.
But Clemens and Prell [1990] have worked on several
components of sediment cores from the Arabian Sea, which are
also influenced by summer monsoon. They calculated a general lag of 9 kyr between the summer solstice insolation and the maximum lithogenic grain size, which they believe is representative of the summer monsoon wind strength. Their monsoon indicator is therefore in phase with mid-November
insolation. In contrast to the Holocene data, this larger time
lag is more comparable to the lag we found using the ICT
timescale, or to the "glacial-time" time lag. In a new study in
the same area, Clemens et al. [1996] have found a time lag
between 6 and 12 kyr, depending on the proxy used. This example highlights the difficulty of comparing different
monsoon proxies, even in the same area of the ocean, and
therefore the difficulty of defining a reliable monsoon
maximum. A further difficulty arising in the study of local
marine records is that they may be influenced by geographic shift of the monsoon as well as by its intensity, thus further
complicating the interpretation of lags.
In this last study, Clemens et al. [1996] have also shown that this time lag has not remained constant throughout the Plio-Pleistocene but could have been influenced by the
progressive ice sheet buildup over the last 3.5 million years.
This may be consistent with our finding that the lag of the Dole effect with respect to precession appears to be larger
during glacial periods. We should bear in mind that this lag
difference could be symptomatic of a systematic chronology
offset between ice core and deep sea cores or between these records and insolation changes. However, it can also
represents a real feature of the variations of the Dole effect. A
possible explanation would involve a shift in the timing of the
summer monsoon. It has indeed already been suggested that
the monsoon could be delayed by several weeks or even months in glacial periods, in particular, because of a more
important seasonal extent of snow and ice cover over Tibet and
Eurasia [Barnett et al., 1989]. The timing of the monsoon could also be influenced by many other environmental parameters, like sea surface temperatures, CO2 levels, or
vegetation changes. A late monsoon in glacial time would respond to a seasonal insolation maximum in late summer,
instead of early summer. On a precessional phase wheel a 1-
month difference represents a lag of 1.9 kyr (one twelfth of 23
kyr). Such a seasonal shift for the monsoon could therefore
explain our observed larger time lag during glacial periods.
Furthermore, if we assume that a sizeable monsoon can occur
only above a specific threshold of the summer insolation, such
a threshold would be reached a few thousand years later in glacial periods since the summer insolation values are then significantly lower. It is also worth noticing that a larger time
lag is expected during glacial periods if the size of the
terrestrial biosphere was reduced at this time, as it has been
suggested [Meyer, 1988]. Indeed, the 1.2 kyr turnover time of the atmospheric oxygen [Sowers et al., 1993] is linked to the
magnitude of the oxygen flux between the biomass and the Table 3. Time lags between ADole and insolation records
Marine
stages 1.1
3.1
3.3
5.1
5.3
5.5
6.3
6.5
7.1
7.3 Insol - EGT 9.5 7.5 11 2' 3* 3.5 6 3.5 1.5' kiloyears , -2 Insol- OTT 9.5 9 8.5 3' 2.5* 4.5 3.5 4 6.5 kiloyears -2.5 Insol - ICT 11 8.5 10 8 8.5 8.5 7 5 8 8 kiloyears*Time lags below 3 kyr occur during marine stages 5 and 7.
For each minimum in the ADole signal corresponding to a maximum in the June insolation signal, we calculate a time lag between both records. Bold characters are for lags below 3 kyr and are systematicaly during marine stages 5 and 7. The mean time lag values are the results of the cross spectral analysis presented
in Table 2.
Mean 3.5
14,206 MALAIZE ET AL.: THE DOLE EFFECT OVER TWO CLIMATIC CYCLES
atmosphere and therefore to the overall size of the biomass.
However, a threefold or fourfold reduction in overall biomass
should be invoked to explain all the observed lag difference,
which is certainly unreasonable.
Although an increasing number of works suggest a direct
link between the insolation signal and marine productivity
[Beaufort et al., 1997], the problem is far fi'om being solved. Besides, past marine productivity reconstructions are still an extremely difficult problem. Many other parameters might also play a role in this respect. For future studies of the Dole effect
it is necessary to better understand the relative importance of
each mechanism.
5.3. The Stage 6.5 Event
A remarkable feature of the record, still to be explained, is the large ADole event occurring at 175 kyr B.P. During this
stage 6.5 the •5•8Oa•m record reaches a minimum, whereas no
drastic variation is clear in the •5•8Osw record. This leads to a
minimum value of the Dole effect of- 0.85%0, which is larger
than all other variations observed over the whole record. To
explain this event, we note that two specific conditions, both
having a decreasing impact on the global Dole effect, did occur
simultaneously.
First, a strong monsoon event probably occurred around
175 kyr B.P., stronger than that during the first climatic cycle
at an equivalent stage of the glaciation (i.e., 33 kyr B.P. and 61 kyr B.P.)[Rossignol-Strick, 1983]. Indeed, the summer insolation signal at 20øN was much more intense at around 175 kyr B.P. than it was during marine isotopic stages 2, 3,
and 4. This high insolation might have been responsible for an
intense monsoon. The hypothesis was proposed recently by Mdlibres et al. [1997], based on the existence of a concurrent sapropel layer (called S6) that these authors have correlated
with the minimum of the •5•aOa•m record occurring at about the
same time. Instead, no sapropel layer is found during the last
glacial period between 70 and 15 kyr B.P. We suggest that this intense monsoon increased the marine productivity, therefore lowering the Dole effect.
Second, one should consider the glacial conditions existing around 175 kyr B.P. Foraminifera and pollen content, analyzed in this sapropel S6, are characteristic of glacial conditions [Mdlibres et al., 1997]. Both low CO2 and low
deuterium
content
[Jouzel
et al., 1993] are indicators
of early
glacial conditions for stage 6.5. According to our hypothesis,
this monsoon would be the only strong one over the last two climatic cycles, occurring under severe glacial conditions.
It is extremely difficult to quantify each factor and its role in
the global Dole effect. In particular, we do not know the
overall influence on the Dole effect of continental biospheric changes (or marine biospheric changes) due to monsoons.
However, a rough estimate can be done to estimate the changes
necessary to get the observed 0.85%0 decrease of the Dole
effect with respect to its present-day value. We start fi'om the values given by Bender et al. [1994a], for the present-day
terrestial and marine productions (20.4 and 10.6, respectively,
in 10 •5 mol/yr). To get the observed value of 23.5%0 for the
present-day Dole effect [Bender et al., 1994a), a value of
18.9%0 for the marine fractionation effect implies a fractionation
factor over land of 26.5%0 (taking into account the stratospheric effects) (see Bender et al. [1994a] for a more detailed discussion). Assuming a 25% decrease of the terrestrial production during glacial periods (and no change
for the marine and land fractionation factors) requires a marine
production
of 12.7 x 10
•5 mol/yr
to get a ADole of-0.85%o.
The
same
approach
has been followed in using model estimates
of
terrestrial and marine productions as simulated by Hoffmann et
al. (submitted
manuscript,
1999). For present-day
climate
these
estimates are much lower than those used by Bender et al. for both terrestrial and marine values (12.1 and 7.6 x 10 •5 mol/yr,
respectively).
The same
assumption
of a 25% decrease
during
glacial
period
then requires
a marine
production
of 8.8 x 10 •5
mol/yr.
In both cases,
if the terrestrial
production
is decreased
by 25% during glacial periods,
the marine
production
has to
increase
by 15-20% to account
for the observed
Dole effect.
It seems difficult, but not unlikely, to consider a strong monsoon with an impact of this size (20% increase) on the
marine productivity. We admit that this calculation is
somewhat
speculative.
For example,
if we were assuming
a land
fractionation factor of 22.4%o as suggested by Bender et al.
[1994a], a doubling of the marine productivity would be
required
to explain
the 6.5 event (thus illustrating
the crucial
need of explaining the present-day Dole effect if we want to infer correct information on past land and marine
productivities).
Additional work in order to corroborate
the
existence of a strong monsoon event during stage 6.5, under
glacial conditions,
is even required.
One possibility
would be
to look at paleoclimatic
tracers
of monsoon
at that particular
time, especially
tracers
of stronger
winds, such as lithogenic
grain
size in sediment
cores
[Clemens
and Prell, 1990]. Other
clues could probably be obtained fi'om atmospheric
and
oceanic
general
circulation
models,
which could be used to
examine the response of upwellings to enhanced low-latitude
insolation.
6. Conclusions
In this article we have reconstructed the Dole effect over
two climatic cycles, i.e., for the last 240 kyr. Generally, the signal stays relatively stable for the whole record. Small variations hardly exceed an amplitude of 0.5%o, except for the two glacial maxima and for one exceptional event, around 175 kyr B.P. These general variations are weak with respect to the present-day value of the Dole effect, around 23.5%o. They
nevertheless show a precessional periodicity, close to 23 kyr,
with a strong link with the insolation signal at low northern latitudes. The June insolation signal leads the ADole record by a mean value ranging fi'om 3.5 to 8.2 years, depending on the timescale used for the reconstruction. To explain the
exceptional decrease of the Dole effect at 175 kyr B.P., down to
-0.85%o, we invoke an unusually strong monsoon, which occurred under glacial conditions. The mechanism linking monsoonal activity and the Dole effect might involve marine productivity, via modulation of upwelling strength.
However, our understanding of the Dole effect and its fluctuations is still strongly limited by the numerous
uncertainties involved. They result not only from
uncertainties in deep sea cores and ice core chronologies but
also fi'om the lack of sufficiently detailed models for many
mechanisms involved within the terrestrial and marine
biospheres. Current modeling of the Dole effect [Leuenberger,
1997] also needs to be improved as exemplified by the difficulty of correctly accounting for its present-day value
[Bender et al., 1994a]. The main problem seems to arise from
the estimation of the /5•O of the water in leaves, which presents a high variability in space and time [Bender et al.,
MALAIZE ET AL.: THE DOLE EFFECT OVER TWO CLIMATIC CYCLES 14,207
1994a; Keeling, 1995]. Despite these difficulties and
limitations, the present extension of the ADole record to the
second climatic cycle further illustrates the interest of this parameter which, providing a better understanding of
mechanisms involved, should give a useful insight on how the
land and marine biospheres respond to climate changes.
Acknowledgements. This research has been supported by the Office of Polar Programs, U.S. National Science Foundation, and European Science Funding project ENV4 CT 95 0130. All the samples are coming from the Vostok core, which is a joint project between
Russia, France, and the U.S.B. Malaiz6 would like to thank M. Bender for his welcome in UP-d, where most of the measurements have been
done. B. Malaiz6 is also very grateful to M. A. M61i6res and G. Hoffmann for their encouragement and comments.
References
Barnett, T.P., L. Dumenil, U. Schlese, E. Roeckner, and M. Latif, The
effect of Eurasian snow cover on regional and global climate
variations, d. Atmos. Sci., 46, 661-685, 1989.
Barnola, J. M., P. Pimienta, D. Raynaud, and Y. S. Korotkevich,
climate relationship as deduced from the Vostok ice core: new
measurements and re-evaluation of the air dating, Tellus, Set. B, 43,
83-90, 1991.
Barnola, J. M., D. Raynaud, Y. S. Korotkevich, and C. Lorius, Vostok
ice core provides 160,000-year record of atmospheric CO2, Nature,
329, 408-414, 1987.
Beaufort, L., Y. Lancelot, P. Camberlin, O. Cayre, E. Vincent, F.
Bassinot, and L. Labeyrie, Insolation cycles as a major control of
equatorial Indian Ocean primary production, Science, 278, 1451-
1454, 1997.
Bender, M., L. Labeyrie, D. Raynaud, and C. Lorius, Isotopic
composition of atmospheric O2 in ice linked with deglaciation and
global primary productivity, Nature, 318, 349-352, 1985.
Bender, M., T. Sowers, and L. Labeyrie, The Dole effect and its variations during the last 130 000 years as measured in theVostok ice core, Global Biogeochem. Cycles, 8, 363-376, 1994a.
Bender, M., T. Sowers, M. L. Dickson, J. Orchardo, P. Grootes, P.
Mayewski, and D. A. Meese, Climate correlation between
Greenland and Antarctica during the past 100 kyrs, Nature, 3 72, 663-
666, 1994b
Berger, A., Long-term variations of daily insolation and Quaternary
climatic change, • Atmos. Sci., 35, 2362-2367, 1978.
Chappellaz, J., J-M. Bamola, D. Raynaud, Y. S. Korotkevich, and C.
Lorius, Ice-core record of atmospheric methane over the past 160,000 years, Nature, 345, 127-131, 1990.
Clemens, S.C., and W. L. Prell, Late Pleistocene variability of Arabian sea summer monsoon winds and continental aridity: Eolian records from the lithogenic component of deep-sea sediments, Paleoceanography, 5, 109-145, 1990.
Clemens, S.C., D. W. Murray, and W. L. Prell, Non stationary phase of
the Plio-Pleistocene Asian monsoon, Science, 274, 943-948, 1996.
Craig, H., and L. Gordon, Deuterium and oxygen 18 variation in the
ocean and marine atmosphere, paper presented at Conference on
Stable I•otopes in Oceanography, Int. At. Energy Agency, Pisa, Italy,
1965.
Dole, M., The relative atomic weight of oxygen in water and in air, d.
Am. Chem. Soc., 57, 2731, 1935.
Dongmann, G., The contribution of land photosynthesis to the stationary
enrichment of •80 in the atmosphere, Radiat. and Environ. Biophys.,
11, 219-225, 1974.
F6rstel, H., The enrichment of '80 in leaf water under natural conditions, Radiat. Environ. Biophys., 15, 323-344, 1978.
Hoffmann, G., V. Masson, and J. Jouzel, Stable water isotopes in
atmospheric general circulation models, d. Hydrol., in press, 1999.
Jolly, D., and A. Haxeltine, Effect of low glacial atmospheric CO2 on
tropical African montane vegetation, Science, 276, 786-788, 1997.
Jouzel, J., G. L. Russel, R. J. Suozzo, R. D. Koster, J. W. C. White, and W. S. Broecker, Simulations of the HDO and H2'•O atmospheric
cycles using the NASA GISS general circulation model: The
seasonal cycle for present-day conditions, J. Geophys. Res., 92,
14739-14760, 1987.
Jouzel, J., et al., Extending the Vostok ice core record of palcoclimate to the penultimate glacial period, Nature, 364, 407-412, 1993.
Jouzel, J., R.D. Koster, R.J. Suozzo, and G.L. Russell, Stable water isotope behavior during the last glacial maximum : A general circulation model analysis, d. Geophys. Res., 99, 25791-25801, 1994. Jouzel J., et al., Climatic interpretation of the recently extended Vostok
ice records, Clim. Dyn., 12, 513-521, 1996.
Jouzel, J., R.D. Koster, G. Hoffmann, and A. Armengaud, Model evaluations of the water isotope/climate relationships used in reconstructing palcotemperatures, paper presented at the International Symposium on Isotopes Techniques in the Study of Past and Current Environmental Changes in the Hydrosphere and the Atmosphere, Int. At. Energy Agency, Vienna, Austria, 1998. Kallel, N., M. Pateme, J.-C. Duplessy, C. Vergnaud-Grazzini, C. Pujol,
L. Labeyrie, M. Arnold, M. Fontugne, and C. Pierre, Enhanced rainfall in the mediterranean region during the last sapropel event, Oceanol. Acta, 20, 697-712, 1997.
Keeling, R., The atmospheric oxygen cycle: The oxygen isotopes of atmospheric CO2 and 02 and the 02/ N2 ratio, U.S. Nat. rep. int. Union Geod. Geophys., 1991-1994, Rev. Geophys., 29, 1253-1262,
1995.
Kroopnick, P., and H. Craig, Atmospheric oxygen: isotopic composition and solubility fractionation, Science, 175, 54-55., 1972.
Lane, G. A., and M. Dole, Fractionatton of oxygen isotopes during
respiration, Science, 123, 574-575, 1956.
Leuenberger, M., Modeling the signal transfer of seawater /5•O to the
/5•O of atmospheric oxygen using a diagnostic box model for
terrestrial and marine biosphere, d. Geophys. Res., 102, 26841-
26850, 1997.
Marino, B., M. McElroy, R. Salawitch, and W. Spaulding, Glacial to interglacial variations in the carbon isotopic composition of atmospheric CO2, Nature, 357, 461-466, 1992.
Martinson, D. G., N. G. Pisias, J. D. Hays, J. Imbrie, T. C. Moore, and N.
J. Shackleton, Age dating and the orbital theory of the ice ages:
Development of a high-resolution 0 to 300,000 year
chronostratigraphy, Quat. Res., 1-29, 1987.
M61i•res, M. A., M. Rossignol-strick, and B. Malaiz6, Relation between low latitude insolation and b'•O change of atmospheric oxygen for
the last 200 kyrs, as revealed by Mediterranean sapropels, Geophys.
Res. Lett., 24,1235-1238, 1997.
Meyer, M. K., Net primary productivity estimates for the last 18,000
years evaluated from simulations by a global climate model, M. S.
Dissertation, Univ. of Wis., Madison, 1988.
Mix, A. C., Influence of productivity variations on long-term
atmospheric CO2, Nature, 337, 541-544, 1989.
Molfino, B., and A. Mcintyre, Precessional forcing of nutricline
dynamics in the equatorial atlantic, Science, 249, 766-769, 1990. Paillard, D., L. Labeyrie, and P. Yiou, Macintosh program performs
time-series analysis, Eos Trans., AGU, 77, 379, 1996.
Prell, W. L., and J. E. Kutzbach, Monsoon variability over the past 150,000 years, d. Geophy. Res., 92, 8411-8425, 1987.
Prell, W. L., R. E. Marvii, and M. E. Luther, Variability in upwelling fields in the Northwestern Indian Ocean, 2, Data-model comparison at 9000 years B.P., Paleoceanography, 5, 447-457, 1990.
Rossignol-Strick, M., African monsoons: An immediate climate reponse
to orbital insolation, Nature, 304, 46-49, 1983.
Ruddiman, W. F., and A. C. Mix, The north and equatorial Atlantic at
9000 and 6000 yr B.P., in COHMAP, Global Climates Changes Since the Last Glacial Maximum, pp. 94-124, 1993.
Sarnthein, M., K. Winn, J.-C. Duplessy, and M. Fontugne Global variations of surface ocean productivity in low and mid latitudes: Influence on CO2 reservoirs of the deep ocean and atmosphere
during the last 21,000 years, Paleoceanography, 3, 361-399, 1988.
Severinghaus, J.P., M.L. Bender, R.F. Keeling, and W.S. Broecker,
Fractionation of soil gases by diffusion of water vapor, gravitational
settling, and thermal diffusion, Geochim. Cosmochim. Acta, 60, 1005-
1018, 1996.
Shackelton, N.J., and N. G. Pisias, Atmospheric carbon dioxide, orbital forcing, and climate, in The Carbon Cycle and Atmospheric C02: Natural Variations Archean to Present, Geophys. Monogr. Ser., vol. 32, edited by E. T. Sundquist and W. S. Broecker, pp. 303-317, AGU, Washington, D.C. 1985.
![Figure 1. Variations with time of (a) the summer solstice insolation (June 21) at 20øN [Berger, 1978], (b) the Dole effect as calculated from /5]SOa•m and /5•SO•w records, (c) the](https://thumb-eu.123doks.com/thumbv2/123doknet/13037071.382189/4.963.498.831.101.537/figure-variations-summer-solstice-insolation-berger-calculated-records.webp)
![Figure 3. (a) The summer solstice insolation at 20øN [Berger, 1978]. The sensitivity of the ADole record to changes in timescales, this record being calculated (b) with the EGTmod timescale [douzel et al., 1996] and the ICT timescale (dashed li](https://thumb-eu.123doks.com/thumbv2/123doknet/13037071.382189/6.963.255.699.83.568/figure-solstice-insolation-sensitivity-timescales-calculated-timescale-timescale.webp)
