HAL Id: hal-01852437
https://hal.laas.fr/hal-01852437
Submitted on 1 Aug 2018
HAL is a multi-disciplinary open access
archive for the deposit and dissemination of
sci-entific research documents, whether they are
pub-lished or not. The documents may come from
teaching and research institutions in France or
abroad, or from public or private research centers.
L’archive ouverte pluridisciplinaire HAL, est
destinée au dépôt et à la diffusion de documents
scientifiques de niveau recherche, publiés ou non,
émanant des établissements d’enseignement et de
recherche français ou étrangers, des laboratoires
publics ou privés.
Dynamic Mechanical Simulation of Miniature Silicon
Membrane during Air Blast for Pressure Measurement †
J Veyrunes, J. Riondet, André Ferrand, M Lavayssière, A Lefrançois, J. Luc,
Hervé Aubert, Patrick Pons
To cite this version:
J Veyrunes, J. Riondet, André Ferrand, M Lavayssière, A Lefrançois, et al.. Dynamic Mechanical
Simulation of Miniature Silicon Membrane during Air Blast for Pressure Measurement †. Eurosensors
2018, Sep 2018, Graz, Austria. pp.9 - 12. �hal-01852437�
Proceedings 2018, 2, x; doi: www.mdpi.com/journal/proceedings
Proceedings
Dynamic Mechanical Simulation of Miniature
Silicon Membrane during Air Blast for Pressure
Measurement
†
J. Veyrunes1†, J. Riondet2,3, A. Ferrand1, M. Lavayssière3, A. Lefrançois3, J. Luc3, H. Aubert2 and
P. Pons2*
1 ICA, Université de Toulouse, Toulouse, France
2 LAAS-CNRS, Université de Toulouse, CNRS, INP, Toulouse, France 3 CEA-DAM, Gramat, France
Emails: [email protected], [email protected], [email protected], [email protected], [email protected], [email protected], [email protected]
* Correspondence: [email protected], 33-5-61-33-64-63
† Presented at the Eurosensors 2018 Conference, Graz, Austria, 9–12 September 2018. Published: date (leave it empty)
Abstract: The development of new ultra-fast sensors for pressure air blast monitoring requires
taking into account the very short rise time of pressure occurring during explosion. Simulations show here that the dynamic mechanical behavior of membrane-based sensors depends significantly on this rise time when the fundamental mechanical resonant frequency of the membrane is higher than 10 MHz.
Keywords: air blast; pressure sensor; dynamic behavior, silicon membrane 1. Introduction
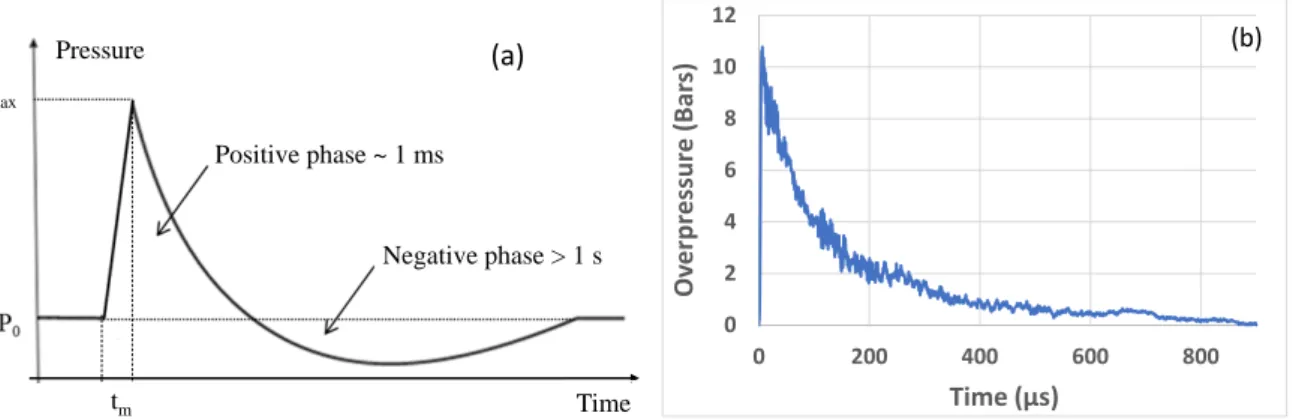
The real time and dynamic measurements of pressure during air blasts is very challenging due to the abrupt variation of pressure from the atmospheric pressure to the so-called overpressure peak
Pmax (between few bars and several ten of bars) with very short rise time tm (< 100ns) (Figure 1). For
accurate measurement of Pmax, sensors with high fundamental mechanical resonant frequency Fo are
then required [1].
When simulating a pressure sensor for which Fo << 1/tm, the rise-time is assumed to be close to zero.
However, we show here that this assumption is no more valid when performing the mechanical
simulation of a sensor for which Fo > 10 MHz.
Figure 1. Typical dynamic pressure variation during an air blast experiment : (a) Illustration of the different
phases and (b) example of pressure measurement at 1m from 1kgTNT by using a Tourmaline piezoelectric sensor. tm Time Pressure Pmax Positive phase ~ 1 ms Negative phase > 1 s (a) 0 2 4 6 8 10 12 0 200 400 600 800 O ve rp re ssu re (Ba rs) Time (µs) (b)
Proceedings 2018, 2, x 2 of 4
2. Sensor description and simulation conditions
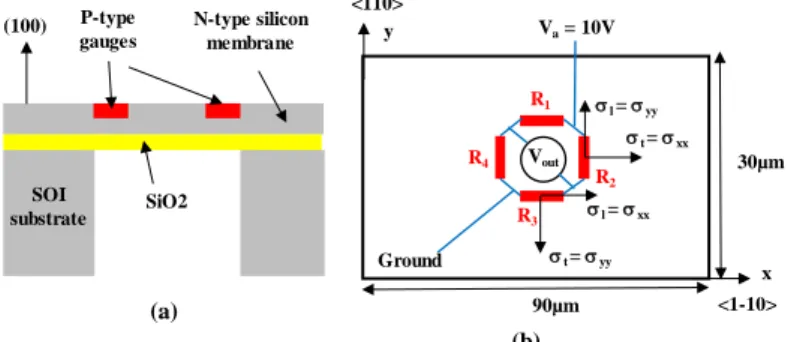
As shown in Figure 2, the proposed sensor is based on a miniature rectangular silicon membrane (5µm*30µm*90µm) with four piezoresistive gauges located at its center [1].
Simulations were performed using Abaqus software [2] for real membrane clamping conditions. Considering the gauges dimensions, the stresses in the gauge areas are close to ones calculated at the membrane center (error lower than 7% on the sensor response). Dynamic behavior of the sensor is then modelled by the differential stress ∆σ given by equation 1 at the center of the membrane, and normalized by the static pressure :
Δ𝜎𝜎 = 𝜎𝜎𝑙𝑙− 𝜎𝜎𝑡𝑡 (1)
where 𝜎𝜎𝑙𝑙 (resp., 𝜎𝜎𝑡𝑡) is the stress applied to the gauge parallel (resp., to the gauge perpendicular) to
the current in the gauge.
Figure 2. a) Cross sectional view of the sensor; (b) Wheatstone bridge on the rectangular membrane.
The fundamental mechanical resonant frequency Fo, obtained from harmonic module of Abaqus
software, is of 32.7 MHz and consequently 1/Fo is close to 30ns.
Due to the short reaction time
t
r of the sensor (< few µs, see Figure 5), we assume here that thepressure profile (shown on Figure 1) can be modelled by the Heaviside step function (the decrease of pressure is lower than 2% after 1µs).
Moreover, assuming that the acoustic damping is predominant [3], the quality factor Q of the
membrane is inversely related to the equivalent pressure Pe applied on both sides of the membrane as
shown in equation 2.
𝑄𝑄 ≅
P 95𝑒𝑒 (𝑏𝑏𝑏𝑏𝑏𝑏) (2)
Abaqus simulations indicates that the pressure Pe is the average pressure applied between the two
membrane sides. Table 1 reports the Q factor for typical applied pressure on one side of the membrane while the other side is in vacuum. We observe that the Q factor decreases rapidly and is lower than 20 for the applied pressure greater than 10 bars.
Table 1. Q factor versus absolute pressure from equation 2.
Pressure (bar) 2 5 10 20 30 40
Q 95 38 19 9.5 6.3 4.8
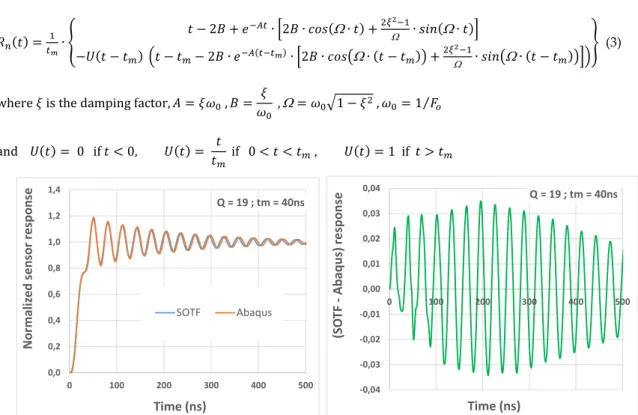
For a shock wavefront normally incident upon the membrane surface, the dynamic mechanical response to a linear variation of pressure was obtained from the Second Order Transfer Function (SOTF) where the rise time differs from zero (Equation 3). This model is consistent with Abaqus simulations results, as it can be noticed from Figure 3. We can observe that the difference is lower than 4% after the rise time. Consequently, the effects on sensor reaction time can be neglected.
N-type silicon membrane P-type gauges SOI substrate SiO2 (100) <110> R1 Ground Va= 10V y x σt = σxx R2 R3 R4 Vout <1-10> σl = σyy σt = σyy σl = σxx (a) (b) 30µm 90µm
𝑅𝑅𝑛𝑛(𝑡𝑡) =𝑡𝑡1𝑚𝑚∙ � 𝑡𝑡 − 2𝐵𝐵 + 𝑒𝑒−𝐴𝐴𝑡𝑡∙ �2𝐵𝐵 ∙ 𝑐𝑐𝑐𝑐𝑐𝑐(Ω∙ 𝑡𝑡) +2𝜉𝜉2−1 Ω ∙ 𝑐𝑐𝑠𝑠𝑠𝑠(Ω∙ 𝑡𝑡)� −𝑈𝑈(𝑡𝑡 − 𝑡𝑡𝑚𝑚) �𝑡𝑡 − 𝑡𝑡𝑚𝑚− 2𝐵𝐵 ∙ 𝑒𝑒−𝐴𝐴(𝑡𝑡−𝑡𝑡𝑚𝑚)∙ �2𝐵𝐵 ∙ 𝑐𝑐𝑐𝑐𝑐𝑐�Ω∙ (𝑡𝑡 − 𝑡𝑡𝑚𝑚)� +2𝜉𝜉 2−1 Ω ∙ 𝑐𝑐𝑠𝑠𝑠𝑠�Ω∙ (𝑡𝑡 − 𝑡𝑡𝑚𝑚)��� � (3)
where 𝜉𝜉 is the damping factor, 𝐴𝐴 = 𝜉𝜉𝜔𝜔0 , 𝐵𝐵 =𝜔𝜔𝜉𝜉
0 ,Ω= 𝜔𝜔0�1 − 𝜉𝜉
2 , 𝜔𝜔0= 1 𝐹𝐹⁄ 𝑜𝑜
and 𝑈𝑈(𝑡𝑡) = 0 if 𝑡𝑡 < 0, 𝑈𝑈(𝑡𝑡) = 𝑡𝑡𝑡𝑡
𝑚𝑚 if 0 < 𝑡𝑡 < 𝑡𝑡𝑚𝑚 , 𝑈𝑈(𝑡𝑡) = 1 if 𝑡𝑡 > 𝑡𝑡𝑚𝑚
Figure 3. Comparison of SOTF model and Abaqus simulation results for the dynamic response
3. Results
Figure 4 displays an example of the dynamic mechanical response of the membrane for rise
time tm up to 100ns and for a Q factor of 19. The response is normalized by the static value. The
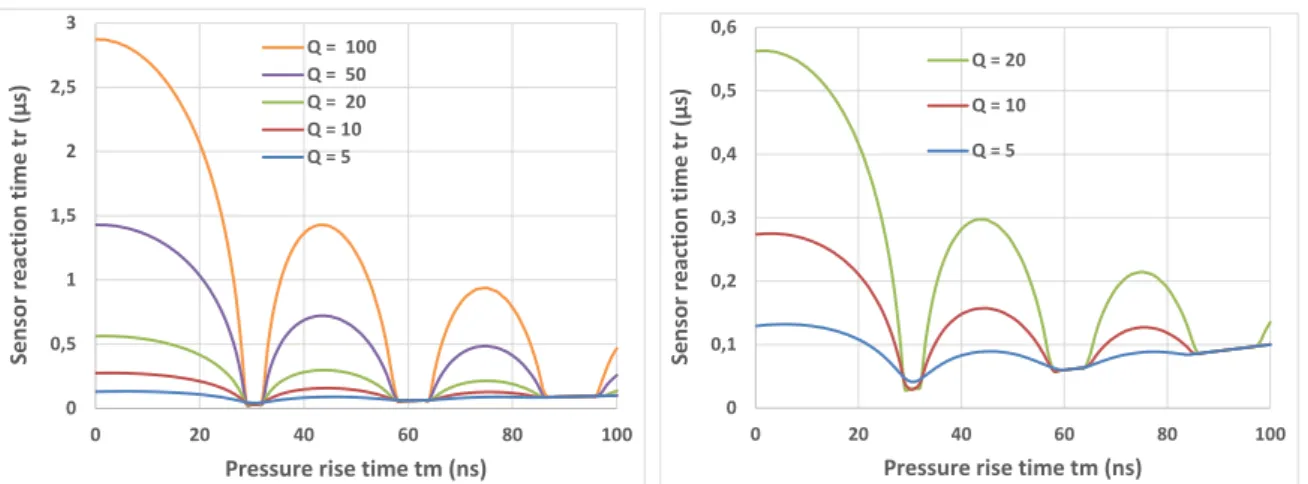
reaction time tr of the sensor (±5% of the static response) is extracted from these figures for Q factor
between 5 and 100 (Figure 5). The following observations can be made:
i. for tm < 1/ Fo, we retrieve the classical damped oscillation for which tr is mainly driven by the Q factor (tr ≅ Q / Fo);
ii. as tm increases, the reaction time tr decreases and, due to the decreasing of the fundamental
mode amplitude (Figure 6), we obtain tr ≅ tm when tm = 1/ Fo;
iii. when tm = n/ Fo where n is a natural number, no oscillation occurs and tr is close to tm; iv. when tm > 1/ Fo, small oscillations appear during the rise time.
The reduction of the reaction time related to the increase of the rise time is given in Figure 7 (reaction
time for tm=0 is taken as reference). We can observe that for pressure rise time tm greater than 20ns,
the sensor reaction time may be underestimated almost by 20% compared with the zero pressure
rise-time (tm=0) assumption. This error may reach 100% when tm is close to n/ Fo.
Figure 4. Dynamic sensor response for different rise times 0,0 0,2 0,4 0,6 0,8 1,0 1,2 1,4 0 100 200 300 400 500 No rm al ized sens or res po ns e Time (ns) Q = 19 ; tm = 40ns SOTF Abaqus -0,04 -0,03 -0,02 -0,01 0,00 0,01 0,02 0,03 0,04 0 100 200 300 400 500 (S OT F -A baq us ) r es po ns e Time (ns) Q = 19 ; tm = 40ns 0,0 0,2 0,4 0,6 0,8 1,0 1,2 1,4 1,6 1,8 2,0 0 50 100 150 200 No rm al ize d se ns or re sp on se time (ns) Q=19 tm=0.1ns tm=10ns tm=20ns tm=30ns 0,0 0,2 0,4 0,6 0,8 1,0 1,2 0 50 100 150 200 No rm al ize d se ns or re sp on se time (ns) Q=19 tm=30ns tm=40ns tm=60ns tm=70ns tm=90ns tm=100ns
Proceedings 2018, 2, x 4 of 4
Figure 5. Sensor reaction time versus pressure rise time for different Q factor
Figure 6. Amplitude of fundamental mode
versus tm (Abaqus simulations results)
Figure 7. Relative sensor reaction time versus
pressure rise time for different Q factors
4. Conclusions
The dynamic mechanical behavior of membrane-based piezoresitive sensors was modelled by a second order transfer function with non-zero pressure rise time. For miniaturized silicon membrane
(5µm x 30µm x 90µm) the fundamental resonant frequency Fo is of 33 MHz. The results show that
pressure rise time tm larger than 1/(3 Fo) plays a crucial role for the accurate estimation of the sensor
reaction time. Consequently, when designing ultra-fast sensors for pressure air blast monitoring, the
increase of frequency Fo for a given rise time is expected to provide a significant reduction of the
sensor reaction time.
Acknowledgments: This work was partially funded by Occitanie Region (France) through the COCNANO
project.
Conflicts of Interest: The authors declare no conflict of interest. The founding sponsors had no role in the design
of the study; in the collection, analyses, or interpretation of data; in the writing of the manuscript, and in the decision to publish the results.
References
1. J. Riondet, A. Coustou, H. Aubert, P. Pons, M. Lavayssière, J. Luc, A. Lefrançois, Design of air blast pressure sensors based on miniature silicon membrane and piezoresistive gauges, Journal of Physics: Conference Series
2017, Volume 922.
2. http://imechanica.org/files/0-overview%20Explicit.pdf
3. A. Prak, F. R. Blom, M. Elwenspoek, T. S. J. Lammerink, Q-factor and frequency shift of resonating silicon diaphragms in air, Sensors & Actuators A 1991, vol. 27, no 1, p. 691‑698.
© 2018 by the authors; Licensee MDPI, Basel, Switzerland. This article is an open access article distributed under the terms and conditions of the Creative Commons Attribution (CC BY) license (http://creativecommons.org/licenses/by/4.0/).
0 0,5 1 1,5 2 2,5 3 0 20 40 60 80 100 Sen so r r ea ct io n time tr (µs )
Pressure rise time tm (ns)
Q = 100 Q = 50 Q = 20 Q = 10 Q = 5 0 0,1 0,2 0,3 0,4 0,5 0,6 0 20 40 60 80 100 Sen so r r ea ct io n time tr (µs )
Pressure rise time tm (ns)
Q = 20 Q = 10 Q = 5 0 0,2 0,4 0,6 0,8 1 0,5 0,7 0,9 1,1 1,3 1,5 Nor m al ize d a m pl itu de Frequency / Fo tm=0.3/Fo tm=0.5/Fo tm=0.8/Fo tm=1/Fo -100% -80% -60% -40% -20% 0% 0 20 40 60 80 100 ∆tr /tr (% )
Pressure rise time tm (ns)
Q = 5 Q = 10 Q = 20 Q = 50 Q = 100