HAL Id: hal-02940646
https://hal.inrae.fr/hal-02940646
Submitted on 16 Sep 2020
HAL is a multi-disciplinary open access
archive for the deposit and dissemination of
sci-entific research documents, whether they are
pub-lished or not. The documents may come from
teaching and research institutions in France or
abroad, or from public or private research centers.
L’archive ouverte pluridisciplinaire HAL, est
destinée au dépôt et à la diffusion de documents
scientifiques de niveau recherche, publiés ou non,
émanant des établissements d’enseignement et de
recherche français ou étrangers, des laboratoires
publics ou privés.
Distributed under a Creative Commons Attribution| 4.0 International License
Quantification of Mitochondrial DNA Deletion,
Depletion, and Overreplication: Application to Diagnosis
Béatrice Chabi, B. Mousson de Camaret, Hervé Duborjal, Jean Paul Issartel,
Georges Stepien
To cite this version:
Béatrice Chabi, B. Mousson de Camaret, Hervé Duborjal, Jean Paul Issartel, Georges Stepien.
Quan-tification of Mitochondrial DNA Deletion, Depletion, and Overreplication: Application to
Diagno-sis. Clinical Chemistry, American Association for Clinical Chemistry, 2003, 49 (8), pp.1309-1317.
�10.1373/49.8.1309�. �hal-02940646�
Quantification of Mitochondrial DNA Deletion,
Depletion, and Overreplication:
Application to Diagnosis
Be´atrice Chabi,
1Be´ne´dicte Mousson de Camaret,
2Herve´ Duborjal,
3Jean-Paul Issartel,
3and Georges Stepien
1*Background: Many mitochondrial pathologies are quantitative disorders related to tissue-specific deletion, depletion, or overreplication of mitochondrial DNA (mtDNA). We developed an assay for the determination of mtDNA copy number by real-time quantitative PCR for the molecular diagnosis of such alterations.
Methods: To determine altered mtDNA copy number in muscle from nine patients with single or multiple mtDNA deletions, we generated calibration curves from serial dilutions of cloned mtDNA probes specific to four different mitochondrial genes encoding either ribo-somal (16S) or messenger (ND2, ND5, and ATPase6) RNAs, localized in different regions of the mtDNA sequence. This method was compared with quantifica-tion of radioactive signals from Southern-blot analysis. We also determined the mitochondrial-to-nuclear DNA ratio in muscle, liver, and cultured fibroblasts from a patient with mtDNA depletion and in liver from two patients with mtDNA overreplication.
Results: Both methods quantified 5–76% of deleted mtDNA in muscle, 59 –97% of mtDNA depletion in the tissues, and 1.7- to 4.1-fold mtDNA overreplication in liver. The data obtained were concordant, with a linear correlation coefficient (r2
) between the two methods of 0.94, and indicated that quantitative PCR has a higher sensitivity than Southern-blot analysis.
Conclusions: Real-time quantitative PCR can determine the copy number of either deleted or full-length mtDNA
in patients with mitochondrial diseases and has advan-tages over classic Southern-blot analysis.
© 2003 American Association for Clinical Chemistry
In human cells, mitochondria are the only organelles that contain extrachromosomal DNA. This mitochondrial DNA (mtDNA),4a 16 569-bp circular genome, encodes for 13 proteins that are essential for oxidative phosphoryla-tion and thus for ATP producphosphoryla-tion. Intramitochondrial synthesis of these 13 proteins requires mtDNA-encoded 12S and 16S ribosomal RNAs and 22 tRNAs for their translation. Approximately 300-2000 mitochondria are present in each cell, and their function is most important in the tissues requiring the most energy, such as skeletal and cardiac muscles, brain, and to a lesser extent, other tissues such as kidney and liver (1 ).
mtDNA mutations have been identified in high num-bers and broad variety in both multisystem and tissue-restricted disorders. More than 200 disorders are associ-ated with specific point mutations or single deletions in mtDNA (2 ). Furthermore, because of the nuclear contri-bution to the synthesis of respiratory chain enzymes, other clinical disorders inherited as Mendelian traits have been associated with multiple deletions or depletion of mtDNA. mtDNA depletion syndrome (MDS) is a quanti-tative disorder characterized by a variable tissue-specific reduction in mtDNA copy number. The clinical pheno-type of MDS is highly dependent on the residual mtDNA concentrations in tissues (3 ). mtDNA mutations (includ-ing deletions) are frequently heteroplasmic, with mutated and wild-type mtDNA coexisting at different respective amounts in cells and subsequently in the affected tissues
1Unite´ du Me´tabolisme Prote´ino Energe´tique, UMR INRA 1019, 63009 Clermont-Ferrand, France.
2Laboratoire de Biochimie, Hoˆpital Debrousse, Hospices Civils de Lyon, 69322 Lyon, France.
3Laboratoire de Biolphysique Mole´culaire et Cellulaire, UMR CNRS 5090, CEA Grenoble, 38054 Grenoble, France.
*Address correspondence to this author at: UMPE, UMR INRA 1019, 58, rue Montalembert, 63009 Clermont-Ferrand, France. Fax 33-4-7360-8255; e-mail stepien@clermont.inra.fr.
Received December 8, 2002; accepted April 24, 2003.
4Nonstandard abbreviations: mtDNA, mitochondrial DNA; MDS, mtDNA depletion syndrome; q-PCR, quantitative PCR; nDNA, nuclear DNA; ATPsyn, ATP synthase ; and nt, nucleotide.
(4 ). All studies carried out to date have shown that a
percentage of mutated or deleted mtDNA⬎60% is nec-essary to reveal a mitochondrial respiratory chain defect in a specific organ (5, 6 ). Moreover, the percentage of heteroplasmy correlates with the disease development and the severity of the clinical phenotype, as described for the T8993G mutation. This mutation can produce the lethal infantile Leigh syndrome (at least 90% mutant load) or the neurogenic muscle weakness, ataxia, and retinitis pigmentosa (NARP) syndrome with late onset (⬃60–80% mutant load) (7 ).
The lifetime accumulation of somatic mtDNA changes has been proposed as a major factor in aging (8 ), but the different methods of quantification have led to contradic-tory results: some studies showed that most cells do not contain mtDNA deletions (9, 10 ), whereas most others showed an accumulation of either deleted mtDNA (11–
15 ) or mtDNA point mutations (16 –18 ).
To date, the qualitative or quantitative diagnosis of mtDNA disorders, including quantification of the hetero-plasmy percentage, has been carried out mainly by stan-dard methods such as Southern-blot analysis. This method requires large tissue biopsies and difficult analy-ses that often produce various artifacts.
Several PCR-based methods for detecting mtDNA de-letions and point mutations have been developed, al-though most of these assays have generated only qualita-tive or semiquantitaqualita-tive data (19 –24 ). Recently, a new technology, real-time quantitative PCR (q-PCR), has been proposed to quantify DNA copy number and is now an impressive tool for quantifying deleted mtDNA in tissues
(25 ).
We developed experimental conditions that allowed us
to quantify precisely, by real-time q-PCR, different qual-itative and quantqual-itative mtDNA defects, including dele-tion, depledele-tion, and overreplication of mtDNA, specifi-cally identified in several mitochondrial pathologies. In this study, we describe this new method, simultaneously compare real-time q-PCR with classic Southern-blot anal-ysis, demonstrate the multiple advantages provided by this new q-PCR technology, and detail the major variables to be controlled for optimum quantification, such as the quality of extracted mtDNA, oligonucleotide design, and PCR conditions.
Materials and Methods case reports
Twelve patients were included in this study. Tissue biopsies were obtained with the informed consent of the patients or their parents. The patients were of both sexes, and all cases were sporadic except patient 12.
Patients harboring single or multiple large-scale mtDNA dele-tions (patients 1–9). The clinical and molecular features of
patients harboring single or multiple large-scale mtDNA deletions (patients 1–9) are summarized in Table 1.
Patient with MDS (patient 10). This infant died at 12
months of age from a MDS with total intestinal villous atrophy and malabsorption syndrome as the early clinical onset, followed by hypotonia, mental regression, and progressive liver failure. Measured enzymatic activities of the respiratory chain complexes that contained mtDNA-encoded subunits (complexes I, III, and IV) were severely decreased in muscle and liver biopsies.
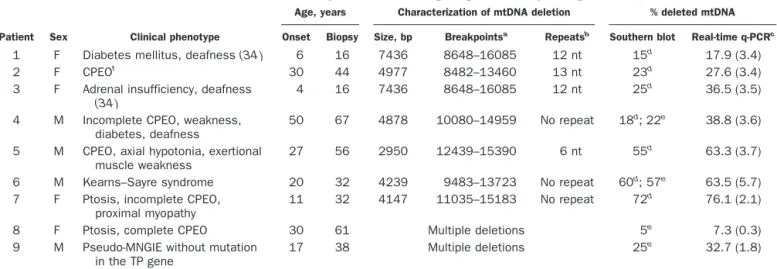
Table 1. Clinical and molecular features of the patients harboring single or multiple large-scale mtDNA deletions.
Patient Sex Clinical phenotype
Age, years Characterization of mtDNA deletion % deleted mtDNA Onset Biopsy Size, bp Breakpointsa Repeatsb Southern blot Real-time q-PCRc
1 F Diabetes mellitus, deafness (34 ) 6 16 7436 8648–16085 12 nt 15d 17.9 (3.4)
2 F CPEOf
30 44 4977 8482–13460 13 nt 23d
27.6 (3.4) 3 F Adrenal insufficiency, deafness
(34 )
4 16 7436 8648–16085 12 nt 25d 36.5 (3.5)
4 M Incomplete CPEO, weakness, diabetes, deafness
50 67 4878 10080–14959 No repeat 18d; 22e 38.8 (3.6)
5 M CPEO, axial hypotonia, exertional muscle weakness
27 56 2950 12439–15390 6 nt 55d 63.3 (3.7)
6 M Kearns–Sayre syndrome 20 32 4239 9483–13723 No repeat 60d; 57e 63.5 (5.7)
7 F Ptosis, incomplete CPEO, proximal myopathy
11 32 4147 11035–15183 No repeat 72d
76.1 (2.1)
8 F Ptosis, complete CPEO 30 61 Multiple deletions 5e
7.3 (0.3) 9 M Pseudo-MNGIE without mutation
in the TP gene
17 38 Multiple deletions 25e 32.7 (1.8)
aNumbers refer to nucleotide position in the Cambridge sequence of the human mtDNA L strand (30 ). bmtDNA direct sequence repeats involved in the generation of deletions.
cq-PCR was performed with external standards for the mitochondrial 16S, ND2, ATPase6, and ND5 genes. For each patient, the four mtDNA copy numbers were
normalized with those of control individuals, and the percentage of deleted mtDNA was determined from the wild-type-to-total mtDNA ratio. PCR data are the mean (SD).
d,eFor Southern blot analysis, the radioactive signals were quantified bydscanning densitometry and/orephosphoimaging.
fCPEO, chronic progressive external ophthalmoplegia; MNGIE, mitochondrial neurogastrointestinal encephalomyopathy (37 ); TP, thymidine phosphorylase.
Patients with mtDNA overreplication (patients 11 and 12).
Patient 11 presented with a hepatocerebral form of severe neonatal lactic acidosis and liver failure. Citrate synthase activity was greatly increased in a liver biopsy (224 U mg of protein; reference interval, 43–94 U mg of protein), and measured enzymatic activities of the enzymatic respira-tory chain complexes containing mtDNA-encoded sub-units were severely decreased (9%, 19%, and 10% of the control means for complexes I, III, and IV activities, respectively). In contrast, the activities of succinate dehy-drogenase and complex II, which are encoded by nuclear DNA (nDNA) only, were within the appropriate reference intervals. Southern-blot analysis of a liver biopsy failed to detect either mtDNA deletion or a reduction in the mtDNA copy number.
Patient 12 presented with a hepatocerebral form of severe neonatal lactic acidosis associated with tubulopa-thy, muscle wasting, and liver failure. Enzymatic mea-surements of the respiratory chain complexes in muscle and liver biopsies revealed that the activities of complexes I and IV were severely decreased (10% and 30% of the control means for complexes I and IV, respectively in muscle; 6% of the control means for complexes I and IV in liver). Citrate synthase activity was greatly increased in liver (214 U; reference interval, 43–94 U). Southern-blot analysis of the liver biopsy failed to detect either large-scale mtDNA deletion or copy number reduction. Fur-thermore, no mutation in the 22 mitochondrial tRNA genes of liver mtDNA was found. A sibling, a girl, died of the same syndrome with similar conditions.
detection and mapping of mtDNA deletions
mtDNA deletions were detected by PCR as described previously (26, 27 ). To characterize the nucleotide se-quences at the breakpoints of deleted mtDNA, we per-formed direct sequencing of the PCR fragments in both directions on an automated sequencer (373A Applied Biosystems) with the DYEnamic™ terminator Cycle Se-quencing Kit (Amersham Biosciences).
dna quantification by southern-blot analysis
For mtDNA and nDNA quantification by Southern-blot analysis, the blots were hybridized with a mitochondrial
(ND1) probe and a nuclear (18S rRNA) probe as described previously (3 ). The multicopy 18S rRNA nuclear gene was selected to obtain optimum sensitivity for nDNA signals. The radioactive signals from the mtDNA and nDNA bands were quantified both by scanning the auto-radiographic exposures with a Scanning Densitometer (CS 9000; Shimadzu) and by direct radiographic quantifi-cation with a PhosphorImager apparatus (Bio-Rad) with Molecular Analyst Software.
dna quantification by real-time q-PCR
For mtDNA and nDNA quantification by PCR analysis, we generated calibration curves with serial dilutions of the target gene PCR products. We selected the single-copy nuclear ATP synthase gene (ATPsyn) to determine the real ratio of mtDNA to nDNA copy number. PCR prod-ucts of mitochondrial genes (16S, ND2, ATPase6, and ND5) and the nuclear ATPsyn gene (Table 2) were subcloned into the plasmid vector pGEM®-T Easy (pGEM-T and pGEM-T Easy Vector Systems; Promega) according to the manufacturer’s instructions. Plasmid DNA was isolated and purified with Nucleobond® AX cartridges (Macherey-Nagel). Mitochondrial and nuclear insert length was verified by restriction analysis with
EcoRI, and each plasmid concentration was determined
by triplicate measurements of the absorbance at 260 nm. The molecular concentrations of the plasmid stock solutions were calculated, and the stock solutions were diluted from 2 ⫻ 108 copies to 2 ⫻ 104 copies/L for mtDNA and from 2⫻ 106copies to 2⫻ 102copies/L for nDNA to generate the calibration curves. PCRs were performed in a LightCycler instrument with 2 L of master mixture (LightCycler-FastStart DNA Master SYBR Green I; Roche Diagnostics) containing Taq DNA poly-merase, deoxynucleotide triphosphates, and SYBR Green I; 3 mM MgCl2, 0.5 M each of the forward (for) and reverse (rev) primers (Table 2), 5L of the DNA template (2 ng/L) or calibrator (with a known copy number); and water in a final volume of 20 L. The primers were designed with use of Oligo 6.0 software (MedProbe). The same DNA dilutions were used for both nDNA and mtDNA amplification.
The reaction was conducted as follows: 1 cycle of Taq
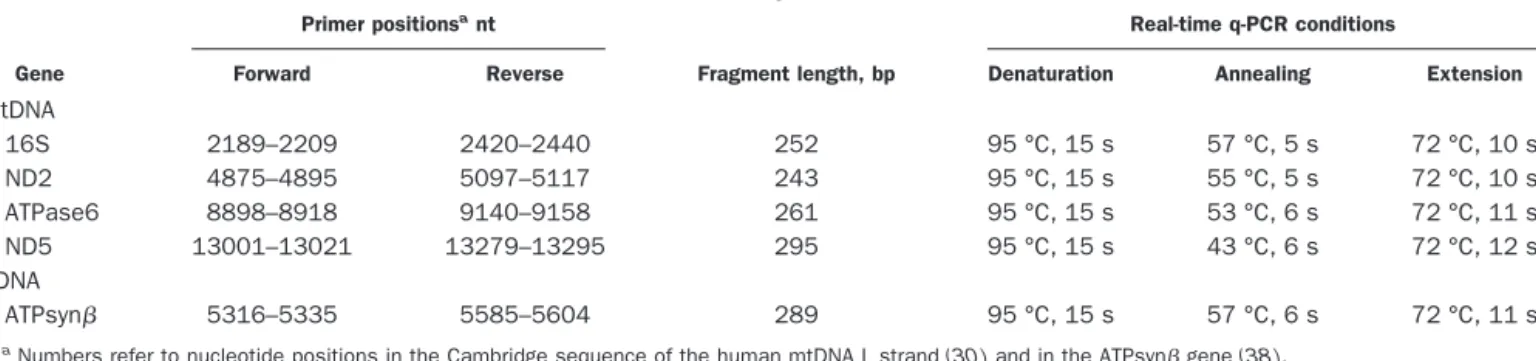
Table 2. Real-time q-PCR conditions.
Gene
Primer positionsant
Fragment length, bp
Real-time q-PCR conditions
Forward Reverse Denaturation Annealing Extension
mtDNA 16S 2189–2209 2420–2440 252 95 °C, 15 s 57 °C, 5 s 72 °C, 10 s ND2 4875–4895 5097–5117 243 95 °C, 15 s 55 °C, 5 s 72 °C, 10 s ATPase6 8898–8918 9140–9158 261 95 °C, 15 s 53 °C, 6 s 72 °C, 11 s ND5 13001–13021 13279–13295 295 95 °C, 15 s 43 °C, 6 s 72 °C, 12 s nDNA ATPsyn 5316–5335 5585–5604 289 95 °C, 15 s 57 °C, 6 s 72 °C, 11 s
DNA polymerase activation for 8 min at 95 °C, followed by 45 cycles (temperature transition of 20 °C/s) at specific conditions for each fragment (Table 2). At the end of the amplification process, melting curves were analyzed be-tween 65 and 95 °C (temperature transition of 0.1 °C/s) with continuous fluorescence monitoring to control for the absence of nonspecific products. Calibration curves were used to quantify mtDNA and nDNA copy numbers, which were based on the linear relationship between the crossing point cycle values and the logarithm of the starting copy number. The slope was determined, and the corresponding real-time PCR efficiencies for each mito-chondrial and nuclear gene amplification were calculated according to the equation: E ⫽ 10(⫺1/slope). The data are means of three serial measurements. The run-to-run vari-ability, verified for several controls and patients, was ⬃2%. This variability is usually reported to be 0–5% (28). However, to avoid any experimental error, we included controls and patients for each mtDNA defect in the same run.
nucleotide polymorphism detection in mitochondrial ATPase6 and ND5 genes
For patients and a control population (100 individuals, including the controls used in this study), mtDNA frag-ments encompassing the PCR products of the ATPase6 and ND5 genes (Table 2) were amplified by PCR from positions 8648 to 9990 and 12572 to 13510, respectively. For patients 1 and 3, direct sequencing of these mtDNA fragments was performed in both directions as described above.
Results
quantification of the percentage of heteroplasmy in mtDNA deletions
Relative amounts of deleted mtDNA (heteroplasmy per-centages) were determined for samples from the nine patients (patients 1–9) presenting with different types of either single or multiple mtDNA deletions (Table 1). Single mtDNA deletions had been detected previously in the patient samples by a PCR-based screening procedure
(27 ), and the deletion boundaries had been sequenced
(Table 1). The deletion size ranged from 2950 bp (patient 5) to 7436 bp (patients 1 and 3). The amount of deleted mtDNA in samples was quantified by both Southern blotting and real-time q-PCR analysis. In the q-PCR analysis, the mtDNA copy number (total and wild-type) was quantified by amplification of four randomly distrib-uted mtDNA fragments: two fragments outside (16S and ND2 gene fragments) and two others within the deleted region (ND5 and ATPase6 fragments); for patients 4 –7, only the ND5 fragment was amplified within deleted regions (Table 2). For patients 8 and 9, who harbored multiple mtDNA deletions, both ND5 and ATPase6 frag-ments were included in most previously sequenced dele-tions (87–100%) (26, 29 ). Several remaining deledele-tions with very low percentages of heteroplasmy, localized from
primers ND5 rev to 16S for, ND2 rev to ATPase6 for, and ATPase6 rev to ND5 for, could not be quantified regard-less of the primers used. The copy numbers of the four mtDNA fragments were quantified in control individuals (without deleted mtDNA) to correct for the variability of q-PCR efficiency between fragments and thus to relatively quantify the mtDNA.
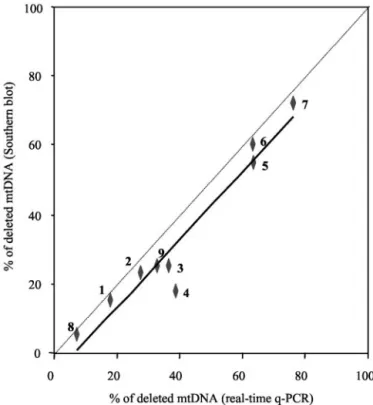
The results were compared with those obtained with Southern-blot analysis (Table 1). Higher percentages of deleted mtDNA were observed by q-PCR compared with the values found by Southern-blot analysis. This was true whether the Southern blots were analyzed by scanning densitometry of autoradiographs or by a PhosphorImager (patient 4). The linear correlation coefficient between the two data sets (r2) was 0.94 (P⬍0.0001; Fig. 1), but the shift of the slope toward the q-PCR axis showed that this method is more sensitive than the Southern-blot ap-proach. One possible reason for this could be either incomplete or nonhomogeneous mtDNA loading on the Southern-blot transfer membrane.
For patient 1, quantification of ATPase6 and ND5 (both localized in the deleted region) revealed that 17.9% (Table 1) and 74.8% (data not shown), respectively, of the mtDNA had been deleted. To explain this discrepancy, we hypothesized that a point mutation in the ND5 gene could be responsible for reduced amplification of this fragment from full-length mtDNA molecules. Regions
Fig. 1. Comparison of real-time q-PCR and Southern blotting for determination of the percentage of mtDNA with single or multiple deletions in muscle biopsies from nine patients.
The equation for the regression line, where y is the percentage of deleted mtDNA determined by Southern blotting and x is the percentage determined by q-PCR, is: y⫽ 0.981x ⫺ 0.065% (r2⫽ 0.94). Patient numbers are indicated in bold (see Materials and Methods).
flanking the q-PCR ATPase6 and ND5 fragments (Table 2) were sequenced, revealing the presence of a new transi-tion at nucleotide (nt) 13020 of the Cambridge mtDNA sequence (2, 30 ). This position corresponds to the second nucleotide from the 3⬘ end of the ND5 forward primer and thus should lead to lowered amplification efficiency. This T13020C transition does not affect the amino acid sequence of the ND5 protein (G228G), but creates a new
HaeIII restriction site. HaeIII restriction fragment length
polymorphism analysis of the PCR product (nt 12572– 13510) revealed that this polymorphism was present in all mtDNA molecules from the patient’s muscle, from the patient’s mother, and from 2 of 100 control individuals. Moreover, none of the control individuals used in this study harbored this polymorphism (data not shown).
mtDNA depletion or overreplication
Total DNA from patients with mtDNA depletion or overreplication was analyzed simultaneously by Southern blotting and real-time q-PCR.
mtDNA depletion (patient 10). Southern blots were
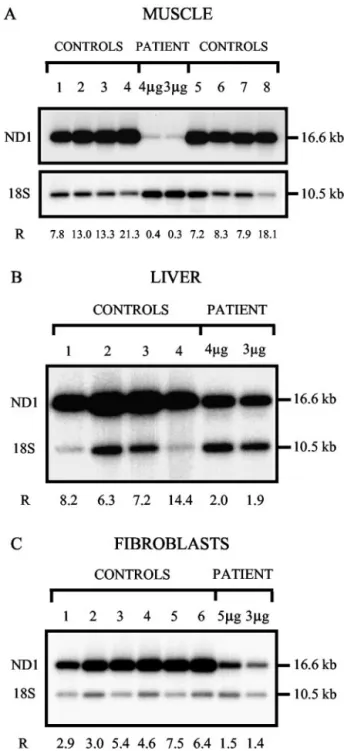
hybrid-ized with 32P-labeled mitochondrial (ND1) and nuclear (18S rRNA) probes, and the radioactive signals were quantified with a PhosphorImager (Fig. 2). q-PCR was performed by amplification of mitochondrial ND2 and nuclear ATPsyn (Fig. 3). The quantification was con-firmed by amplification of a second mtDNA fragment (ATPase6) to avoid any mtDNA polymorphisms (data not shown). The same controls were used for both assays for each tissue or cell type. The two methods produced consistent data: 97.1%, 78.3%, and 71.0% mtDNA deple-tion in muscle, liver, and fibroblasts, respectively, by Southern-blot analysis (Fig. 2 and Table 3), and 96.7% (Fig. 3 and Table 3), 73.7%, and 58.5% mtDNA depletion (Table 3) by q-PCR.
mtDNA overreplication (patients 11 and 12). mtDNA in liver
from patients 11 and 12 was assayed by Southern-blot and q-PCR analysis (Table 3). q-PCR analysis revealed signif-icantly increased mtDNA in the samples from both pa-tients (2.3- and 4.1-fold increase, respectively). Southern-blot analysis also revealed increases of 1.7- and 2.3-fold. The higher mtDNA/nDNA ratios obtained by q-PCR were probably attributable to more precise quantification of the high mtDNA copy numbers compared with South-ern blotting, in which signal saturation could not be avoided.
efficiency of q-PCR
Calibration curves were generated from duplicate mea-surements of three independent serial dilutions of the target gene PCR products (Fig. 3). The crossing point cycle and the starting copy number logarithm were well corre-lated, with variability⬍10%. The corresponding amplifi-cation efficiencies, 94 –100%, were in the optimum range, but even a slight variation in efficiency could lead to
Fig. 2. Southern-blot analysis of mtDNA from muscle (A), liver (B) and cultured fibroblasts (C) of patient 10 with mtDNA depletion.
Total DNA was digested with both BglII (digestion of nuclear DNA only) and PvuII (linearization of mtDNA and digestion of nuclear DNA). mtDNA was detected with an ND1 probe (1417 bp; nt 3134 – 4550), and the nuclear-encoded 18S ribosomal RNA gene was detected with a 611-bp probe (nt 1201–1811). After quantification of the signals with a PhosphoImager, the ratio (R) of mtDNA (16.6 kb) to nDNA (10.5 kb) was calculated for each sample. (A), DNA from the muscle of the patient and eight age-matched controls (lanes 1– 4 and 5– 8). The blot was hybridized first with the 18S rRNA probe and subsequently with the ND1 mtDNA probe. 4g and 3 g, quantity of DNA loaded for the patient. For the controls, 4g of total digested DNA was loaded. The mean (SD) control ratio was 12.1 (4.9); range, 7.2–21.3. (B), DNA from the liver of the patient and four age-matched controls (samples 1– 4) simultaneously hybridized with both probes. 4 g and 3 g, quantity of DNA loaded for the patient; 4 g of total digested DNA was loaded for all controls. The mean (SD) control ratio was 9.0 (3.2); range, 6.3–14.4. (C), DNA from cultured fibroblasts of the patient and six age-matched controls (samples 1– 6) simultaneously hybridized with both probes. 5g and 3 g, quantity of DNA loaded for the patient. For the controls, 5 g of total digested DNA was loaded. The mean (SD) control ratio was 5.0 (1.7); range, 2.9 –7.5.
nonnegligible differences in the absolute copy number
(31 ). Thus, results obtained from the four different
mtDNA probes were normalized by amplification of control full-length mtDNA. To evaluate the variability of the q-PCR results, we quantified the copy numbers in muscle biopsies from 10 control individuals for the four amplified mtDNA fragments, with at least three determi-nations per control (not shown). The maximum SD ob-tained (0.06) between the values from the four mtDNA fragments attests to the reliability of the q-PCR method.
Discussion
Several diseases result from mtDNA mutations or rear-rangements: point mutations and single or multiple dele-tions that can be either homoplasmic (affecting all mtDNA molecules) or, more frequently, heteroplasmic (a specific percentage of the cellular mtDNA is mutated). Other diseases result from a reduction in the mtDNA
copy number (MDS). In contrast, increased mtDNA copy number, so-called overreplication, may be the only mo-lecular feature in some mitochondrial biochemically de-fined diseases of unknown genetic origin. Overreplication may reflect a cellular response to decreased energy pro-duction as a consequence of severe defects of the respira-tory chain complexes. All of these mtDNA defects may be specifically expressed in a particular tissue and conse-quently could lead to various clinical phenotypes accord-ing to the affected tissues (32, 33 ).
Until recently, Southern-blot analysis was the standard method for assessing quantitative mtDNA alterations or deletions when mitochondrial diseases were diagnosed
(27, 34, 35 ). However, this method requires a large
amount of DNA from tissue biopsies and is time-consum-ing because it requires several serial steps, which are not always carried out with well-defined quality controls. In addition, this method is susceptible to artifacts, such as membrane saturation for DNA binding; incomplete DNA transfer; hybridization background, which could lead to inaccurate determinations; and signal saturation when detection is by autoradiography. Thus, this method is less suitable for rapid and accurate pre- and postnatal diag-nosis or for family inheritance studies. In the present work, we studied several patients presenting three types of mtDNA alterations: single or multiple heteroplasmic large-scale mtDNA deletions, mtDNA depletion, and significant increases in mtDNA copy number (overrepli-cation). Each type of mtDNA alteration was assessed in the patient samples and appropriate controls by both Southern blotting and real-time q-PCR. We conclude that real-time q-PCR is an accurate method that could be applied to the diagnosis of diverse mitochondrial diseases linked to quantitative mtDNA alterations.
quantification of deleted mtDNA
Samples exhibiting single or multiple mtDNA deletions (Table 1) were analyzed by both methods, and the per-centage of heteroplasmy was assessed in all cases. Real-time q-PCR consistently produced higher deletion per-centages, especially for patient 4, and the correlation between the results obtained from both methods was linear and showed that PCR quantification is more sensi-tive than Southern blotting.
The difference between the two methods was constant (6%) as shown by the linear correlation analysis. This could be attributable to the different types of detection. For Southern-blot quantification, two radioactive bands corresponding to deleted and full-size mtDNA molecules must be simultaneously quantified. When the percentage of the deletion is lowest, the difference in band intensity is the highest, which provides the least accurate measure-ment. Indeed, when the deletion percentage is low, the signal for the deleted mtDNA is weak and is often more difficult to distinguish from the background signal than is the signal for full-size mtDNA. In contrast, with q-PCR, the undeleted and deleted sequences are assayed
sepa-Fig. 3. Kinetic curves of mtDNA (A) and nDNA (B) amplification by real-time q-PCR in muscle biopsies from controls and patient 10 with mtDNA depletion.
Total muscle DNA from the same eight controls as in Fig. 2A and patient 10 was amplified with ND2 (mtDNA) and ATPsyn (nDNA) primer pairs and visualized by the double-stranded-DNA-binding dye SYBR Green I. Fluorescence (y axis) is plotted vs the PCR cycle number (x axis). The calibration curves (insets) were constructed from duplicate measurements of three independent serial dilutions of the target gene PCR products. Each sample was amplified in triplicate, and the mtDNA and nDNA copy numbers from the controls and the patient were determined using the calibration curves: ND2, crossing point cycle number⫽ ⫺3.311(log of the copy number) ⫹ 36.88 (r2⫽ 0.997); ATPsyn, crossing point cycle number⫽ ⫺3.632(log of the copy number) ⫹ 40.14 (r2⫽ 0.999; see Materials and Methods).
rately and quantified accurately with calibration curves, leading to higher precision.
Our study of patient 1 revealed a discrepancy in assaying the deletion because of a polymorphic site. This observation underscores the fact that at least two different primer pairs should be used outside and inside the deleted region to properly quantify heteroplasmic dele-tions. Furthermore, if a single primer pair is used inside the deleted region, as proposed previously for the ND4 gene (25 ), a deleted mtDNA region could be missed. This is the case for patient 5 with deletion of nt 12439 –15390, which encompass the ND5, ND6, and part of the cyto-chrome b genes.
quantification of mtDNA depletion or overreplication
Southern blotting and q-PCR were used to determine the mtDNA copy number in different tissues from patients either with mtDNA depletion or overreplication. The mtDNA copy number was normalized to the nuclear ATPsyn gene copy number to take into account any variation of total cellular DNA in the samples. The results obtained by the two methods agreed for both muscle and liver from the patient with mtDNA depletion, but some discrepancy was observed in fibroblasts. We have previ-ously performed such a quantification in two patients with specific liver mtDNA depletion, and the two meth-ods led to similar values (36 ). Our present results show that CVs of 20% for q-PCR and 37% for Southern blot could not be avoided in age-matched controls, regardless of the tissue studied. This variation is a consequence of the variability in mtDNA copy number among
individu-als, even in biopsies from the same tissue. The much lower CV for real-time q-PCR confirms the accuracy of this method.
We also studied two patients with increased mtDNA copy numbers (mtDNA overreplication) associated with severe respiratory chain enzymatic defects. These dis-eases, characterized only biochemically, are related to an abnormally large increase in the amount of mtDNA, which is unable to provide normal respiratory chain enzymatic activities. The mtDNA copy number deter-mined by real-time q-PCR showed a more than fourfold increase in mtDNA copy number compared with controls (for patient 12). These increased values are up to twofold higher than those obtained by Southern-blot analysis. This discrepancy is attributable to two aspects of the Southern-blot method that could lead to underestimation of the mtDNA-to-nDNA ratio. The first aspect is that the effi-ciency of DNA transfer to the membrane is dependent on DNA size and concentration: when high concentrations of mtDNA are blotted for mtDNA overreplication analysis, the transfer may not be as complete as for the smaller nDNA fragments at much lower concentrations, and the blotting membrane could become saturated. The second aspect is that for Southern blotting performed for patients with mtDNA overreplication, nDNA and mtDNA were quantified by simultaneous hybridization of the blot with nuclear and mitochondrial probes. The mtDNA radioac-tive signal was so strong that it generated a background signal that contaminated and overestimated the nDNA signal. The mtDNA/nDNA ratio was thus lower in the Southern-blot analysis than in q-PCR. For q-PCR, how-ever, nDNA and mtDNA are amplified separately with
Table 3. Determination of mtDNA/nDNA ratios by Southern-blot and q-PCR analysis in patients with mtDNA depletion and overreplication.
Tissues or cells
Southern blota Real-time q-PCRb
mtDNA/nDNA % of control mean mtDNA/nDNA % of control mean
mtDNA depletion Muscle Patient 10 0.35 2.9 23.0 (1.1) 3.3 (0.3) 8 controls 12.1 (4.9) 709.8 (140.4) Liver Patient 10 1.95 21.7 97.1 (1.8) 26.3 (0.3) 4 controls 9.0 (3.2) 368.8 (60.8) Fibroblasts Patient 10 1.45 29.0 47.9 (0.5) 41.4 (1.4) 6 controls 5.0 (1.7) 115.7 (27.3) mtDNA overreplication Liver Patient 11 20.0 171 1133 (25) 225 (11) Patient 12 26.7 228 2059 (88) 409 (31) 9 controls 11.7 (1.9) 504 (99)
aSouthern blots were hybridized with mitochondrial (ND1) and nuclear (18S rRNA) probes, and the radioactive signals were quantified as described in the legend
for Fig. 2. The patient data are the means of two serial determinations, with two DNA loads (3 and 5g or 3 and 4 g). Control data are means (SD).
bq-PCR was performed with external standards for the mitochondrial ND2 and nuclear ATPsyn genes. For each gene, a sequence-specific calibration curve was
specific primers allowing precise quantification of each DNA species.
In conclusion, the real-time q-PCR method we described is a faster and more accurate tool than Southern blotting for quantification of mtDNA alterations, including dele-tions. This method could be used to improve pre- and postnatal molecular diagnosis linked to qualitative or quantitative mtDNA defects. Moreover, these PCR condi-tions could be also used to quantify mtDNA random point mutations in muscle from elderly individuals. Such a study could help to determine whether mtDNA muta-tions are a major factor in aging.
Financial support was provided by the Institut National de la Recherche Agronomique, a grant from the Ministe`re de l’Education Nationale de la Recherche et de la Tech-nologie (to B.C.), the Hospices Civils de Lyon, and the Association Franc¸aise contre les Myopathies. We thank Dr. Berthelot (Angers); Dr. Khau Van Kien (Dijon); Dr. Brichet (Nancy); Prof. Guibaud, Dr. Petiot, Dr. Streichen-berger, and Prof. Vighetto (Lyon); Drs. Rozan-Rodier and Wilhelm (Mulhouse); Prof. Pages (Montpellier); and Prof. Tranchant (Strasbourg) for sending us the patient sam-ples. We thank Dr. Reynier (Angers) and E. Bugny (Lyon) for help in mtDNA sequence analysis and M. Chassagne, S. Padet, and C. Giraudet for expert technical assistance. We gratefully acknowledge N. Uhrhammer for critical assessment and helpful reading of the manuscript.
References
1. Zeviani M, Antozzi C. Mitochondrial disorders. Mol Hum Reprod 1997;3:133– 48.
2. MITOMAP. A human mitochondrial genome database. http:// www.mitomap.org/(Accessed December 2002).
3. Ducluzeau PH, Lachaux A, Bouvier R, Streichenberger N, Stepien G, Mousson B. Depletion of mitochondrial DNA associated with infantile cholestasis and progressive liver fibrosis. J Hepatol 1999;30:149 –55.
4. Lightowlers RN, Chinnery PF, Turnbull DM, Howell N. Mammalian mitochondrial genetics: heredity, heteroplasmy and disease. Trends Genet 1997;13:450 –5.
5. Boulet L, Karpati G, Shoubridge EA. Distribution and threshold expression of the tRNA(Lys) mutation in skeletal muscle of patients with myoclonic epilepsy and ragged-red fibers (MERRF). Am J Hum Genet 1992;51:1187–200.
6. Sciacco M, Bonilla E, Schon EA, DiMauro S, Moraes CT. Distribu-tion of wild-type and common deleDistribu-tion forms of mtDNA in normal and respiration-deficient muscle fibers from patients with mito-chondrial myopathy. Hum Mol Genet 1994;3:13–9.
7. Ferlin T, Landrieu P, Rambaud C, Fernandez H, Dumoulin R, Rustin P, et al. Segregation of the G8993 mutant mitochondrial DNA through generations and embryonic tissues in a family at risk of Leigh syndrome. J Pediatr 1997;131:447–9.
8. Linnane AW, Marzuki S, Ozawa T, Tanaka M. Mitochondrial DNA mutations as an important contributor to ageing and degenerative diseases. Lancet 1989;1:642–5.
9. Reynier P, Malthiery Y. Accumulation of deletions in MtDNA during
tissue aging: analysis by long PCR. Biochem Biophys Res Commun 1995;217:59 – 67.
10. Khrapko K, Bodyak N, Thilly WG, van Orsouw NJ, Zhang X, Coller HA, et al. Cell-by-cell scanning of whole mitochondrial genomes in aged human heart reveals a significant fraction of myocytes with clonally expanded deletions. Nucleic Acids Res 1999;27:2434 – 41.
11. Ozawa T, Tanaka M, Ikebe S, Ohno K, Kondo T, Mizuno Y. Quantitative determination of deleted mitochondrial DNA relative to normal DNA in parkinsonian striatum by a kinetic PCR analysis. Biochem Biophys Res Commun 1990;172:483–9.
12. Melov S, Lithgow GJ, Fischer DR, Tedesco PM, Johnson TE. Increased frequency of deletions in the mitochondrial genome with age of Caenorhabditis elegans. Nucleic Acids Res 1995;23: 1419 –25.
13. Hayakawa M, Katsumata K, Yoneda M, Tanaka M, Sugiyama S, Ozawa T. Age-related extensive fragmentation of mitochondrial DNA into minicircles. Biochem Biophys Res Commun 1996;226: 369 –77.
14. Kovalenko SA, Harms PJ, Tanaka M, Baumer A, Kelso J, Ozawa T, et al. Method for in situ investigation of mitochondrial DNA deletions. Hum Mutat 1997;10:489 –95.
15. Kopsidas G, Zhang C, Yarovaya N, Kovalenko S, Graves S, Richardson M, et al. Stochastic mitochondrial DNA changes: bioenergy decline in type I skeletal muscle fibres correlates with a decline in the amount of amplifiable full-length mtDNA. Biogeron-tology 2002;3:29 –36.
16. Michikawa Y, Mazzucchelli F, Bresolin N, Scarlato G, Attardi G. Aging-dependent large accumulation of point mutations in the human mtDNA control region for replication. Science 1999;286: 774 –9.
17. Lin MT, Simon DK, Ahn CH, Kim LM, Beal MF. High aggregate burden of somatic mtDNA point mutations in aging and Alzhei-mer’s disease brain. Hum Mol Genet 2002;11:133– 45. 18. Fayet G, Jansson M, Sternberg D, Moslemi AR, Blondy P, Lombes
A, et al. Ageing muscle: clonal expansions of mitochondrial DNA point mutations and deletions cause focal impairment of mito-chondrial function. Neuromuscul Disord 2002;12:484 –93. 19. Corral-Debrinski M, Stepien G, Shoffner JM, Lott MT, Kanter K,
Wallace DC. Hypoxemia is associated with mitochondrial DNA damage and gene induction. Implications for cardiac disease. JAMA 1991;266:1812– 6.
20. Simonetti S, Chen X, DiMauro S, Schon EA. Accumulation of deletions in human mitochondrial DNA during normal aging: analysis by quantitative PCR. Biochim Biophys Acta 1992;1180: 113–22.
21. Soong NW, Hinton DR, Cortopassi G, Arnheim N. Mosaicism for a specific somatic mitochondrial DNA mutation in adult human brain. Nat Genet 1992;2:318 –23.
22. Lezza AM, Boffoli D, Scacco S, Cantatore P, Gadaleta MN. Correlation between mitochondrial DNA 4977-bp deletion and respiratory chain enzyme activities in aging human skeletal mus-cles. Biochem Biophys Res Commun 1994;205:772–9. 23. Zhang C, Peters LE, Linnane AW, Nagley P. Comparison of
different quantitative PCR procedures in the analysis of the 4977-bp deletion in human mitochondrial DNA. Biochem Biophys Res Commun 1996;223:450 –5.
24. Meissner C, Mohamed SA, Klueter H, Hamann K, von Wurmb N, Oehmichen M. Quantification of mitochondrial DNA in human blood cells using an automated detection system. Forensic Sci Int 2000;113:109 –12.
25. He L, Chinnery PF, Durham SE, Blakely EL, Wardell TM, Borthwick GM, et al. Detection and quantification of mitochondrial DNA deletions in individual cells by real-time PCR. Nucleic Acids Res 2002;30:e68.
26. Ville-Ferlin T, Dumoulin R, Stepien G, Matha V, Bady B, Flocard F, et al. Fine mapping of randomly distributed multiple deletions of mitochondrial DNA in a case of chronic progressive external ophthalmoplegia. Mol Cell Probes 1995;9:207–14.
27. Ferlin T, Guironnet G, Barnoux MC, Dumoulin R, Stepien G, Mousson B. Detection of mitochondrial DNA deletions by a screening procedure using the polymerase chain reaction. Mol Cell Biochem 1997;174:221–5.
28. Bustin SA. Absolute quantification of mRNA using real-time re-verse transcription polymerase chain reaction assays. J Mol Endocrinol 2000;25:169 –93.
29. Moslemi AR, Melberg A, Holme E, Oldfors A. Clonal expansion of mitochondrial DNA with multiple deletions in autosomal dominant progressive external ophthalmoplegia. Ann Neurol 1996;40:707– 13.
30. Anderson S, Bankier AT, Barrell BG, de Bruijn MH, Coulson AR, Drouin J, et al. Sequence and organization of the human mito-chondrial genome. Nature 1981;290:457– 65.
31. Rasmussen R. Part 1, Methods: quantification on the LightCycler. In: Meuer S, Wittwer C, Nakagarawa K, eds. Rapid cycle real-time PCR: methods and applications. Heidelberg: Springer Press, 2001:21–34.
32. Wallace DC. Mitochondrial DNA mutations in diseases of energy metabolism. J Bioenerg Biomembr 1994;26:241–50.
33. Simon DK, Johns DR. Mitochondrial disorders: clinical and genetic features. Annu Rev Med 1999;50:111–27.
34. Nicolino M, Ferlin T, Forest M, Godinot C, Carrier H, David M, et al. Identification of a large-scale mitochondrial deoxyribonucleic acid deletion in endocrinopathies and deafness: report of two unre-lated cases with diabetes mellitus and adrenal insufficiency, respectively. J Clin Endocrinol Metab 1997;82:3063–7. 35. Morris AA, Taanman JW, Blake J, Cooper JM, Lake BD, Malone M,
et al. Liver failure associated with mitochondrial DNA depletion. J Hepatol 1998;28:556 – 63.
36. Bonod-Bidaud C, Chevrollier A, Bourasseau I, Lachaux A, Mousson de Camaret B, Stepien G. Induction of ANT2 gene expression in liver of patients with mitochondrial DNA depletion. Mitochondrion 2001;1:217–24.
37. Nishino I, Spinazzola A, Hirano M. MNGIE: from nuclear DNA to mitochondrial DNA. Neuromuscul Disord 2001;11:7–10. 38. Neckelmann N, Warner CK, Chung A, Kudoh J, Minoshima S,
Fukuyama R, et al. The human ATP synthase  subunit gene: sequence analysis, chromosome assignment, and differential expression. Genomics 1989;5:829 – 43.