HAL Id: hal-02488633
https://hal-mines-albi.archives-ouvertes.fr/hal-02488633
Submitted on 23 Feb 2020
HAL is a multi-disciplinary open access
archive for the deposit and dissemination of
sci-entific research documents, whether they are
pub-lished or not. The documents may come from
teaching and research institutions in France or
abroad, or from public or private research centers.
L’archive ouverte pluridisciplinaire HAL, est
destinée au dépôt et à la diffusion de documents
scientifiques de niveau recherche, publiés ou non,
émanant des établissements d’enseignement et de
recherche français ou étrangers, des laboratoires
publics ou privés.
A new spectroscopic method for measuring ferric
diffusion coefficient in gelatin-based dosimeter gels
J. Coulaud, C Stien, E Gonneau, M. Fiallo, Véronique Brumas, Patrick
Sharrock
To cite this version:
J. Coulaud, C Stien, E Gonneau, M. Fiallo, Véronique Brumas, et al.. A new spectroscopic method for
measuring ferric diffusion coefficient in gelatin-based dosimeter gels. Biomedical Physics & Engineering
Express, IOP Publishing, 2019, 5 (6), pp.UNSP 065028. �10.1088/2057-1976/ab50ce�. �hal-02488633�
A new spectroscopic method for measuring ferric diffusion
coef
ficient in gelatin-based dosimeter gels
J Coulaud1 , C Stien2 , E Gonneau1 , M Fiallo1 , V Brumas1,4 and P Sharrock3
1 SIMAD, University Paul Sabatier, Toulouse, France
2 CEA, LIST, Laboratoire National Henri Becquerel(LNE-LNHB), CEA-SACLAY, 91191 Gif-sur-Yvette Cedex, France 3 RAPSODEE, Ecole des Mines, Albi, France
4 Present address: GMO, LCPQ UMR 5626, IRSAMC, University Paul Sabatier, Toulouse, France.
E-mail:[email protected]
Keywords: dosimetry, MRI, diffusion coefficient, hydrogel, spectroscopic method
Abstract
A new absorption spectroscopy method which enables rapid measurement of the diffusion coefficient
of Fe
3+in gelatin gel used in dosimetry was investigated. The physical approach, the preparation and
the experimental application of this new method were tested on the EasyDosit dosimetry gel and the
results were validated by MRI measurement. The diffusion coefficients measured on this gel were then
compared with those of the other gels presented in the literature. This gel, which is considered stable,
has a small post-irradiation ion diffusion, despite the absence of a complexing or crosslinking agent.
The diffusion coefficients of a range of dosimetry gels containing different proportions of gelatin were
also measured and the results show diffusion coefficients D from 3.21.10
−10m
2.s
−1to
2.41.10
−10m
2.s
−1.
1. Introduction
Gel dosimeter is a powerful dosimetric tool that enables to record radiation dose distribution in the three dimensions of space (3D). It has specific advantages in dosimetry measurements conditions where steep dose gradients exist, such as in intensity-modulated radiation therapy (IMRT) and brachytherapy.
Gel dosimeters are generally divided in two types; polymer gels[1,2] and ferrous gels, which consist of
three subgroups; gelatin[3,4] and agarose [5,6] and
PVA gels[7,8].
Recently, a radiochromic gel based on poly-urethane was presented: the PRESAGE phantom[9].
This dosimeter has the advantage of hardening in 1 h at 4°C and does not require a container for support. Fricke gel dosimeter are easy to prepare, which offers flexibility in the dimensioning of experiments, parti-cularly considering the shapes of phantoms.
Ferrous gels can be prepared in the presence of oxygen, are tissue equivalent over a very large photon energy range and are non-toxic. Atfirst, agarose was essentially used as setting agent. It was gradually replaced by gelatin. The latter dissolves in water at a
temperature close to 40°C compared to 90 °C for agarose, thus improving its sensitivity. Agarose gels are translucent in the visible spectrum whereas gelatin gels are transparent in the same range[10].
In this technique, ferrous(Fe2+) ions are oxidized into ferric (Fe3+) ions by free radicals produced by ionizing radiation. The concentration of the Fe3+ion is linearly proportional to the dose absorbed and it can be measured using optical spectroscopy[11], optical
computed tomography(CT) [12] and magnetic
reso-nance imaging(MRI) [13], CT reading being
opera-tional when ferric ions are complexed. For MRI readings, the presence of the paramagnetic ferric ions increases the water-proton relaxation rates[14], and
enables the reconstruction of a three-dimensional (3D) image of the absorbed dose in the gel.
However, a limitation of the measurement techni-que in ferrous gel dosimetry is the diffusion of ferric ions in the gel. Indeed, the diffusion of ferric ions after irradiation may contribute to a significant error in the 3D dose distributions measurements, especially when the dose rate is low, and thus, irradiation times are long[15].
The diffusion is a result of random movements caused by external forcefields or thermal energy and it
is characterized by the diffusion coefficient D. Ferric ions diffuse over a distance of √2Dt, where t is the elapsed diffusion time. The time scale of gel used can be assessed once D is known. This knowledge is important in experimental designs in order to avoid potential measurement errors in gel dosimetry[16].
Diffusion, as well as other properties of the ferrous dosimeter, is affected by the nature and the concentra-tion of setting agent. To immobilize the ions, various formulations with different concentrations of gelatin and agarose were described by Rae and al[17]. They
showed that ferric ion diffusion in gelatin is slower than in agarose. All these measurements were realized at 10°C immediately after irradiation [17], but
main-taining this low temperature during the entire hand-ling time (irradiation and reading) makes it cumbersome to use these gels that have an acceptable diffusion coefficient only at low temperature. Alter-native gels based on Sephadex, agar or poly-vinyl alco-hol have also been reported[18].
Several methods have been used and described in the literature to compensate ion diffusion. Some of them consist in reconstructing the initial ion distribu-tion at the end of irradiadistribu-tion. This can be achieved using a model for diffusion, which depends on diffu-sion coefficient D [19].
Another way to reduce the ferric diffusion is to add a chelating agent. This gives a large complex with Fe3+ ions as central atom. The increment in size reduces the average pathlength that each metal ion travels per unit time. Among them, Xylenol orange(XO) is a complex-ing agent that reduces the Fe3+diffusion coefficient. A reduction of 46% was reported by Rae and al[17] in
gelatin gels stored at 10°C, but the sensitivity was evenly reduced. The FAX system was developed by Appleby[11]. Solc et al used the potassium
ferricya-nide K3Fe(CN)6 and the reduction of the
iron(III)-citrate by the radiation. This green-yellowfluorescent complex may be combined with iron(II) to obtain the Turnbull blue whose concentration increases as a function of dose[20]. This optical change can be
mea-sured with a spectrophotometer for 1D/point dosi-metry or an optical CT scanner for 3D dosidosi-metry. Maeyama et al [21] also introduced nanoclay to a
Fricke gel dosimeter, and did not observe any diffusion during at least 9 days after irradiation.
Commonly, determination of these diffusion coef-ficients is handled using optical CT scanner or MRI measurements, generally time consuming and requir-ing access to readrequir-ing equipment for a long period of time. It is difficult to find a convenient laboratory technique for measurement of diffusion. John E Crooks describes a simple experimental system to measure quickly diffusion coefficients [22].
In this paper, this method was adjusted and applied in order to evaluate the diffusion coefficient of a new Fricke dosimetry gel, EasyDosit Breast (EDBreast), This gel have been developed to be low cost, environment friendly, easy to manufacture,
simple to use and could be easily adapted to radio-therapy applications[23]. Compared to the standard
Fricke gel, its composition was modified in order to lower post-irradiation ion diffusion. The mathema-tical model was adapted to match to the diffusion pro-file usually observed on these dosimetry gels. The detection wavelengths, the temperature regulation, the pH and the quantities of the various components were adjusted to obtain the most accurate measure-ments. This new method was allowed to obtain the dif-fusion coefficient of iron(III) in 90 min and thus avoid blocking during an MRI for a minimum of 8 h. The diffusion coefficient of ferric ions in the gel obtained with this method was compared with the results obtained using MRI reading. Finally, the diffusion coefficient of EasyDosit gels and others gels with dif-ferent gelatin concentrations were measured using this new method.
2. Materials and method
2.1. Principle
For the measurement of diffusion coefficients in dosimetry gels, two cases are generally encountered: ● Diffusion occurs in an infinite medium [17,24].
The diffusion happens on both sides of the inter-face. The ions diffuse from medium 1 to medium 2. and inside medium 1 in order to compensate for the decrease in the concentration around the interface.
● Diffusion occurs in a semi-infinite medium [24,25]. The broadcast is only on one side of the
interface. The ions only diffuse from medium 1 to medium 2, so medium 1 behaves like an infinite reservoir which is not being depleted[25].
The model of diffusion in an infinite medium is thus the one that will be used for the measurement of diffusion coefficients for two different methods: 2.1.1. Absorption Spectroscopy measurements
The method proposed for the determination of diffu-sion coefficient of Fe3+ions into EDBreast is based on the one published by Crooks [22]. In his method,
Crooks has considered that diffusion occurred in a semi-infinite media which relies on the mathematical modeling of the diffusion proposed by Hadgaft[25].
In this case, the irradiated media behaves like an infinite reservoir that keeps a constant concentration but, in this experiment, the irradiated medium was a finite media whose concentration is in fact being depleted. The most suitable model was the diffusion model in infinite medium. Here, this protocol was derived into 3 different measurement for validation purposes, implying the measurement of Fe3+itself, of chelated Fe3+with Tiron to form Fe-Tiron and with KSCN to form [Fe SCN( ) ]2+. An independent
measurement of D, based on MRI readings, has also been used. This method, even if less easy to set up, is more representative of the dosimetric gel, as Fe3+ions are produced under irradiation. It is used as a reference for the validation of the absorption spectroscopy method.
2.1.2. MRI measurements
The MRI method used was derived from a protocol described by Rae et al in 1996 [14]. Two gels were
manufactured in the form of cylindrical phantoms. Thefirst one was irradiated over half their volume in order to observe the diffusion of the Iron(III) from irradiated volume to unirradiated volume. The second one was a unirradiated control cylinder. The two cylindrical phantoms were imaged using a clinical magnetic resonance imager(MRI) with a multi echo sequence at several times after the irradiation. The variation of the transverse relaxation rate profile, R2,
over a period of 8 h was determined along the central plane of the cylinder. A reasonable estimate of the ferric iron diffusion coefficient (D) was obtained from these measurements.
The mathematical model of diffusion in an infinite medium for the both methods is described in the next section.
2.2. Mathematical model
The thermal motion of the ions inside the gel (Brownian motion) is responsible for the diffusion over time of the species created following irradiation. This phenomenon leads to a modification of the spatial distribution of their initial concentration. For the sake of clarity, we shall develop in this paper the one-dimensional diffusion equation, which is defined by the Relation 1[24]: ¶ ¶ = ¶ ¶ ( ) ( ) ( ) c x t t D c x t x , , 1 2 2 where
• c(x, t) is the concentration profile of diffusing species as a function of both time t and coordinate in space x.
• D is the diffusion coefficient (m2
.s−1) which is a function of the size of the moving particles and the physical properties of the medium, in particular its temperature and its viscosity.
The resolution of this equation can be done using classical tools such as Fourier transform or Laplace transform, and leads to a solution that can be written as a convolution product(Relation 2) [24]:
* * p = G = -( ) ( ) ( ) ( ) ( ) c x t x t c x Dte c x , , 1 4 2 0 0 x Dt 2 4
wherecini( )x =c x, 0( )represents the spatial distribu-tion of the initial concentradistribu-tion of the particles inside the irradiated section of the gel(at t=0) andG(x t, )
is the dispersion function, which is a Gaussian function. Expanding the convolutional product of equation(2), yields:
ò
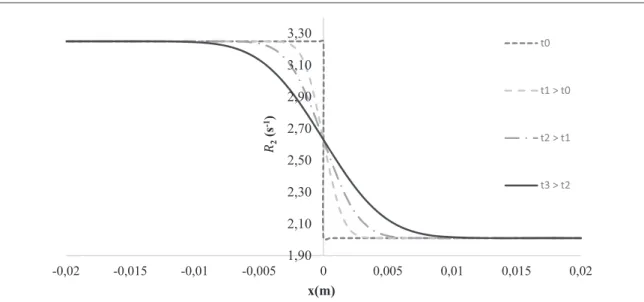
p = --¥ +¥ -( ) ( ) ( ) c x t Dt c x u e du , 1 4 . 3 x Dt 0 4 2For further developments, the expression of c(x, t) have to be defined. So, we assume that the diffusion of the species is carried out in an infinite medium, from an initial step function concentration distribution(or Heaviside step function), as depicted on the figure1.
If the concentration distribution is that of expres-sion(2) we see that equation (4)
ò
p = +¥ -( ) ( ) c x t c Dt e du , 4 x 4 u Dt 0 2 4Introducing u=v*2 Dt one can rewrite the last equation as
ò
p = +¥ -( ) ( ) / c x t, c e dv 5 x Dt v 0 2 2It is convenient to write the solution introducing the error and the complementary error function defined by[26]:
ò
ò
p p = = - = -+¥ -( ) ( ) ( ) Erf z e dv Erfc z Erf z e dv 2 et 1 2 z v x v 0 2 2The solution of the 1D diffusion equation is therefore [24]: = ⎛ ⎝ ⎜ ⎞ ⎠ ⎟ ( ) ( ) c x t c Erfc x Dt , 2. 2 6 0
From the solution worked out above, the amount
( )
M x t, of material passing through the interface defined at x=0 at time t, can easily be retrieved by integrating (c x t, )with respect to x.
ò
= ¥
( ) ( ) ( )
M x t, Ae. cx tdx 7
0 ,
whereAeis the surface area between the irradiated and non-irradiated sections of the sample.
For that, the properties of the erf(z) and erfc(z) functions are used(the details of these calculations are given inAppendix), and since:
Figure 1. Schematic representation of the initial state of the sample in terms of concentration distribution c(x, t=0).
ò
¥ c( )dx=c p ( ) Dt. 8
x t
0 , 0
By multiplying this value (mol.m−2) by the area formed by the interface between irradiated and non-irradiated gel, A ,e the total amount of Fe3+ions that has passed through this interface at time t, M(t), is given by:
ò
p = ¥ = ( ) ( ) ( ) M t Ae. cx tdx c A. e Dt 9 0 , 0Noting l the thickness of the gel in the irradiated section, we can define M0=c l A¥. . e, as the total amount of Fe3+ions initially present in the sample, therefore: p p = = ( ) ( ) M t M l Dt M Dt l . 10 0 0 2
In summary, from a practical perspective, there is two ways to estimate D: thefirst one from equation (6) by
fitting an error function model to the normalized profile (c x t, ) /c0.The second from equation(10), by calculating the fraction M t( ) /M .0 Both approaches
discussed in the next section. 2.3. Gel manufacture 2.3.1. Chemical reagents
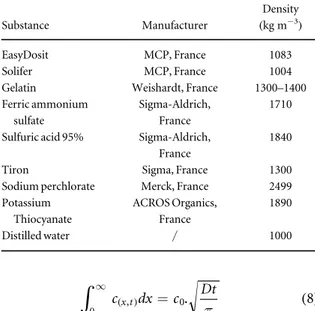
The origin of all the products used in this paper and their densities are given in table1.
EasyDosit and Solifer are the two elements of the pack designed by MCP allowing the formulation of a radiological material called EasyDosit Breast (EDBreast). This material has been formulated in order to have physical, morphological and mechanical properties similar to breast tissue[23].
EDBreast was prepared following the protocol described by Coulaud et al[23]. Itis mainly composed
by porcine gelatin(270 Bloom), sucrose and some pre-servative(0.1%), in order to avoid degradation of the gelatin. EasyDosit is chemically stable for 1 year when stored at 4°C in plastic bag to avoid dehydration.The final concentrations of gelatin and sucrose were deter-mined as a compromise in the optimization of differ-ent parameters[25]: for gelatin (7%w/w) the aim was to
accelerate the gelation process and avoid energy reab-sorption phenomena. For sucrose(10%w/w) the best
concentration was chosen to have a good equivalence with biological tissue and to maintain a high sensitivity with a high concentration of gelatin[27]. It is generally
accepted that sugars act as a crosslinking agent[28].
However, sugars are not directly involved in the inter-action with gelatin but they remove water from pro-tein chains [29]. The addition of sugar to gelatin
stabilizes protein networks, improving the gel struc-ture[30]. To obtain these concentrations, the gel
Easy-Dosit is diluted by 50%w/w(EDBreast).
2.3.2. Preparation of gels
2.3.2.1. EDBreast gel
For absorption spectroscopy measurements, a 25 g EasyDosit block was cut into small cubes, then placed into a beaker and melted in a water bath at 40°C in aerobic conditions, supervising the temperature and, thus, the oxygen dissolved. Once it was melted, ferric solution was added under stirring to obtain a final volume of 50 ml. Then, 30 ml of the mixture was molded in glass vials for the diffusion coefficient measurement.
For MRI measurements, a volume of 500 ml of EDBreast was prepared. It was poured into two cylind-rical PMMA phantoms of 10 cm length and 5 cm dia-meter: one intended to be irradiated, and the another one for control.
2.3.2.2. Gelatin based gels
The hydrogel is composed of gelatin(2%, 4%, 6%, 7%, 8% or 10%), buffer and ferric solution in a final volume of 30 ml. The required amount of gelatin was dissolved in the hot ferric solution (40 °C) in the presence of dioxygen until a clear solution was obtained. Then the mixture was molded in glass vials for diffusion coefficient measurements.
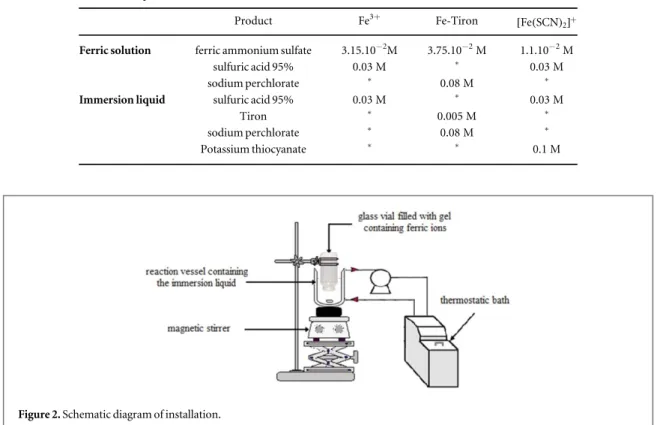
The composition of the solutions is summarized in the table2.
The Tiron solution and the ferric solution were made in a perchlorate medium in order to obtain the 1: 1 ferric-Tiron complex[31]. In order to avoid the
formation of iron (III) oxide which is insoluble in water, gels and immersion liquids should have a pH of less than 2[32]. To decrease the pH, sulfuric acid was
added to the gel and to the immersion liquid in the case of Iron(III) detection. In the case of Tiron-Iron complex detection, sodium perchlorate was added to the gel and to immersion liquid. In the case of
+
[Fe SCN( ) ]2 complex, sulfuric acid was added to
reduce the gel pH and the presence of thiocyanate ion in stoichiometric excess allowed to obtain a pH lower than 2 in the immersion liquid[33].
Table 1. Products and their densities used in this paper.
Substance Manufacturer
Density (kg m−3)
EasyDosit MCP, France 1083
Solifer MCP, France 1004
Gelatin Weishardt, France 1300–1400
Ferric ammonium sulfate
Sigma-Aldrich, France
1710 Sulfuric acid 95% Sigma-Aldrich,
France
1840
Tiron Sigma, France 1300
Sodium perchlorate Merck, France 2499
Potassium Thiocyanate ACROS Organics, France 1890 Distilled water / 1000
2.4. Diffusion coefficient measurements
The model of diffusion in an infinite medium can be used to measure the diffusion in afinite sample when the lengthℓ of the sample (irradiated part of the gel) is such that: » ¥ ⎛ ⎝ ⎜ ℓ ⎞⎠⎟ ℓ Erfc Dt when Dt 2 2 2
That implies, given the properties of the erfc func-tion,ℓ24Dt.
For both absorption spectroscopy and MRI meth-ods, the length of the sample is selected sufficiently large in order to use the model of diffusion in an in fi-nite medium for the measurement of diffusion coefficients.
2.4.1. Absorption spectroscopy measurements
The procedure used in this paper to measure quickly the diffusion coefficients was adapted from the method described by Crooks[22].
Fe(III) diffusion coefficient was either measured directly by detection of the ferric ions when the immersion liquid was a solution of sulfuric acid or by the detection of its complex when the immersion liquid was a solution of Tiron or KSCN.
A glass vial with an internal diameter of 2 cm and a height of 6 cm, was filled of 30 ml of gel (height L=5.5 cm) containing a concentrated ferric solution whose diffusion is to be measured. The gel vial was held with the lower, open end immersed in 100 ml of chelating solution or distilled water. The immersion liquid was contained in a reaction vessel with thermo-static jacket connected to a thermothermo-static bath
maintained at a temperature of 20°C and is vigorously stirred by a magnetic stirrer(figure2).
The vial was held vertically by pliers and a labora-tory jack. the gel was plunged in the immersion liquid att .0 At the moment of immersion, the solution did
not contain ferric ions. Its concentration increased with time. The diffusion through the gel happened in a single dimension vertically downwards.
In this case, the fractionMT/M0of the species
dif-fused out within a time t is p
= ( )
/ /
MT M0 Dt L2 11
where L is the length of the gel cylinder, M0 is the
quantity of Fe3+contained in the gel cylinder att0and
MTis the quantity of Fe3+that has diffused at time t.
The vial which is held vertically by pliers and a laboratory jack allows to plunge the gel in the immer-sion liquid att .0
Samples are removed after 1, 5, 10, 20, 30, 40, 55, 70, 90 min from the beginning and their absorbance, ATmeasured at 303 nm(Fe3+), at 670 nm (Fe-Tiron
complex) or at 478 nm ([Fe SCN( ) ]2+complex).
Sam-ples were then returned to the beaker. The absorption spectrums of these three compounds are shown on the figure3.
A0was determined using reference solutions at a
ferric concentration of 300 mg l−1for direct ferric ions detection and 360 mg l−1for Fe-Tiron complex detec-tion and 100 mg l−1for Fe-SCN complex detection in order to have an absorbance A near 1.50.
The fraction AT/A0grew linearly as a function of
the square of the time. The diffusion coefficient D was obtained with the slope of the curve(equation (11)).
Table 2. Composition of the solutions.
Product Fe3+ Fe-Tiron [Fe SCN( ) ]+
2
Ferric solution ferric ammonium sulfate 3.15.10−2M 3.75.10−2M 1.1.10−2M
sulfuric acid 95% 0.03 M * 0.03 M
sodium perchlorate * 0.08 M *
Immersion liquid sulfuric acid 95% 0.03 M * 0.03 M
Tiron * 0.005 M *
sodium perchlorate * 0.08 M *
Potassium thiocyanate * * 0.1 M
The fraction MT/M0of the species diffused during
a time t was calculated using equation(12):
= ( )( )( ) ( )
/ / / /
MT M0 AT A0 100 30 5 250 . 12
2.4.2. MRI measurements 2.4.2.1. Irradiation
Irradiation was performed on a TrueBeam Linac (Varian), in a 6 MV photon beam. The cylindrical phantom filled with EDBreast was placed in a 30×30×30 cm3 water tank, its rotation axis perpendicular to the beam axis, with its center placed at the reference depth of 10 cm into the tank(figure4)
and its edge being placed at the center of the beam. Thus, with a 10×10 cm2 field irradiation, the gel
cylinder was irradiated on one half, in order to produce ferric ions and, thus, a concentration gradi-ent. The dose delivered to the gel was 20 Gy at reference point, at 10 cm depth at the center of the field (figure4).
2.4.2.2. MRI readings
Readings were made on an Achieva Philips imager (CNRS, Paris-Sud University, CEA) with a 1.5 T field. The room was air-conditioned and maintained at a temperature of 20°C. The phantom was placed in a head coil SENSE, using a rack designed specifically for this application.
A transaxial 4 mm slice was defined, using a multi spin echo sequence with 2 excitations, 30 echos, and a repetition time TR=2000 ms and an inter-echo time TE=11 ms. It was placed along the plane of the cylin-der that was perpendicular to the beam axis during irradiation. Voxel size was given by reconstruction matrix as 0.47×0.47×4 mm3
.
The first acquisition was launched 58 min post-irradiation, time to get from the irradiation platform to the MRI, and to install the phantom. It was laun-ched every hour for 8 h, and, one last time, 23 h after irradiation. Once the phantom positioned, it was not removed from the device before the end of all mea-surements. Moreover, the geometry used was the same for all measurements. After reading the irradiated
Figure 3. Absorption spectrum of Fe3+(1.1.10−3M) (light grey),[Fe SCN( ) ]2+complex(2.8.10−3M) (dark grey) and Fe-Tiron
complex(1.5.10−3M) (black).
phantom, the control one was analyzed, and was used to verify the homogeneity of the response for the gel. 2.4.2.3. Diffusion coefficient measurements
This approach is based on thefit of the function erfc (z) to the transverse relaxation rate profile R x t2( , )
experimentally measured by MRI. Indeed, the varia-tion of concentravaria-tion of Fe3+into the gel induces a variation of transverse relaxation rate R2of hydrogen
nuclei of the gel. Thus, concentration gradients into the gel can be mapped using MRI.
Considering the interface as constituted by a homogeneous distribution of ferric ions of concentra-tioncirrthat induces a transverse relaxation rate R2irr
in contact with the non-irradiated gel of transverse relaxation rate R ,20 the expression of the transverse
relaxation rate is fund by extension of the formule 6:
= - ⎛ + ⎝ ⎜ ⎞⎠⎟ ( ) ( ) ( ) R x t R R Erfc x Dt R , 2 . 2 13 irr 2 2 20 20
It is important to note at this stage of the demonstra-tion that the expression of the general soludemonstra-tion given by Relation 2 and therefore those given by Relations 6 et 13 are based on the assumption that the diffusion of ions occurs symmetrically on both sides of the inter-face. This adjustment is given by Relation 8 and is illustrated infigure5. Puttings = Dt2 4 ,the slope of
the curve s = ( )2 f t thus gives an estimate of the coefficient D.
In reality, the R2profile is not so sharp, and cannot
be approximated to a step function, as the area around the position x=0 corresponds to a dose gradient called‘penumbra’. However, this approximation on the initial conditions does not impact thefinal result, as the slope of the curves = Dt2 4 will be considered,
while the approximation only results with a transla-tion of the curve, with s =2 4Dt+c.
Transverse relaxation rates, R ,2 were calculated
using a homemade VisualBasic program, voxel per
voxel, resulting in a 2D matrix. R2values were
aver-aged on the 6 central voxels along(0 y) axis for every x positions. The position x=0 was arbitrarily defined at the same voxel for all measurements. Fittings with equation (13) were done using a
Levenberg-Mar-quardt algorithm proposed by the software OriginPro. Hence, the parameters R ,20 R2irr,and s, were calcu-lated for each acquisition. The curve s = ( )2 f t was, then, plotted using the least squares method and the diffusion coefficient of ferric ions into EDBreast could be determined.
2.5. Statistical modeling
Data analysis was performed using Matlab(Version R2016a 9.0, MathWorks, Natrick, MA, US). The standard Levenberg- Marquardt algorithm was used tofit the regression line. This method calculates the best-fitting curve for the experimental data by mini-mizing the sum of the squares of the vertical deviations from each data point to the curve.
Two intervals have also been defined to remove all non-compliant points(figure6):
• The first interval envelope corresponds to the confidence interval (dashed line) of the mean of y0
for a value x0:
å
D = + -- ( ¯) ( ¯) ( ) t s n x x x x 1 14 y n R i i 2 0 2 2 0• The second interval envelope corresponds to the prediction interval(grey line) for an observation y0:
å
D = + -- + - ( ¯) ( ¯) ( ) t s n x x x x 1 1 15 y n R i i 2 0 2 2 0where tn 2- is the Student’s t-value for a 95%
con-fidence interval with n-2 degrees of freedom, sRis the residual standard deviation, x is0 the experimental
value and xiis the value predicted by the model. Each point outside the confidence interval was removed to calculate the slope andfind D.
3. Results and discussion
3.1. Comparison of the two methods
To compare these two models, the D value for Fe3+in EasyDosit was realized with both methods and com-pared to the D values found in the literature.
3.1.1. MRI method
Figure7shows the evolution over time of the profiles measured after irradiation. For the sake of clarity, all the 9 profiles are not represented here, but only 5 of them, Measurements started 58 min after irradiation,
which corresponds to the time to go from the irradiation device to the reading one. From thisfigure, it is clear that the penumbra width increases with measurement delay. For each one of the profiles, σ2
is calculated using equation(13), and the profile σ2/2
plotted as a function of time.
Figure7shows that the Fe3+ions diffuse from the irradiated side to the non-irradiated side and the con-centration decreases inside the irradiated gel to com-pensate the decrease in the concentration close to the interface. This reduction in concentration amplifies and extends progressively with time inside the irra-diated side. The decrease after 10 h extends over less than 1 cm, the sample is long enough not to influence the diffusion profiles. Therefore, the diffusion does occur in an infinite medium confirming the choice of a correct model.
It also can be noted that, due to the auto-oxidation of Fe2+ions, the mean R2 values of the two plateaus
Figure 6. Variation of Mn/Mo ratio as a function of the time square root for EDBreast gel. Inset: Zoom on the ending of the curve showing the regression line(black line), the confidence interval (dashed line), the prediction interval (grey line) and error bar.
Figure 7. R2profiles of EDBreast gel irradiated with a 6 MV beam of a Trubeam (Varian) and read with an Intra Achieva device
(Philips). The dose to the fully exposed part of the phantom was 20 Gy. The five profiles stem from images acquired 58 min (black line), 178 min (dark grey), 300 min (anthracite grey), 418 min (medium-grey) and 539 min (light grey) after irradiation.
increases over time(about 3% in 8 h). If the auto-oxi-dation happened uniformly into the phantom, it would not have an impact on the measurement of D. However, this increase, when modeled with a linear function, appears to be slightly different for the two plateaus. The impact of the difference of oxidation expected at a time t on the value of the diffusion coeffi-cient have been introduced in the evaluation of the uncertainties. Its contribution varies from 0.1% 1 h after preparation, to 0.9% 8 h after preparation. The auto-oxidation increases the uncertainty in the mea-surement of the diffusion coefficient obtained with the absorption spectroscopy method by only 0.1% and can therefore be considered negligible.
The standard deviation of R20or R2irr is of about 1.7% for the same profile, which shows the presence of a low noise allowing for a good signal-to-noise ratio. All profiles intersect at one value (R2irr +R20) /2, respecting the properties of the erfc function.
Figure8is used to confirm that the linear
relation-ship between those two parameters is well established. The diffusion coefficient D, corresponding to the slope of the curve, was calculated to be 3.21.10−10m.s−1. 3.1.2. Absorption spectroscopy method
Fe3+ diffusion coefficient was measured directly by detection of its ions or of its complex with Tiron or KSCN. The different values of D are given in table3. The value obtained by the measurement with Iron(III) (3.14.10−10m2
.s−1) is very close to the one obtained by MRI on the same gel, with a difference of 2.2% (3.21.10−10m2
.s−1). Part of this gap can be explained
by the standard deviation(1, 7%) on MRI profile. The one obtained with the Fe-Tiron complex has a difference of 4.4% with the MRI value (3.07.10−10m2
.s−1) and there is different of 2.2% with the value measured on Iron (III). The value of the diffusion coefficient obtained indirectly by the spec-troscopic measurement of the[Fe SCN( ) ]2+complex
(2.41.10−10m2
.s−1) differs by more than 20% with the values obtained by the other methods.
3.1.2.1. Iron(III)
At acid pH(pH <2), two species are predominant Fe3+and [Fe(OH)]2+ [34]. Fe3+shows an intensive band atλmax=240 nm (ε=3800–4200 M−1.cm−1)
and [Fe(OH)]2+ shows two intensive bands at λmax=205 nm (ε=4600–4800 M−1.cm−1) and
303 nm(ε=2000–2100 M−1.cm−1) [35]. The
UV-visible absorbance cutoff wavelength of water solvent is 190 nm[36]. Only the [Fe(OH)]2+band at 303 nm is far enough away from the UV-visible absorbance cutoff wavelength not to be influenced by the solvent.
The amount of[Fe(OH)]2+present in solution will depend on the hydrolysis constant of Fe3+
(equation (16)). Siddall et al [37] measured a
hydro-lysis constant of 6.5.10–3at 25°C. + = + = + + + + + + [ ( )] [[ ( )] ] [ ] [/ ] ( ) Fe H O Fe OH H K Fe OH H Fe with . 16 hydrolysis 3 2 2 2 3
According to the ratio [H+] [/ Fe3+]diffused, a small variation of the ratio [Fe3+] [/Fe OH( )]2+can be
observed, which may explain a slight underestimation of the diffusion coefficient.
Figure 8. Variation of the parameters /22 in equation(8) with time after an 20 Gy irradiation of EDBreast gel dosimeter.
Table 3. Diffusion coefficient of Fe3+obtained with the absorption spectroscopy method.
+ ( )
Fe3 IRM Fe3+ Fe-Tiron [Fe SCN( ) ]2+ [Fe SCN( ) ]2+(adjusted)
σ2(s−1/2) / 1.82.10−4 1.80.10−4 1.59.10−4 1.76.10−4
3.1.2.2. Iron(III)/Tiron complex
At the perchlorate pH (pH=2), two species are predominant Fe3+and Iron(III)/Tiron complex (1:1) [38]. Fe3+shows an intensive band atλmax=240 nm
(ε=3800–4200 M−1.cm−1and Iron(III)/Tiron
com-plex shows an intensive band at λmax=670 nm (
ε=1840–1960 M−1.cm−1) [31].
At this pH, the Iron (III)/Tiron complex (1:1) represents about 95% of the chemical species present in solution and Fe3+ions are the remaining 5 per cent [38]. Only 95% of the diffused iron (III) is measured,
which explains the slight difference between the two D measurements.
3.1.2.3. Iron(III)/Thiocyanate complex
The value of D measured with this complex is less than that measured with Iron(III) and Iron(III)/Tiron complex but it had been observed that the red-color of reference solution A0 faded completely in about 10
days indicating there is a decrease of the Iron/ Thiocyanate complex concentration over time.
The red-colored Iron(III)/thiocyanate complexes are given by various formulas that depend on
- +
[SCN ] [/ Fe3 ] ratio : [Fe SCN( ) ]-,
63 [Fe SCN( ) ]3, +
[Fe SCN( ) ]2 and [Fe SCN( )]2+. The absorption
increases and the maximum shifts to higher wave-lengths as the ratio[SCN-] [/Fe3+]increases[39].
The[Fe SCN( ) ]2+and[Fe SCN( )]2+complexes are
those obtained for a small[SCN-] [/ Fe3+]ratio value when the thiocyanate concentration is close to 0.1 M [40]. Ozutsumi et al found out that for this ratio the
formation of higher complexes than[Fe SCN( ) ]2+is
small.
The [Fe SCN( ) ]2+ and [Fe SCN( )]2+ complexes
show an intense band at λmax = 478 nm (ε =
7880 M−1.cm−1) [41]. Laurence [42] measured the
two association constants at 25°C KA1=139 (equation (17)) and KA2=20.2 (equation (18)) for
= + [H ] 0.096 0.188 M.– + = = + - + + + -[ ( )] [[ ( )] ] [/ ] [ ] ( ) Fe SCN Fe SCN K Fe SCN Fe SCN with . 17 A 3 2 2 3 1 + = = + - + + + -[ ( )] [ ( ) ] [ ( ) ] [ ( )] [ ] ( ) / Fe SCN SCN Fe SCN K Fe SCN Fe SCN SCN with . 18 A 2 2 2 2 2
The higher theKAvalue is, the higher is the binding affinity between thiocyanate and iron and the more stable is the complex. These Ka values do not explain the difference between the D values obtained indirectly by the spectroscopic measurement of the Fe-Thiocya-nate complex and that obtained by the direct measure-ment ofFe3+.
Betts et al[43] put forward the reversible side of
the equilibria involving the complex ions
+
[Fe SCN( )]2 and [Fe SCN( ) ]+
2 and the formation of
the ion-radical(SCN)2-and ferrous ions by reaction
of these complexes with thiocyanate ions. The pre-sence of (SCN)2-ions involve fast and competitive
reactions with ferric ions and ferrous ions are formed again. The following mechanisms have been pro-posed: + = + + - + -[Fe SCN( )]2 SCN Fe2 (SCN) (19) 2 + = + + + - + - -[ ( ) ] ( ) ( ) Fe SCN SCN Fe SCN SCN 20 2 2 2 + = + + ( )- + - ( ) Fe2 SCN Fe 2SCN 21 2 3 + = + + ( )- + ( ) ( ) Fe3 SCN Fe SCN 22 2 2 2
In order to estimate the auto-reduction of ferric thiocyanate, Betts et al undertook the tracking of ferrous ions production in ferric thiocyanate solution by spectroscopic measurement as a function of time. To measure directly the ferrous product, a quenching solution was used. This solution contained a suf fi-ciently high ammonium fluoride concentration to discharge completely the red color of the ferric thiocyanate, a sufficient ammonium acetate concen-tration to raise the pH to 4 and ortho-phenanthroline to react with ferrous ions and form the colored complex [Fe o( -phen)]2+. In their experiment, known amounts of ferrous ions, similar to those measured during diffusion, was added to the quench-ing solution.
In this paper, the spectroscopic method to mea-sure the D with the[Fe SCN( ) ]2+ complex was
laun-ched and stopped after a time t. The quenching solution was added to the immersion liquid and the optical density of the solution was measured at 512 nm. This experiment was reproduced for each time value in the range[1; 95] min. Figure9shows the concentration of ferrous ions measured as a function of time.
The concentration of the ferrous ions produced as a function of time wasfitted to a second-degree poly-nomial function(figure 9). The values of the
poly-nomial curve parameters were used to adjust the concentration of diffusedFe3+by adding the amount
of Fe2+ formed by the reactions described by Betts.
The D value after adjustment is given in table3. This one(2.94.10–10m2.s−1) has a difference of 4.2% with the MRI value(3.07.10−10m2.s−1) and there is differ-ent of 6.4% with the value measured on Fe3+.
Lister et al[44] explained this fading reaction by
the oxidation of thiocyanate with dissolved oxygen, probably with ferric ion acting as a catalyst.
Sultan et al [45] explained that the acidic
pH weakens the trans effect, the terminal Sulphur separates from the thiocyanate and precipitate. The nitrogen linked cyano group released, picks up a prot-on and evolves as hydrogen cyanide gas.
These two reactions can explain the residual differ-ence between the two D measurements. This method remains complex to use because the diffusion coef fi-cient value must be adjusted by adding the amount of iron(II) formed to the amount of iron (III) diffused.
Figure10shows the difference of Mn/Mo ratio as
with direct detection of Fe3+ions, with indirect detec-tion by Fe-Tiron complex, and with indirect detecdetec-tion by [Fe SCN( ) ]2+complex, the value of which was
adjusted to take into account of the Fe2+ produc-tion([Fe SCN( ) ]2+(adjusted)).
Graphically, the difference between slopes of the three linear regressions is not observable but a distance between these lines is observed resulting from a differ-entiation of intercepts. Normally this intercept is sup-posed to be null. Its presence is due to the experimental conditions and more precisely to the initial conditions. Indeed, when the sample is plunged in the immersion liquid, a thin layer of air remains on the gel surface and it takes few seconds to be evacuated by stirring. Different values of intercepts are observed, depending on the time taken to evacuate these air bub-bles and its close coordination with the start of timer. This new methodenables the measurement of the
diffusion coefficient of iron(III) in 90 min and thus avoidsthe need ofblockingan MRI for at least 8 h.
3.2. Comparison of EDBreast with other ferrous gels Several authors determined the diffusion coefficient of Iron (III) by performing measurements at different temperatures of the gels with various compositions and using different resolution methods applying two distinct mathematics models. These mathematical models used different initial conditions and boundary conditions (infinite medium or semi-infinite med-ium). They use different methods of resolution and approximation(fit of complementary error function (Erfc) or edge spread function (ESF) to the profile, Inverse Square Root Function Method (ISQR), K) allowing for a more or less rapid measurement of D. The values of D found in the literature for different
Figure 9. Production of ferrous ions as function of time with[Fe3+] =0.011 M,
0 [SCN-]0=0.03 Mat 20°C.
Figure 10. Variation of Mn/Mo ratio as a function of the square root of time for EDBreast gel. The detection was realized with Fe3+ alone(filled circle), with Fe-Tiron complex (empty circle), with[Fe SCN( ) ]2+(adjusted)complex(grey circle).
ferrous gel compositions as well as the resolution methods used are listed in table4.
In order to compare the different D values obtained for these various gel compositions, the temp-erature condition considered with the mathematic model of diffusion must be identical with the mea-surement temperature. Let us consider three major categories of Fricke gels: Agarose, Agarose/Gelatin and Gelatin-based gels:
3.2.1. Agarose-based gels
Gambarini et al[48] and Baldock et al [49] found D
values for agarose gels with xylenol orange between 2.58.10−10m2.s−1and 3.81.10−10m2.s−1(22 °C). Bal-dock et al used afinite model where the medium is limited on both sides and Gambarini et al used an infinite model where the medium is not limited. The composition of the two gels is close but the mathema-tical resolution, hypothesis and the resulting uncer-tainties of both models are not the same and it could explain the difference between these two series. 3.2.2. Agarose/Gelatin-based gels
Kron et al[47] found D values for agarose/gelatin gels
with xylenol orange between 0.83.10−10m2.s−1 and 2.5.10−10m2.s−1 at 22°C. They used an analytical approximation based on the solution of the diffusion equation derived from the infinite model (equation (7)). This model uses the complementary
error function, where the properties involve that(i) all profiles intersect at the(R2irr +R20) /2value and(i)
R2irrand R20do not vary from one profile to another.
The profiles used by Kron et al had bothR2irrand R20
values increasing with the time and profiles did not intersected. Kron explained that these variations were due to the increase of the baseline due to the spontaneous oxidation of Fe2+. The large gap between the two D values cannot be explained only by the small difference in composition. The value obtained for 3% of gelatin and 1.5% of agarose(0.83.10−10m2.s−1) is the lowest value among all gels but it can be due to the adequacy of the profiles with the model used.
3.2.3. Gelatin-based gels
De Oliveira and al[46] and Solc et al [20] found D
values for 5% gelatin gels with xylenol orange between 1.66.10−10m2.s−1 (20 °C) and 2.03.10−10m2.s−1 (24 °C). De Oliveira and al used a semi-infinite model at 20°C and Solc et al used an infinite model at 24 °C. De Oliveira et al[46] measured the activation energy
(0, 533 eV) for diffusion of Fe3+ ions in a gelatin
matrix. This energy allows to calculate the diffusion coefficient value at another temperature using the Arrhenius equation(equation (23)) [50].
=
-( ) ( / ) ( )
D T D e. E K T 23
0 B
The factor D0=0.243 m2.s−1 was found and the
diffusion coefficient measured by Solc et al has passed from 2.03.10−10m2.s−1(24 °C) to 1.63.10−10m2.s−1 (à 20 °C). The same diffusion coefficient is obtained when the temperature is adjusted to be the same and this even if models are different.
Pedersen et al [15] and Rae et al [17] found D
values for 4% gelatin gels with xylenol orange between 1.22.10−10m2.s−1 (10 °C) and 2.25.10−10m2.s−1 (22 °C). These authors used the same model but tem-peratures were different. Using Arrhenius equation
Table 4. Diffusion coefficients of various gel dosimeters. Composition and
Concentra-tion in mM Temperature D(10-10 m2/s) Method Reference
EasyDosit, S 30, Fe3+ 21°C 3.14±0.06 (Fe3+) = p ¥ ( ) M x t, M Dt l .2 This study
EDBreast 20°C 3.21±0.07 This study
g 4, S 50, Fe2+1.5, XO 1.5 22°C 2.25±0.03 C x t( , )=C /2. erfc
( )
x D t 0 2 Pedersen et al[15] g 4, S 26, Fe2+0.2, FA 46, XO 0.2, BA 5 20°C 1.69±0.03 withσ=√2Dt g 4, S 26, Fe2+0.2, XO 0.2, BA 5 10°C 1.22±0.008 Rae et al[17] g 5, S 25, Fe2+0.5, XO 0.1 20°C 1.66±0.14 C x t( , )=C.erfc( )
x D t0 2 withσ=√2Dt De Oliveira and
al[46] g 5, S 25, Fe2+0.5, XO 0.1 24°C 2.03±0.08 Solc et al[20] g 3, a 1.5, S 100, Fe2+0.5, XO 0.25 22°C 0.83±0.3 C x t( , )=C /2. erfc
( )
x D t 0 2 g 2, a 1.0, S 200, Fe2+0.5, XO 0.222°C 2.5 Inverse Square Root Function
Method(ISQR) Kron et al[47] a 1, S 50, Fe2+1, XO 0.11 NC 3.81±0.08 C x t( , )=C /2. erfc
( )
x D t 0 2 Gambarini et al [48] a 1, S 50, Fe2+1, XO 0.165 NC 2.97±0.08 withσ=√2Dta 1, S 25, Fe2+0.4, XO 0.2 22°C 2.69±0.11 finite element method Baldock et al[49]
a 1, S 25, Fe2+0.4, XO 0.2, Sc 1.5
22°C 2.58±0.22
and the activation energy found by De Oliveira, the factor D0=0.383 m2−1s was found and the D
mea-sured by Rae et al is passed from 1.22.10−10m2.s−1 (10 °C) to 2.57.10−10m2
.s−1(at 22 °C). The remaining gap between the two coefficient values can be explained by a difference in the kind of gelatin used.
Indeed, most gelatin is derived from pork skins, pork and cattle bones and can be prepared by different curing, acid (type-A gelatin), and alkali processes (type-B gelatin). Depending on the manufacturing process, the gelatin has a different polypeptide chain length and therefore a more or lessfine mesh inside the gelatin. The strength of a gel(Bloom strength) or gelatin gives a scale to this physical phenomenon. Rae et al have used a 214 Bloom gelatin and Pedersen et al have not communicated their gelatin Bloom strength.
Nixon et al[51] showed that the Bloom strength of
the gelatin has an effect on the D. Indeed, they observed a 10% increase in D of methylene blue in gels containing gelatins ranging from 200 to 250 Bloom. So, the temperature and the Bloom strength difference could explain the variation between these two values of D.
Rae et al have proposed another gel with 4% of gelatin and xylenol orange but they have added for-maldehyde and have found D values of 1.69.10−10m2.s−1at 20°C. This good result can be explain by the crosslinking reaction between for-maldehyde and gelatin which reduces the mesh inside the gelatin[52,53].
The D value measured in this work for EDBreast gel(3.21.10−10m2.s−1) was 1% different with the aver-age found for agarose gel (3.19.10−10m2.s−1) but EDBreast does not contain complexing agent such as the xylenol orange or a crosslinking agent such as for-maldehyde. It still remains quite far from gelatin-based gels using xylenol orange. Pedersen et al [15]
found with a 4% gelatin gel a D value of 4.03.10−10m2.s−1 without xylenol orange and 2.25.10−10m2.s−1 with xylenol orange. The use of xylenol orange has therefore reduced by 44% the value of D of the radiosensitive compound. The use of a complexing agent and a crosslinking agent could allow ED Breast to be the Fricke gel with the lowest D value available. Even if the diffusion coefficient of the Fricke gel doped with nanoclay has been estimated, it would be difficult to verify it by absorption spectroscopy method.
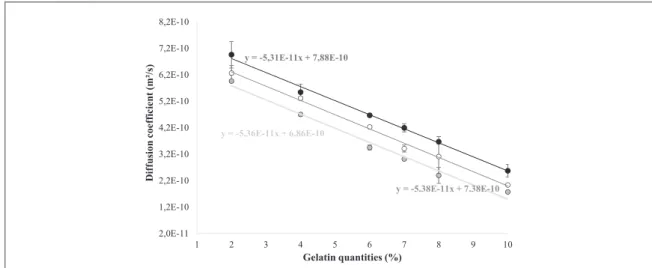
3.3. Measurement of the diffusion coefficient in gels containing different percentages of gelatin with the laboratory method
Thefigure11shows the variation of D as a function of gelatin proportion with direct detection of Fe3+ions, with indirect detection by Fe-Tiron complex and with indirect detection by[Fe SCN( ) ]2+complex for which
the value has been adjusted to take into account the Fe2+production([Fe SCN( ) ]2+(adjusted)).
The D curves for gelatin-based gels as a function of the gelatin proportion presented the same profile shapes for gels ranging from 2% and 10% of gelatin regardless detection method of Fe3+ions. The diffu-sion coefficient decreased linearly with gelatin ratio and thus the properties of the gel should be improved by increasing the amount of gelatin.
Gensanne has shown in previous studies[27] that
an increased concentration of gelatin resulted in an increase in relaxation rateR x t2( , )giving better
sensi-tivity and radiochemical yield. Moreover, the presence of organic matter improved oxidation of Fe2+by the x-Rays beam, giving a better sensitivity to the gels. However, an increasing amount of gelatin results in faster gelation, in an increase of medium viscosity and, thus, a lower dioxygen amount in the gel which is required in oxidation reaction. Moreover, increasing gelatin resulted in increasing the relaxation rate of medium R20 which reduced dosimetric sensitivity.
Therefore, the choice of the amount of gelatin has to be a compromise between a high relaxometric sensi-tivity and low diffusion coefficient.
The Fe-Tiron complex has a difference of 1.3% with Fe3+and the[Fe SCN( ) ]2+complex only has a
dif-ference of 0.9% with Fe3+but a more important dif-ference in intercepts was observed(6.4% and 12.9%). The explanations of this shifting are the same that those presented in section3.1.2for EDBreast gels.
The results obtained by spectroscopic method is consistent from one gel composition to another what-ever the detection method chosen is and the method could be used for other types of gel such as agarose or agar gels. The direct detection of Fe3+limits the risks of error due to indirect detection by the complex. It is also feasible to measure directly the diffusion value of the complex Fe–XO or hexacyanoferrate (III) by means of this method in different dosimetry gels.
The D values obtained by direct spectroscopic measurement of Fe3+in gels containing 4% or 10% of gelatin were compared with the D values found in the literature for the same types of gel. These values are reported in table5.
For 4% gelatin gels, a diffusion coefficient of 5.55.10−10m2.s−1 (21 °C) was measured with the spectroscopic method. Pedersen et al[15] and Rae et al
[17] found D values of 4.05.10−10m2.s−1(10 °C) and 4.03.10−10m2.s−1 (22 °C) for the same gel . These authors used the same model but at different tempera-tures. Using Arrhenius equation and the activation energy found by De Oliveira [46], the factor
D0=0.716 m2/s was computed and the diffusion
coefficient measured by Rae et al went from 4.05.10−10m2.s−1 (10 °C) to 5.55.10−10m2.s−1 (à 22°C), which corresponds to the value obtained with the spectroscopic method.
Pedersen et al found, for a 4% gelatin gel with orange xylenol, a lower value than Rae at the same temperature. As explained in part 3.1.3, the gap
between the two coefficients can result from the type of gelatin used[51].
For 10% gelatin gels, a D of 2.58.10−10m2.s−1 (21 °C) was measured with the spectroscopic method. Kron et al[47] found a D value of 1.39.10−10m2.s−1
(22 °C).
Both used the infinite medium model and the dif-ference between the two cannot be explained using the ISQR approximation.
As for the gelatin/agarose gel, Kron et al found the smallest value but this can be attributed to the ade-quacy of profiles with the model used, as explained in the part 3.1.3.
The majority of D values found in gelatin-based dosimetry gels are in fact measurements of Fe–XO complexes. There are very few values given in the lit-erature for gelatin gels containing Fe3+. It would be interesting to measure the D for Fe3+with different proportions of gelatin with the other methods in order to compare them with the spectroscopic method stu-died here.
4. Conclusion
An absorption spectroscopy method was established and validated on the EDBreast by comparison with the MRI method. The diffusion coefficients of gels with
different gelatin concentrations was measured using this new method. The results obtained by spectroscopy is consistent from one gel composition to another. This method could also be used to measure directly the D value of complexes such as Fe–XO or hexacyanofer-rate(III) in other dosimetry gels.
This work also shows that the EDBreast gel has a D close to those found for agarose gel, despite the fact that EDBreast does not contain complexing or a cross-linking agent. This confirms the interest in such a gel combined with MRI readings, as a 3D dosimetry method that would be easy to handle and stable enough in time to ensure an accurate spatial dose dis-tribution a few hours after irradiation, without having to take into account any diffusion effect correction. This gel could still be improved by adding of a com-plexing and a crosslinking agent and work in this direction will be reported shortly.
Acknowledgments
J C is grateful to Region Occitanie(Toulouse, France) and to DSL(Paul Sabatier Toulouse III University) for the PhD fellowship. The authors thank ARI (Associa-tion pour la Recherche Interdisciplinaire, Toulouse, France) for providing the use of chemicals; the Orsay MRI platform(CNRS, Univ Paris-Sud, CEA, Orsay,
Figure 11. Variation of the diffusion coefficient of dosimetric gel as a function of the gelatin quantity presents in the gel. Quantification of Fe3+alone(filled circle), of Fe-Tiron complex (empty circle) and of[Fe SCN( ) ]2+(adjusted)complex(grey circle).
Table 5. Diffusion coefficients of various gelatin gel dosimeters. Composition and
Concentra-tion in mM Temperature D(10-10 m2/s) Method Reference
g 4, S 26, Fe2+0.2 10°C 4.05±0.03 C x t( , )=C /2. erfc
( )
x D t 0 2 withσ=√2Dt Rae et al[17] g 4, S 50, Fe2+1.5 22°C 4.03±0.03 Pedersen et al [15] g 4, S 30, Fe3+ 21°C 5.55±0.3 (Fe3+) = p ¥ ( ) M x t, M Dt l .2 This studyg 10, S 30, Fe3+ 21°C 2.58±0.1 (Fe3+) This study
g 10, S 100, Fe2+0.5 22°C 1.39±0.3 C x t( , )=C /2. erfc
( )
x D t0 2 (ISQR) Kron et al[47]
France) and LNE (Laboratoire national de métrologie et d’essais, Paris, France) for the MRI measurements. We are grateful to Ms Catherine Sharrock(Medical Calcium Phosphate, Toulouse, France) for the gift of EasyDosit and Solifer.
Appendix
The result of equation(11) may be obtained using the
following steps.
The indefinite integral of erf(z) function in given in [26]
ò
erf z dz( ) =zerf( )z + e-p +C z2where C is any constant
Furthermore, if we note that thefinite integral
ò
= p = +¥ ( ) erfc x dx 1 x 0Introducing= x 2 Dt, it follows that:
ò
¥ erfc x dx( ) =2 Dtp (24) 0 and hence:ò
¥ c( )d =c¥ p ( ) Dt 25 x t x 0 ,ORCID iDs
J Coulaud https://orcid.org/0000-0001-9674-727XReferences
[1] Maryanski M J, Gore J C, Kennan R P and Schulz R J 1993 NMR relaxation enhancement in gels polymerized and cross-linked by ionizing radiation: a new approach to 3D dosimetry by MRI Magn. Reson. Imaging11 253–8
[2] Maryanski M J et al 1994 Magnetic resonance imaging of radiation dose distributions using a polymer-gel dosimeter Phys. Med. Biol.39 1437
[3] Olsson L E, Petersson S, Ahlgren L and Mattsson S 1989 Ferrous sulphate gels for determination of absorbed dose distributions using MRI technique: basic studies Phys. Med. Biol.34 43–52
[4] Bäck S Å J, Medin J, Magnusson P, Olsson P, Grusell E and Olsson L E 1999 Ferrous sulphate gel dosimetry and MRI for proton beam dose measurements Phys. Med. Biol.44 1983
[5] Schulz R J, DeGuzman A F, Nguyen D B and Gore J C 1990 Dose-response curves for Fricke-infused agarose gels as obtained by nuclear magnetic resonance Phys. Med. Biol.
35 1611
[6] Kron T, Metcalfe P and Pope J 1993 Investigation of the tissue equivalence of gels used for NMR dosimetry Phys. Med. Biol.
38 139
[7] Smith S T et al 2015 A reduction of diffusion in PVA Fricke hydrogels J. Phys. Conf. Ser.573 12046
[8] Chu K C, Jordan K J, Battista J J, Van Dyk J and Rutt B K 2000 Polyvinyl alcohol-Fricke hydrogel and cryogel: two new gel dosimetry systems with low Fe3+diffusion Phys. Med. Biol.
45 955
[9] Schreiner L J 2015 True 3D chemical dosimetry (gels, plastics): development and clinical role J. Phys. Conf. Ser.573 012003
[10] Penev K I and Mequanint K 2013 Controlling sensitivity and stability of ferrous-xylenol orange-gelatin 3D gel dosimeters by doping with phenanthroline-type ligands and glyoxal Phys. Med. Biol.58 1823–38
[11] Appleby A 1991 Imaging of radiation dose by visible color development in ferrous-agarose-xylenol orange gels Med. Phys.18 309
[12] Kelly R G, Jordan K J and Battista J J 1998 Optical CT reconstruction of 3D dose distributions using the ferrous– benzoic–xylenol (FBX) gel dosimeter Med. Phys.25 1741
[13] Gore J C and Kang Y S 1984 Measurement of radiation dose distributions by nuclear magnetic resonance(NMR) imaging Phys. Med. Biol.29 1189–97
[14] Harris P J, Piercy A and Baldock C 1996 A method for determining the diffusion coefficient in Fe(II/III) radiation dosimetry gels usingfinite elements Phys. Med. Biol.41 1745
[15] Pedersen T V, Olsen D R and Skretting A 1997 Measurement of the ferric diffusion coefficient in agarose and gelatine gels by utilization of the evolution of a radiation induced edge as reflected in relaxation rate images Phys. Med. Biol.42 1575
[16] Tseng Y J et al 2002 The role of dose distribution gradient in the observed ferric ion diffusion time scale in MRI-Fricke-infused gel dosimetry Magn. Reson. Imaging20 495–502
[17] Rae W I D 1996 Chelator effect on ion diffusion in ferrous-sulfate-doped gelatin gel dosimeters as analyzed by MRI Med. Phys.23 15
[18] Schreiner L J 2004 Review of Fricke gel dosimeters J. Phys. Conf. Ser.3 9–21
[19] De Pasquale F et al 2006 Ion diffusion modelling of Fricke-agarose dosemeter gels. Radiat. Prot. Dosimetry120 151–4
[20] Šolc J and Spěváček V 2009 New radiochromic gel for 3D dosimetry based on Turnbull blue: basic properties Phys. Med. Biol.54 5095–107
[21] Maeyama T et al 2014 A diffusion-free and linear-energy-transfer-independent nanocomposite Fricke gel dosimeter Radiat. Phys. Chem.96 92–6
[22] Crooks J E 1989 Measurement of diffusion coefficients J. Chem. Educ.66 614
[23] Coulaud J et al 2018 Tissue-inspired phantoms: a new range of equivalent tissue simulating breast, cortical bone and lung tissue Biomed. Phys. Eng. Express4 035017
[24] Crank J 1975 The Mathematics of Diffusion (London: Oxford university press) 0 19 853344 6
[25] Coulaud J, Brumas V, Sharrock P and Fiallo M 2019 3D optical detection in radiodosimetry: easyDosit hydrogel
characterization Spectrochim. Acta Part A Mol. Biomol. Spectrosc.(https://doi.org/10.1016/j.saa.2019.05.029)
[26] Abramowitz M and Stegun I A 1965 Handbook of Mathematical Functions: with Formulas, Graphs, and Mathematical Tables 55 (Courier Corporation)
[27] Gensanne D 2003 Design of a New Tissue-Equivalent gel : Applications to three Dimensional Dosimetry Using Magnetic Resonance Imaging (Phd Diss.)(University Toulouse III Paul Sabatier)
[28] Kasapis S, Al-Marhoobi I M, Deszczynski M, Mitchell J R and Abeysekera R 2003 Gelatin versus polysaccharide in mixture with sugar Biomacromolecules4 1142–9
[29] James D W and Rintoul L 1982 Protein-water Interactions in solution: the water-gelatin-electrolyte system Aust. J. Chem.35 1157–63
[30] Choi Y H, Lim S T and Yoo B 2004 Measurement of dynamic rheology during ageing of gelatine–sugar composites Int. J. Food Sci. Technol.39 935–45
[31] McBryde W A E 1964 A spectrophotometric reexamination of the spectra and stabilities of the iron(III) – tiron complexes Can. J. Chem.42 1917–27
[32] Delahay P, Pourbaix M and Van Rysselberghe P 1950 Potential-pH diagrams J. Chem. Educ.27 683
[33] Marczenko Z and Bal Cerzak M 2000 Separation,
Preconcentration and Spectrophotometry in Inorganic Analysis 10(Elsevier)
[34] Beverskog B and Puigdomenech I 1996 Revised pourbaix diagrams for iron at 25°C–300 °C Corros. Sci.38 2121–35
[35] Stefánsson A 2007 Iron(III) Hydrolysis and Solubility at 25 °C Environ. Sci. Technol.41 6117–23
[36] Workman J J J 2016 Concise Handbook Of Analytical
Spectroscopy, The: Theory, Applications, And Reference Materials (In 5 Volumes).(World Scientific Publishing Company) [37] Siddall T H and Vosburgh W C 1951 A spectrophotometric
study of the hydrolysis of Iron(III) Ion 1 J. Am. Chem. Soc.73 4270–2
[38] Shriadah M M A and Ohzeki K 1986 Effect of anion-exchange resin on the formation of iron(III)-Tiron complexes Analyst
111 197
[39] Polchlopek S E and Smith J H 1949 Composition of ferric thiocyanate at high concentrations J. Am. Chem. Soc.71 3280–3
[40] Ozutsumi K, Kurihara M, Miyazawa T and Kawashima T 1992 Complexation of Iron(III) with thiocyanate Ions in Aqueous Solution Anal. Sci.8 521–6
[41] Bent H E and French C L 1941 The structure of ferric thiocyanate and its dissociation in aqueous solution J. Am. Chem. Soc.63 568–72
[42] Laurence G S 1956 A potentiometric study of the ferric thiocyanate complexes Trans. Faraday Soc.52 236
[43] Betts R H and Dainton F S 1953 Electron Transfer and Other Processes Involved in the Spontaneous Bleaching of Acidified Aqueous Solutions of Ferric Thiocyanate J. Am. Chem. Soc.75 5721–5727
[44] Lister M W and Rivington D E 1955 Some measurements on the Iron(III)-Thiocyanate system in aqueous solution Can. J. Chem.33 1572–90
[45] Sultan S M and Bishop E 1982 A study of the formation and stability of the iron(III)-thiocyanate complex in acidic media Analyst107 1060
[46] De Oliveira L N, Sampaio F G A, Moreira M V and de Almeida A 2014 Measurements of the Fe3+diffusion coefficient in Fricke Xylenol gel using optical density measurements Appl. Radiat. Isot.90 241–4
[47] Kron T, Jonas D and Pope J M 1997 Fast T1 imaging of dual gel samples for diffusion measurements in NMR dosimetry gels Magn. Reson. Imaging15 211–21
[48] Gambarini G et al 2004 Study of light transmittance from layers of Fricke-xylenol-orange-gel dosimeters Nucl. Instruments Methods Phys. Res. Sect. BBeam Interact. with Mater. Atoms213 321–4
[49] Baldock C, Harris P J, Piercy A R and Healy B 2001 Experimental determination of the diffusion coefficient in two-dimensions in ferrous sulphate gels using thefinite element method,’ Australas. Phys. Eng. Sci. Med.24 19–30
[50] Jones L and Atkins P 1999 Chemistry: Molecules, Matter, and change.(W H Freeman and Company)
[51] Nixon J R, Georgakopoulos P P and Carless J E 1967 Diffusion from gelatin-glycerin-water gels J. Pharm. Pharmacol.19 246–52
[52] Davis P and Tabor B 2003 Kinetic study of the crosslinking of gelatin by formaldehyde and glyoxal J. Polym. Sci. Part A Gen. K1 799–815
[53] Bigi A, Cojazzi G, Panzavolta S, Rubini K and Roveri N 2001 Mechanical and thermal properties of gelatinfilms at different degrees of glutaraldehyde crosslinking,’ Biomaterials22 763–8

![Figure 3. Absorption spectrum of Fe 3+ ( 1.1.10 −3 M ) ( light grey ) , [ Fe SCN ( ) ] 2 + complex ( 2.8.10 −3 M ) ( dark grey ) and Fe-Tiron complex ( 1.5.10 −3 M ) ( black ) .](https://thumb-eu.123doks.com/thumbv2/123doknet/13119286.387344/7.892.181.825.90.395/figure-absorption-spectrum-light-complex-tiron-complex-black.webp)


![Figure 9. Production of ferrous ions as function of time with [ Fe 3 + ] 0 = 0.011 M, [ SCN - ] 0 = 0.03 M at 20 ° C.](https://thumb-eu.123doks.com/thumbv2/123doknet/13119286.387344/12.892.181.829.91.394/figure-production-ferrous-ions-function-time-fe-scn.webp)