GAIA RVS data reduction : the 6^{th} dimension
Texte intégral
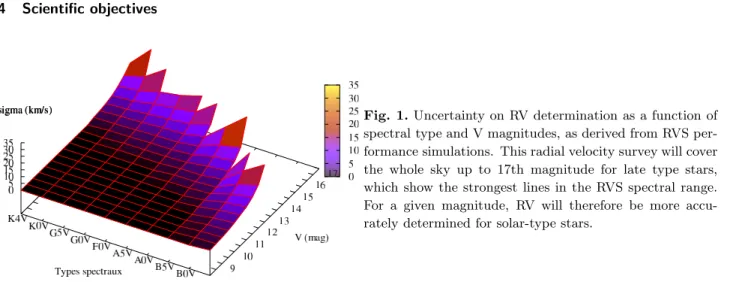
Figure
Documents relatifs
2, but we now train the classifiers with the feature value approximations obtained from one sampling strategy, and we track the classification accuracy when tested with feature
The background can be very well modelled from information that is available from Gaia’s astrometric and photometric measurements (stellar positions, magnitudes, rough spectral types
The Gaia-RVS standards: a new full-sky list of 1420 stars with reliable Radial
Left panel: Current status of the number of observations available per candidate standard star observed with the SOPHIE, CORALIE and NARVAL instruments (995 distinct stars).. Black
I It can be chosen such that the components with variance λ α greater than the mean variance (by variable) are kept. In normalized PCA, the mean variance is 1. This is the Kaiser
In the next two regions (cases 2 and 3), cropland is preferentially distributed to the highest classes of land quality either by increasing the number of cultivated plots (case 2) or
These Sherpa projeclS resulted from the common interest of local communities, whereby outsiders, such as Newar and even low-caste Sherpa (Yemba), could contribute
So, the personalized approach to the processing of medical information is characterized by a number of problems, namely: the uncertainty of the data presented, the classifica- tion
