Driving Confidence and In-Vehicle Telematics: A Study of
Technology Adoption Patterns of the
50+
Driving Population
by
Thomas E. Hutchinson
Bachelor of Science in Civil Engineering University of Tennessee, 2002
Submitted to the Department of Civil and Environmental Engineering in Partial Fulfillment of the Requirements for the Degree of
MASTER OF SCIENCE IN TRANSPORTATION
at the
Massachusetts Institute of Technology
June 2004
D 2004 Massachusetts Institute of Technology. All rights reserved.
-1 A ~-. '% -Signature of Author.
Department of Civil and Environmental Engineering May 7, ,004
Certified by_
1~ Joseph F 'Coughlin
Principal Research Associate Center for Transportation and Logistics Thesis Supervisor
Accepted by
Accepted by
Nigel Wilson Professor of Civil and Environmental Engineering Thesg Reader
H idi Nepf
OF TECHNOLOGY
JUN
0
7 2004
Chairman, Committee for Graduate Students
Driving Confidence and In-Vehicle Telematics: A Study of
Technology Adoption Patterns of the
50+
Driving Population
By
Thomas E. Hutchinson
Submitted to the Department of Civil and Environmental Engineering on May 7, 2004 in Partial Fulfillment of the Requirements for the degree of Master of Science in Transportation
Abstract
In-vehicle telematics is a term that encompasses a wide range of technologies, which aid the driving function through features assisting in safety and service tasks. These technologies are designed to give the operator and passengers added safety control and convenient service amenities- both of which contribute to an overall increase in piece of mind and satisfaction in the driving experience. Much effort has been exercised in the rapid development of technologies that comprise in-vehicle telematics systems. But, as is the case with many emerging technologies, these systems appeared on the market before thorough study of their impact on end users had even begun.
In recent years, several studies have shown the effects of various technologies on driver distraction, and many insightful results have emerged from that work. However, little has been done to understand consumer perception of these in-vehicle technologies. This thesis provides understanding of the role of in-vehicle telematics in today's automobiles and an analysis of survey data on driving confidence. Particular attention is given to the 50+ driving population, the nature of self-regulation among drivers in this age cohort, and the role that in-vehicle telematics can play in increasing confidence of older drivers. The objective of this thesis is to present the findings of a consumer perception survey in the context of the evolving dialogue on in-vehicle technologies and lay the groundwork for future studies on related topics. Findings in this work show that telematics can positively affect driving confidence, especially in the oldest women drivers. The results also show that telematics providers can greatly improve their delivery of these systems to appeal to a wider consumer base.
Thesis Supervisor: Joseph F. Coughlin
Acknowledgments
An exhaustive list of people that have helped me reach this point in life would be nearly impossible to compile and quite lengthy to boot. Indeed, if I were to attempt to repay the tremendous debt of gratitude that I owe to so many people, I can scarcely imagine having the time to be otherwise employed.
However, I would like to recognize some who have had lasting impacts on my life's direction. First, I would like to thank my family, especially my parents, for continued support and encouragement in all of my endeavors. Though some of my choices in life have been less than orthodox, you have given me the freedom to forge my own path on my own accord. There is, of course, no way to repay you for such love, but I do hope to pass it to the next generation.
I would also like to thank my advisor and mentor, Dr. Joseph Coughlin. You have given me the liberty to explore issues of the older driving population that were of great interest to me. And you have provided me with such valuable experience working with experts in both industry and academia. In addition, I am forever grateful for funding support from the MIT AgeLab, USDOT New England UTC, The Hartford, Nissan Motor Co., and Toyota Motor Co.
Thanks should also be extended to the fine professors in the Department of Civil and Environmental Engineering and the Engineering Systems Division at MIT. These and other instructors have sparked new interests in areas relating to transportation that I have only just begun to explore. I also must mention the students of the MST class of 2004, and also the classes of '03 and '05, who have challenged me in so many ways. Because of you, I feel I am much better prepared for work in this industry lined with "third rails".
Most importantly, I must thank my wife Chelsea whom I cherish and adore. You are an inspiration to me and to everyone who knows you. I am honored to be a part of your life and could not be more proud of you. May Him from whom all blessings flow, who is able to keep us from stumbling, guard our hearts and minds through our next adventure.
Table of Contents
A bstract...2
A cknow ledgem ents ... 3
Table of Contents...4
List of Tables ... 6
List of Figures...7
Chapter 1: Introduction and O bjectives... 8
1.1 In-V ehicle Telem atics... 8
1.2 50+ Driving Population ... 9
1.3 Bringing It A ll Together: Driving Confidence ... 9
1.4 Thesis Objectives ... 10
1.5 Thesis Outline ... 11
Chapter 2: Background and Motivation ... 13
2.1 Changing D em ographics... 13
2.2 Causes for Concern... 16
2.3 Self-Regulation ... 20
2.4 Telem atics...22
2.5 Technology A doption and V alue Perception... 27
Chapter 3: R esearch M ethodology...29
3.1 D ata Collection and Analysis... 29
3.2 Survey M ethod...30
Chapter 4: Survey R esults... 34
4.1 Sum m ary Statistics... 34
4.1.1 A ge...34 4.1.2 Education ... 35 4.1.3 H ousehold Incom e ... 36 4.1.4 Self-Reported H ealth ... 37 4.1.5 G ender...39 4.2 Regression A nalysis... 40 4.2.1 H ypotheses...41
4.2.2 Night Vision System ... 43
4.2.3 Autom atically D im ming M irrors ... 47
4.2.4 Collision W arning System ... 48
4.2.5 Em ergency Com m unications System ... 49
4.2.6 Rem ote Car U nlock Service... 50
4.2.8 Route Support Service ... 52
4.2.9 Personal Concierge Service ... 53
4.2.10 Alternative Transportation Contact Service... 54
4.2.11 Sum m ary Regression Discussion... 55
4.3 Regression Post M ortem Cross-tabulations...64
Chapter 5: Im plications of Results...68
5.1 OnStar ... 68
5.2 iDrive ... 71
5.3 Alternative Strategies and Business Models for the Telematics Industry ... 73
Chapter 6: Conclusions and Recommendations ... 77
6.1 Conclusions...77
6.2 Speed Bumps for Telem atics ... 78
6.3 Recom m endations for Future Research... 79
References...82
Appendix A : Survey Questionnaire ... 85
Table Table Table Table Table Table
List of Tables
2-1: 2-2: 2-3: 2-4: 2-5: 2-6:Percent Change in Number of Trips...15
Model Choice of 65+ Population ... 16
Example Causes of Self-Regulation... 21
Telematics Safety Features...23
Telematics Service Features... 25
Research Agenda for Older Drivers and ITS ... 26
Confidence Comparison Among Age Brackets for Select Technologies ... 34
Indifference Levels of Two Education Cohorts ... 35
Confidence Comparison Between Genders for Select Technologies...40
14c with Sociodemographic Variables... 43
14c with Sociodemographic Variables (revised)... 44
14d Final Model ... 47
14e Final M odel... 48
14f Final M odel... 49
14h Final Model ... 51
: 14i Final Model ... 52
: Typical Characteristics Table... 63
: Hypotheses vs. Actual Results for Expected Coefficient Signs... 63
: Driving at Night Self-Regulation Cross-Tabulation ... 64
: Driving in Unfamiliar Areas Self-Regulation Cross-Tabulation ... 65 Table 4-1: Table 4-2: Table 4-3: Table 4-4: Table 4-5: Table 4-6: Table 4-7: Table 4-8: Table 4-9: Table 4-10 Table 4-11 Table 4-12 Table 4-13 Table 4-14
List of Figures
Figure 3: Responses to Driving Confidence for Each of 11 Technologies...32
Figure 4-1: Technology Ownership by Income Bracket...36 Figure 4-2: Response of Much Higher Confidence (Segmented by Self-Reported Health)..38 Figure 4-3: Response of No Change in Confidence (Segmented by Self-Reported Health).39 Figure 4-4: Comparison of Numbers of People Choosing to Self-Regulate ... 61
Chapter 1: Introduction and Objectives
The following chapter will begin by defining the two main ideas introduced in the title of this work: in-vehicle telematics and the 50+ driving population. Then these two terms will be related by driving confidence, the variable under consideration in the following analysis. Finally, this chapter will outline the overall goals and specific chapter content contained in this thesis.
1.1 In-Vehicle Telematics
Telematics has often been defined as a "wireless communications system designed for the collection and dissemination of data""'. This definition is helpful for understanding the full measure of telematics capability. Not only can such systems read and store data, but they also have the capacity to write data as information is processed. And telematics have the added ability to operate wirelessly, without the burden of being tied down to landline connections. Obviously these characteristics open up a tremendous realm of possibility for innovation and application.
One such application is in the automobile- hence the term in-vehicle telematics. Here the capabilities of these systems are exploited to provide the driver with valuable safety and service features that enhance the driving experience. Many of these features employ global positioning systems (GPS), which enable the vehicle's position to be recognized by a remote third party. Such knowledge can be useful for obtaining directions when lost, for receiving advice on the closest outlet for a specific purchase, or for retrieving a lost or stolen vehicle.
But GPS tracking is hardly the only interesting feature of existing telematics systems. Technology is also in place that can interpret and project images from the roadway to enhance nighttime vision for the driver. Collision warning systems have also gained in popularity recently. This telematics device delivers an audible warning when onboard sensors detect a
I http://www.webofficials.com/glossary.htm
2 http://www.mobilecomms-technology.com/contractors/handset/mobileglossarytz.html 3 http://www.gsmworld.com/technology/glossary.shtm1
nearing object that threatens collision. These and other in-vehicle features have the potential to positively impact the driving public. In the future, new and better systems are likely to come to market, creating even more opportunity for increased safety and convenience.
1.2 50+ Driving Population
The 50+ driving population is simply the group of people over the age of 50 who are licensed to drive and do so regularly. This cohort is of interest because physical and mental abilities have begun to decline in many people by this stage in life. These abilities, including visual acuity, flexibility, and reaction time, are crucial for safe automobile operation. Without these and other related skills, the driver and those with whom the driver interacts on the road, are put at increased risk for crash.
Cognizant of this fact, many older drivers have chosen to restrict their driving habits to correct for age-related skill deficiencies. Such practices are called self-regulation and can include the avoidance of night driving, avoidance of unfamiliar areas, or avoidance of such conditions as poor weather or heavy traffic. If problem drivers stay off the roads to avoid potentially high-stress conditions, road safety can be improved. But this has less than ideal impacts on those self-regulating their behavior. Self-regulation is essentially self-imposed, denied mobility. And denying oneself access to automobile transportation under certain conditions can eventually lead to feelings of isolation and loneliness. Therefore, new solutions must be tailored to the 50+
driving population in order to maintain high quality of life and ensure safety for the rest of the driving public.
1.3 Bringing It All Together: Driving Confidence
Having defined both in-vehicle telematics and the 50+ driving population, one may wonder if there is a helpful connection between them. This work argues that there is indeed a very helpful connection. Telematics systems presently have the ability to provide valuable safety benefits, and these benefits are likely to multiply in future iterations. Safety gains from in-vehicle
telematics could help the 50+ driving population address core performance concerns related to vision, flexibility, and cognitive capacity.
The potential of these systems to increase safety is encouraging but would be meaningless if older drivers failed to adopt these technologies. After all, it is more likely that drivers in this cohort are not as comfortable with advanced technology either because they feel unqualified to manipulate it due to their own degraded physical and mental skills, or because they have little past experience with technology at all. One way to gauge the adoption patterns of the 50+
driving cohort is to examine the impact that telematics have on driving confidence. If telematics could lead to driving confidence gains, these drivers may achieve the safety benefits of a technique like self-regulation without the detrimental consequence of isolation. Of course, if these drivers were wary of adopting such new technology for any of the reasons just described, they would indicate that these systems do not increase driving confidence. But for those who do see confidence gains from telematics, adoption is more likely, and the telematics industry must seize the opportunity to market to these consumers.
1.4 Thesis Objectives
This work examines the self-regulatory behavior of older drivers and explores the feasibility of in-vehicle telematics. Using a nationwide survey, advanced vehicle technologies are held to the flame of consumer opinion. This paper analyzes the relationship between older drivers perceptions of in-vehicle telematics and the confidence to drive in light of self-regulatory behavior and strives to answer the question: Do in-vehicle systems and services affect the confidence of older drivers to drive?
In addition, this thesis aims to relate these findings on driving confidence to the current practices of the players in the telematics field. Brief case studies of telematics providers are presented to illustrate the present state of the industry. Then alternatives are described and recommendations are made to reconcile the 50+ driver survey responses with what telematics companies could be providing the driving public. This body of work will attempt to improve the state of the art in
telematics provision by arguing for changes in business models and marketing strategies based on the results from the in-depth survey analysis.
1.5 Thesis Outline
This discussion is organized into six chapters and an appendix as described below.
Chapter 2: Background and Motivation
This chapter builds the case for implementation of in-vehicle telematics systems as a strategy worthy of consideration for assisting the 50+ driving population. The problem is framed through a description of the changing demographics of the U.S. population and the consequences that result from these changing demographics. One well-documented solution, self-regulation, is discussed and its faults are brought to light. Finally, telematics is presented as a potential solution to the problems described earlier in the chapter.
Chapter 3: Research Methodology
Beginning with a description of common research techniques, this chapter outlines the course of action taken in this thesis in analyzing technology adoption patterns of the 50+ driving population. Popular methods for data collection and analysis are discussed and the particular method employed in the chapters that follow is presented as well.
Chapter 4: Survey Results
The survey data are thoroughly explored in this chapter. It begins with summary statistics of interesting trends in different demographic groups. Then the chapter presents the results of the regression analysis as each telematics technology is regressed on a set of independent variables. It concludes with a cross-tabulation summary that was motivated by some of the interesting results from the regressions.
Chapter 5: Implications of Results
Results from Chapter 4 were not meant to stand alone. Rather, they were to be mapped to current initiatives in the telematics field. This is done so that empirical findings can be
compared to real-world implementation, resulting in recommendations for alternative development and delivery methods. This chapter takes the empirical findings of the previous chapter and discusses the implications on the telematics marketplace.
Chapter 6: Conclusions and Recommendations
The last chapter of this thesis provides a wrap-up of all the important ideas presented. It also discusses potential pitfalls in the telematics industry and provides recommendations for future research in the field that would add to the body of work in this thesis and expand the knowledge base in the industry.
Appendix A: Survey Questionnaire
The survey is attached, in its entirety, as a helpful tool for the reader in understanding the sequence and delivery of the questions that were explored in the data analysis.
Appendix B: Chapter 4 Tables
Chapter 2: Background and Motivation
In-vehicle telematics have received increased attention from consumers, manufacturers, and the media in recent years. The following chapter will describe some of the more popular telematics offerings on the market today and their potential impacts on the driving public. Before this, however, it is critical to understand the motivation for discussing the relationship between these technologies and older drivers. Therefore, the first part of this chapter will provide background information, clarify the problem, and build a case for new, creative solutions- one of which is in-vehicle telematics.
2.1 Changing Demographics
In the year 2025, persons aged 60 and older will make up one-quarter of the U.S. population. Census figures indicated less than one-fifth had reached this level of maturity by the year 2000. The number of persons aged 65+ in the year 2000 (35 million) is expected to double to 70 million by the year 20304. In addition American Baby Boomers (those born between 1946-1964) are turning 50 at the rate of one every seven seconds. These Boomers have had a tremendous impact on society throughout their lives, and there is no reason to think they will not continue this trend in their winter years.
Indeed, society is graying at an unprecedented pace. And this is not just true in the U.S. In fact, older adults comprise an even larger proportion of the populace in Japan and throughout Europe. The United Nations forecasts that by 2050, one out of three persons in developed countries will be over 60 years old5. Undoubtedly, this shift of numbers among age groups will have tremendous impacts on society at large.
Interestingly, there is a twist on the significance of the growing numbers of elderly. Rather than living the older lifestyles that their parents lived, the new older population is more closely mimicking certain attributes of the younger population. That is, they are more active and
4 U.S. Department of Commerce 2001
engaged in their communities than generations of elderly before them. People in the new older population do not live sedentary lives, content to sit back and watch their remaining time slip away. Simply put, the 50+ age cohort has evolved dramatically in recent years and dismissing this age group as chronically ill or marginally disabled is more outlandish today than ever before.
Martin Wachs6 argues that personal health, education level, and income are the critical determinants of active lifestyles. Interestingly, these are three areas where the older population has seen tremendous advance in recent years. Therefore, reason suggests that these older adults will demand and be capable of pursuing more "youthful" lifestyles than their parents and
grandparents7.
The same is true not only in the United States, but also in other parts of the world. Older adults in developed countries are in far better health than previous generations at the same age. In fact, some studies indicate that as many as 40% of those over 65 report good or excellent health. Even controlling for income effects, there appears to be a decline in disabled elderly. However, diagnosis of chronic disease has continued at historical levels. This apparent contradiction is explained by advances in medical care that have allowed older adults to manage illness rather than live at the mercy of otherwise debilitating sickness.
This increased level of health is one of the main factors influencing forecasts for older adult travel demand. Bush states, that due in part to better health, the emerging elderly population can be expected to travel more than the current group8. She specifically notes differences between American Baby Boomers and generations before them. Burkhardt et al. have concluded that vehicle miles traveled (VMT) by older Americans will increase by 35% in the 30-year period from 1990 to 20209, but even these results seem conservative. That research fails to include many of the changing demographics that so drastically influence travel demand. This leads to an underestimate of VMT and begs further analysis.
6 Wachs 1979
7 Coughlin 2003
8 Bush 2003
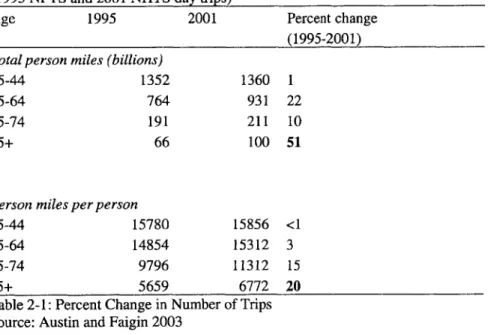
Austin and Faigin measured travel exposure across age groups using data from the 1995 10 Nationwide Personal Travel Survey and the 2001 National Household Transportation Survey. The results show a tremendous percent change in number of trips among the oldest group.
Changes in total person miles traveled in privately owned vehicles by age (1995 NPTS and 2001 NHTS day trips)
Age 1995 2001 Percent change
(1995-2001)
Total person miles (billions)
25-44 1352 1360 1
45-64 764 931 22
65-74 191 211 10
75+ 66 100 51
Person miles per person
25-44 15780 15856 <1
45-64 14854 15312 3
65-74 9796 11312 15
75+ 5659 6772 20
Table 2-1: Percent Change in Number of Trips Source: Austin and Faigin 2003
The changes above provide evidence that mobility for the oldest segment of the population continues to evolve, ensuring that travel patterns will be significantly different than for previous generations. The first bold value (51%) shows the impact of the growth in absolute numbers of the older population. The second value (20%) shows the effect of changing demographics (better health, and higher socioeconomic status) on the travel behavior of the older population.
Other factors that are positively correlated with increased demand for travel are educational attainment and household income. In the United States, the number of 50+ adults with a college degree has doubled in the last 20 years. And this same age group, which makes up just 20% of the total U.S. population, maintains control over 40% of all disposable income. This combination of brains and dollars suggests the current 50+ cohort has significant buying power combined with a propensity to shop "smart". It follows that these older adults will likely behave similarly when faced with decisions relating to the consumption of transportation.
2.2 Causes for Concern
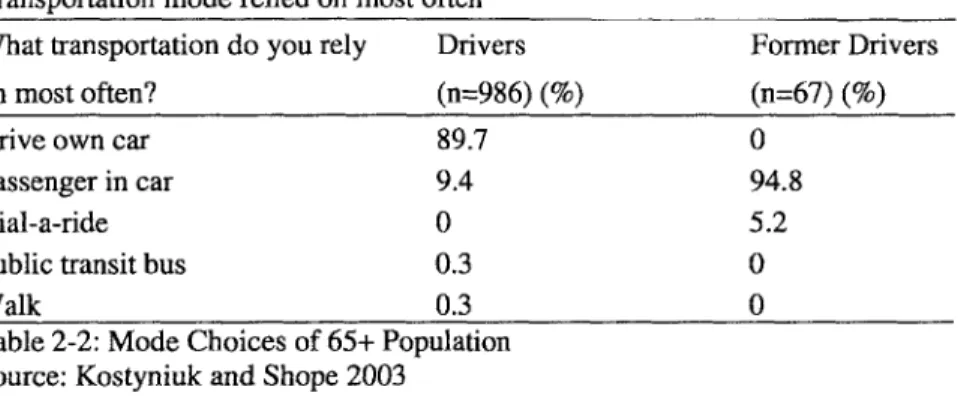
This increased mobility among the older population raises concerns for several reasons. The first is the fact that older adults will achieve this high level of mobility in their cars. Personal mobility, for most, is synonymous with individual freedom and independence. Without it, a person is unable to participate in all the daily events that, in aggregate, are life. In the United States, the mechanism for personal mobility is most often the automobile. A statewide survey of Michigan drivers aged 65 and over provides perspective on the mode choices of this older cohort".
Transportation mode relied on most often
What transportation do you rely Drivers Former Drivers
on most often? (n=986) (%) (n=67) (%)
Drive own car 89.7
Passenger in car 9.4
Dial-a-ride 0
Public transit bus 0.3
Walk 0.3
Table 2-2: Mode Choices of 65+ Population Source: Kostyniuk and Shope 2003
0 94.8
5.2
0
0
The table above illustrates the heavy dependence that these respondents place on the automobile for their transportation needs. It is notable that transit accounts for less than 1% of trips. What is more striking is that of those surveyed, over 33% stated that bus stops were in place within 2 miles of their homes. While much has been done to close this mode split gap through various incentive-rich carrots and regulatory sticks, the fact remains: the automobile is, and for the foreseeable future will be, the dominant choice for the older adult population.
America's level of auto dependence is truly remarkable. In the year 2000, only 3.8% of commuters used transit for their journey to work'2. Transit usage for non-work trips was not much higher. But even more startling was that less than 10% of Americans lived near a transit alternative. The elderly population, along with the rest of the country, is inescapably tied to their cars for mobility. Without viable options in place, either traditional transit services or alternative
"1 Kostyniuk and Shope 2003
accessibility mechanisms, potentially dangerous drivers are forced to continue driving in order to live life. Even in parts of Michigan, as the example above illustrates, those who do consider their areas transit accessible still do not frequent those alternatives.
Consequently, it is imperative to address the concerns that a growing elderly driving population poses to the general public. It is well documented that as people age, vision, cognitive capacity, perceptual acuity, and physical dexterity all begin to decline'3. Past research supports the theory that these age-related declines are associated with increased accident risk. (This risk constitutes the second area of concern regarding the growing older adult population.) And while all of these abilities are necessary for safe operation of the automobile, there are a myriad of obstacles to assuring that seniors behind the wheel still have the minimum capacity necessary to drive safely.
Driver testing and re-licensing are controlled at the state level in the U.S. And there is tremendous variability in requirements from one state to the next in obtaining or renewing one's license'5. Since this area of public policy is so politically charged, yet so inconsistently regulated, it is doubtful that one comprehensive program for older driver re-licensing could ever be universally adopted. However, serious thought must be given to this issue, because allowing inept drivers to remain behind the wheel can prove devastating.
Accidents where older drivers are blamed for continuing to drive past their competence can be very public and very tragic. In July of 2003, an 86-year-old driver in Santa Monica, California crashed into a farmer's market killing 10 and injuring dozens others. The event captured the public's attention and temporarily fueled discussion on elderly travel. Many other similar, though less newsworthy, crash events have devastated families and upended lives. These kinds of headlines could appear with greater frequency in future years due to the ever-growing, increasingly mobile older population.
13 Skinner and Steams 1999 14 Brayne et al. 2000 15 Coley 2002
At least two mechanisms exist for testing older drivers in an attempt to minimize costly accidents. The first of these is driving simulation. While all details of the driving environment cannot be fully captured through these artificial scenarios, this testing strategy is ideal from a cost-effectiveness standpoint. Recent work by Lee et al. suggests that regardless of obvious shortfalls, a driving simulator can be used to identify drivers at inflated risk of motor vehicle crashes 6. And this early identification could help these drivers take steps to improve their driving behavior before they experience trouble on the roads.
Another driver testing mechanism is on-road evaluation. Stutts and Wilkins argue that such evaluations are a potential tool for helping older adults drive safely longer1 7. But in their study, the researchers found that apart from driver education classes like AARP's 55 Alive Mature Driver class, only 2% of respondents said they themselves had participated in an open-road driving evaluation.
Though more costly than driving simulation, on-road testing can better assess the skills and abilities of the driver. The comparison between these two testing strategies is akin to stated preference and revealed preference survey implementation. In stated preference surveys, as in driving simulation, any imaginable scenario can be tested and nearly unlimited data can be collected. However, the results must be viewed with caution because there are no tangible consequences for responses the subjects give. Likewise, if a subject crashes or speeds in a simulator, it is not going to harm the subject or their driving record.
On the other hand, on-road testing allows the evaluator to test real reactions to real events in a consequence-rich environment. Just as revealed preference surveys show what actually takes place, so road testing provides genuine information about driver behavior. Of course, liability and safety concerns prevent the evaluator from introducing complex mechanisms to test the limit of the driver's ability. Thus both driver-testing protocols have significant flaws, which limit the power of the evaluator to effectively judge driving competence.
16 Lee et al. 2003
So far, this chapter has discussed five reasons for concern for the future of older adult travel. They are, in the order of appearance:
* Increased absolute numbers of older people, including the aging Baby Boomers
* Increased mobility of the older cohort due in part to better health, higher income, and higher levels of formal education
* Sustained levels of dependence on the automobile
" Declining physical and cognitive capacities as people age
* The failure of, and inherent difficulty in implementing, testing strategies to catch all driving problems before an accident
A final reason for concern stems from the evolving female lifestyle. In general, women of earlier generations made fewer trips than their male counterparts' . But emerging generations of women, including the Baby Boomers, made more trips than males during the last decade of the 20 century 9. This is due in large part to increased labor participation rates . More often, women are responsible for duties both in the workplace and in the home. This leads not only to more frequent work commutes, but also patterns of trip chaining following the workday as these women attend to the tasks of running their home. All of this implies increased VMT from a gender that was once grossly underrepresented on the roadways.
Recent research results suggest that older women are over represented in crashes that occur under the "safest" conditions, in daylight, when traffic is low (not at rush hour), when the weather is good, and when the roads are dry . And even though this study failed to control for exposure to risk, the results bring to light an important idea. That is, when addressing the concerns of the ailing female driver, one needs to seek solutions that have impact before the driver even gets behind the wheel. Frailty in older adult women constrains the solution set to the realm of prevention, because it seems that once an accident has occurred, the probability of serious injury among this cohort is very high.
1 Spain 1997
19 See 1995 Nationwide Personal Transportation Survey
2 0
Fullerton 1999 21 Baker et al. 2003
2.3 Self-Regulation
Clearly the automobile is, and will continue to be, at the center of the older adult lifestyle- a lifestyle that is expected to be much more active than older adults before them in terms of both VMT and absolute number of trips. So the question arises: What action can be taken to ensure road safety for this ever-present, yet potentially impaired driving cohort? Luckily there are ways to mitigate these effects, thus ensuring safe automobile operation in later years.
Self-regulation has been touted as an effective mitigation strategy for older adults. Self-regulation is a series of "self-generated thoughts, feelings, and actions that are planned and
,22
cyclically adapted to the attainment of personal goals" . With respect to driving, this term denotes choices that limit specific tasks that may no longer be second nature, such as night driving, freeway use, or left-hand turns. Drivers usually take these precautions when their confidence dips to a level where they no longer feel comfortable performing such tasks. Some researchers have lauded self-regulation as a safety-enhancing strategy, but such praise may not be warranted.
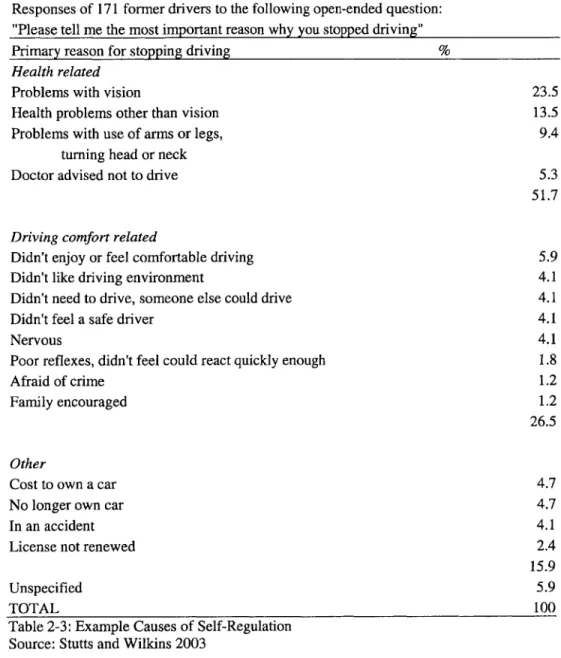
The following list is exemplary of the motivation behind personal self-regulation decisions:
Responses of 171 former drivers to the following open-ended question: "Please tell me the most important reason why you stopped driving"
Primary reason for stopping driving %
Health related
Problems with vision 23.5
Health problems other than vision 13.5
Problems with use of arms or legs, 9.4
turning head or neck
Doctor advised not to drive 5.3
51.7
Driving comfort related
Didn't enjoy or feel comfortable driving 5.9
Didn't like driving environment 4.1
Didn't need to drive, someone else could drive 4.1
Didn't feel a safe driver 4.1
Nervous 4.1
Poor reflexes, didn't feel could react quickly enough 1.8
Afraid of crime 1.2
Family encouraged 1.2
26.5
Other
Cost to own a car 4.7
No longer own car 4.7
In an accident 4.1
License not renewed 2.4
15.9
Unspecified 5.9
TOTAL 100
Table 2-3: Example Causes of Self-Regulation Source: Stutts and Wilkins 2003
Stutts and Wilkins note from this table "over a fourth [of respondents] offered reasons that were not tied to any specific medical condition or event, but which were more related to a lack of
confidence [emphasis added] in their driving ability and a lack of comfort [emphasis added]
driving under current roadway and traffic conditions".
While these self-regulatory practices may bring marginal increases in safety for older drivers and those whom with they interact on the roads, driving restrictions can have detrimental effects on those implementing them. Self-regulation alters the lifestyle of the driver, in effect denying them a level of mobility they once enjoyed. This in turn leads to decreased quality of life as driving freedom and independence are curtailed. Certainly, self-regulation can achieve safety gains, but the negative effects on one's freedom to go where one wants, when one wants, can strip an individual of dignity and cause physical and mental declines due to isolation.
Adjustments to drivers can help achieve increased road safety. But as discussed above, it is very difficult to take something away as critical as the driving privilege because of what the car means to so many Americans. Therefore, clever strategies need to be developed to keep older drivers behind the wheel for as long as possible. These strategies must address both the mechanics of safer driving and help increase the confidence of these drivers. The strategy described in this work involves altering the automobile and could potentially achieve significant safety benefits while maintaining quality of life for older adults. Following is the introduction to this safety enhancing strategy, in-vehicle telematics.
2.4 Telematics
Often defined as the blending of telecommunications and computing technology, telematics serve the pursuit of conveying information to users and improving operating functions. One prevalent application of telematics is in the automotive industry. Here, telematics is manifest in systems designed to improve safety and convenience for the automobile occupants. The bulk of these systems are realized as features lumped into one of the following two groups: safety or service. In the following sections, these two distinct telematics offerings will be discussed.
Telematics Safety Features
A wealth of telematics safety features has hit the market in recent years. These options are designed to increase driver confidence and help prevent costly accidents. In fact, these systems may actually improve driving for older drivers by compensating for declining physical and
mental abilities. In the early stages of development, engineers have attempted to advance these technologies without adding significantly to driver distraction. For the most part, these efforts have proven successful. After initial familiarization, users are generally pleased with the features and agree that most do not significantly contribute to distraction. However, any new addition to the automobile requires some learning period, and that corresponding disruption can increase probability for driver error. But relative to their telematics counterparts - service features - safety enhancements provide positive benefits with minimal disturbance.
Safety-related technologies have been developed for a wide variety of applications. Some are designed to aid in accident prevention, and some are meant to speed response after accidents. But regardless of purpose, telematics providers have found a wellspring of potential in the provision of safety benefits that may have particular applications for the older population. Some popular safety features are presented in the matrix below.
Safety Feature Primary Benefit to Driver
Advanced Braking Maximum steering control in emergency braking Technology conditions- especially on loose surfaces (e.g. gravel) Larger Sized Auto Potential for increased protection in a wreck
Night Vision Technology Brings clarity and illumination to objects in the driver's line of sight
Intelligent Mirrors Glare reduction through automated dimming
Collision Warning Systems Increased time to react before contact with unperceived objects
Emergency Communications Sends for help even when occupants are unable to initiate
Systems communication
"Smart" Steering/Braking Automated control of operating systems to aid collision
Systems avoidance
Remote Diagnostics Alerts operator of mechanical failures that could lead to compromised safety in the near or long term
Table 2-4: Telematics Safety Features
Sustained demand for these services has spurred continued research into safety technology. It appears that consumers are willing to pay for the added piece of mind that these products provide. But of concern to some stakeholders, including NHTSA, is the increased tax on
cognitive capacity that such systems demand . Ironically, if designed poorly, telematics safety features could actually increase - instead of decrease - the operator's risk of crash. Based on somewhat condemning data provided by NHTSA and other automotive databases, regulators may soon be forced to respond to safety technologies in the car to ensure automakers are not, in fact, hindering driver safety.
One of the primary benefits to the older driver that safety-related telematics hold is the potential to curb self-regulation. As noted previously, self-regulation can have detrimental effects on those practicing it. The reasoning behind these decisions is based on intelligent facts: in some cases older drivers should not continue driving in challenging environments. Making the automobile smarter in more dangerous situations could meet the needs of specific deficiencies in a driver's competence and free that driver from having to take self-regulatory action.
For example, those drivers who have decided to avoid nighttime driving could exploit night vision technology and return to the roads after dark with increased confidence. Those with restricted head and neck movement could employ intelligent mirrors that provide better views, and less glare, than traditional car mirrors. And others who have limited their driving because of decreased reaction times, increased frailty, or concern over vehicle maintenance needs they can no longer detect can be comforted knowing their car will help them in these areas and eliminate these arguments for staying off the roads. Safety-related telematics has the potential to free older drivers of the prison that is self-regulation by shouldering the burden of tasks the driver can no longer perform.
Telematics Service Features
On the opposite end of the telematics spectrum lie service features. Meant to enhance the driving experience, not necessarily to make it safer, these features have attracted the attention of the connected public. The theme of information services where you want them when you want them has not been left out of the automobile. In fact today, the technology is already in place for
a moving information console providing real time assistance and allowing the driver to carry on much of the business of life while behind the wheel.
Of course, these features are plagued with controversy. Safety advocates argue that some service telematics require a level of driver attention that significantly increases the probability of accidents25. Harbluk and Noy describe the need for "a better understanding of the ways in which drivers interact with these devices," so that developments can be made toward the minimization of distraction level26. As noted earlier, driver distraction is documented as the catalyst for many auto accidents. And booking airline tickets or making dinner reservations, two actions that could become more common in the automobile, requires some degree of concentration diverted from the task of driving. Those concerned about vehicle safety have a strong stake in the presence of service telematics and any regulatory response that may follow.
The following table provides information on several of the more common service features and their benefits to the driver:
Service Feature Primary Benefit to Driver
Remote Door Unlock Assurance that assistance is available when keys are lost or locked in the car
Voice-activated Cell Phone Hands-free communication so the driver can maintain two-handed control of the wheel
Helpful guidance in unfamiliar areas or in situations Route Support where road/traffic conditions have deviated from the
norm
Personal Concierge A personal assistant available to make arrangements for the driver while on the road
Ride Assist Guarantee of alternative transport when driver is rendered incapable of vehicle operation
Stolen Vehicle Tracking Assurance that authorities will know the where and when of the owner's car location in case of theft
Table 2-5: Telematics Service Features
To date, market demand for such services is still unclear. Proponents and sales personnel cite consumer awareness as the major inhibitor to a telematics revolution. With smart advertising
25 Sovocool and Ventrelle 2000 26 Harbluk and Noy 2002
campaigns, they argue, sales would begin to escalate27. Critics of such service providers as
OnStar and ATX technologies counter with data that show subscription rates falling off drastically after a period of free use expires28. That data is very convincing and has lead to a race among providers and original equipment manufacturers to develop the best combination of technologies and price to meet consumer demand. In the absence of these efforts, service telematics would experience continued stunted growth.
Telematics technologies have reached a point where even the most technologically savvy critic would be impressed. Safety and service features satisfy many consumers' previously unmet desires for technology in the automobile to increase safety and make the driving experience more enjoyable and productive. In recent years some car owners have responded to the advent of telematics packages by paying extra for in-vehicle hardware and signing up for monthly service. But this activity has not lead to profitability for the most recognized provider, OnStar29
In 1998, Coughlin and Tallon30 proposed a research agenda for older drivers and ITS. ITS, or
intelligent transportation systems, is a term that includes in-vehicle telematics and other transportation enhancing technologies. Below is the table they used to summarize their ideas.
Technology Markets Public Policy
Deployment, e.g., which Human Factors, e.g Product Marketing, e.g., technologies offer near-NEAR-TERM driver workload. application bundling or term public benefit vs.
vehicle customization? which are readily available.
User Adoption, e.g., Driver Testing and System Integration, e.g., speed of technological Iicensing, e.g.,
LONG-TERM interface with other advance and user integration of new
systems and services. acceptance. technologies into testing
a I protocols.
Table 2-6: Research Agenda for Older Drivers and ITS (Source: Coughlin and Tallon, 1998)
27 Piszczalski 2003
28 Lienert sites unofficial values of around 20-50%
29 Gregor and Serroels state that OnStar must achieve a re-subscription rate of 80% to be profitable.
Clearly these issues beg further research. Telematics safety and service features have the ability to improve driving for older adults leading to increased safety not only for them, but also for others on the roads. However, the full implications of these systems on consumers, and the consequences for public policy are not yet fully understood. As Table 2-6 implies, user adoption and the resulting impacts on driver testing and licensing were significant issues in 1998. Today they are just as important, and must be analyzed further.
2.5 Technology Adoption and Value Perception
Technological innovation is not new to the automobile industry. Even during the tough economic times in the first years of the 2 1't century, the industry has answered the call to challenge the existing paradigms. One such call was issued by the publication Automotive Industries following September 11, 2001:
"To be a leader, an auto company needs to excel in all value disciplines simultaneously -- product innovation, process excellence, and customer intimacy. It is now time for innovation in product and service design, business process execution, and demand-chain planning and execution."31
Engineers are always quick to respond with the next "killer app". But these efforts fall short when consumers fail to pay for them.
The first example of this, which has been stated previously, is that of OnStar. Despite aggressive publicity campaigns, consumers have not responded in ways that General Motors had originally hoped. Another example of unsuccessful telematics offerings is BMW's iDrive system. Early response to this system has been predominantly negative with consumers complaining the system is too complicated, dealers citing considerable buyer resistance, and engineers arguing the design is ergonomically flawed3 2. And who can forget the infamous "talking car" manufactured by
Nissan in the 1980's. Users were quick to disable the system after they became unsure of its real assistive value.
3' Automotive Industries 2001 32 The Sunday Business Post 2003
As these examples illustrate, adoption of new technology is often harder to come by than the technology itself. In the case of in-vehicle telematics, companies must appeal to core consumer values such as safety and freedom. Only then will heads be turned and pockets opened.
At the heart of consumer demand is the idea of value perception (i.e. to what extent does a product add value to one's experience). Confidence is one consumer value that directly relates to the core values of safety and freedom. If driving confidence could be improved, perhaps self-regulatory behavior could be curbed. And this would provide adequate value for widespread telematics offerings. The analysis that follows directly addresses the idea of driver confidence.
Chapter 3: Methodology
The following chapter will review common methodologies for survey analysis and will introduce the specific methodology employed in the following chapters.
3.1 Data Collection and Analysis
Various techniques exist for market research and analysis. There are different mechanisms available for both collecting and processing information. Essentially there are two sources of information for market research: primary and secondary sources. The former are usually obtained with a specific analysis in mind and can include personal interviews, focus groups, mail/online/other surveys, or experiments. The latter group of sources is preexisting. Usually this data is collected by a public agency, such as the U.S. Census Bureau, and the databanks are available for widespread use.
Data from market research can be analyzed in several ways. Qualitative information can be gained from responses to questions giving color to issues of interest. For example, a focus group respondent may give some personal insight into a product under study. That insight could be helpful in determining future direction of product development. In this way, analysis of qualitative responses can prove influential with regard to industry advancement.
Quantitative information in the field of social science is gained most commonly through surveys administered to groups of people. When collected and analyzed as a whole, survey data can prove quite useful. In fact, information from just a small sample can often be generalized to the population as a whole. Of course, the researcher must ensure that the respondents represent the entire population and not just a limited group. For example, a survey administered only to high-schoolers in a predominantly Hispanic neighborhood in Texas would serve as a poor predictor of behavior for the entire U.S. population, or even for the state of Texas. Instead, the survey must be completed by respondents of all ages, incomes, geographic regions, etc. to truly have significance on a large scale.
This quantitative data can be examined in a number of ways. One of the more common methods includes basic summary statistics. Such statistics provide insight into general trends within the sample under consideration. For example, survey results may show that 80% of respondents choose to drive alone in their daily commute. Or, more specifically, results may show that 70% of men and 90% of women drive alone in their daily commutes. These are examples of simple summary statistics. Obviously, a large survey can lead to a tremendous amount of summary statistics. But in addition to these statistics, survey results can also be used in forecasting. This is done most commonly by building regression models.
Using 'a priori' assumptions, or truths knowable based on reflection alone, a general strategy for model construction is formed. Then different model structures, as well as different variable combinations, are tested for goodness of fit and individual variable significance. The process of choosing the best model from the batch of those produced is as much an art as a science. Of course, the model statistics are important, but so are the a priori assumptions. Once a final model is deemed acceptable, it can then be used as a forecasting tool for policy and planning decisions.
3.2 Survey Method
For this analysis, the population of interest was automobile drivers aged 50 and older. Drivers were defined as people who were licensed to drive and had driven an automobile at least once in the previous 12 months. The primary mechanism for obtaining information on this driving cohort was a nationwide (i.e. United States) survey. The survey was sent to a pool of respondents that had previously participated in a consumer marketing panel and had agreed to participate in periodic surveys.
In total, 7200 questionnaires were sent to drivers aged 50+ and 3859 were returned for an effective individual response rate of 53.6%. This sample of participants did not sufficiently represent the U.S. population as a whole, so the data were weighted to 2001 Current Population Study quotas on demographic characteristics. Furthermore, 35 of the respondents did not meet the 50+ age criteria and were thrown out of the analysis. These two adjustments left an effective
weighted individual sample size of 3819. As a result of these corrections, the survey results were estimated to be applicable to the U.S. population with accuracy of '/- 3%.
The fundamental question of this work (i.e. driving confidence) was posed in the following manner:
"There are a number of modem safety features and services available in automobiles today. Please think about whether your confidence in driving would change if you had the following available in your car."
The survey then went on to list 11 safety and service features next to a scale from 1 to 7 with a check-box associated with each number. A response of 1 indicated that the individual would be
much less confident with that technology, and a response of 7 indicated the driver would be
much more confident with it. The respondent could rate according to this scale or choose an 8th box, which indicated they already had this feature in their car3 3
A summary graph is provided in Figure 3. Note that although this image is quite busy, it does the best job illustrating the overall picture of driving confidence for the 50+ population when faced with 11 common telematics technologies.
33 In the directions for this question it was requested that each respondent check just one box for each of the eleven in-vehicle technologies. However, some who already had the feature checked that box along with a box on the confidence scale. It should be noted that, in this analysis, those respondents who checked two boxes were not thrown out of the data set. Rather, they were incorporated in the response set of both (just as if two separate individuals had checked those boxes). The effects of this decision are minimal, however, as the following analysis focuses primarily on the change, if any, in confidence level- not on the number of people who already have any particular technology. In the few cases where technology ownership is considered, the confidence responses are not. Therefore, no double counting of respondents took place.
Overview Statistics for Driving Confidence 35 0 30.00%- D ABS 7 U Larger Car C 2 Night Vision C 0 Dimming Mirrors
EColision Warning System
20.00% M Emergency Communications System
N Car Unlock Service
C OVoice-Activated Cell Phone
15.00%
Route Support
U Personal Concierge
10.00% DAltemative Transport Contact Service
5.00%
0.00%
Much Less Less Slightly Less No Change in Slightly More More Much More Confident Confident Confident Confidence Confident Confident Confident
Figure 3: Responses to Driving Confidence for Each of 11 Technologies
From this figure, one can see the individual results for each technology with respect to the absolute scale at the left and in relation to one another. Of particular interest are the responses received for "Personal Concierge" and "Alternative Transport Contact Service". Many respondents felt that presence of these technologies would actually decrease confidence in a significant way. This likely indicates a public cognizance of the driver distraction phenomenon which many believe leads to decreased safety. The knowledge that safety could be compromised led many participants to respond in this way. This is but one example of information that can be gleamed from this summary chart. In fact, the discussion of these results will continue in depth in the chapters that follow.
Figure 3 sparks more questions than answers. The purpose of the following chapter is to use personal demographic information in tandem with other survey question responses in order to explain why people react to in-vehicle telematics as they did in this exercise. It is clear from the data that differences in personal demographics as well as differences in driving behavior affected their responses to the posed question. Through a series of summary statistics, cross tabulations, and regression models, Chapter 4 sheds some interesting light onto the issue of driving
confidence in relation to in-vehicle telematics. In the end, a "typical" 50+ driver who finds telematics to be significantly confidence enhancing is described.
The tools employed to run this analysis include the following software packages: SPSS Graduate Pack 11.5 for Windows and Microsoft Excel. These packages allowed for data manipulation, regression model construction, and chart/table development.
The other piece to this analysis is contained in Chapter 5 and includes qualitative discussion of issues pertinent to the telematics industry. Brief case studies are presented on the experiences of two telematics providers including tried business models. The case studies were developed from published articles in magazines, newspapers, and journals. The case study method of research provides historical perspective to an issue. Case studies illustrate what's been done before and elucidate successes and failures. The value of this research method lies in the objective discussion of past experience. Obviously, lessons can be learned from such studies and improvements can then be made in future iterations.
Chapter 4: Survey Results
4.1 Summary Statistics
Following is a brief review of several independent variables and their relation to the telematics variables of interest. These are simply summary statistics derived from cross-tabulations performed to explore interactions among these variables. Results seen below provided motivation for the regression analysis that follows in section 4.2.
4.1.1 Age
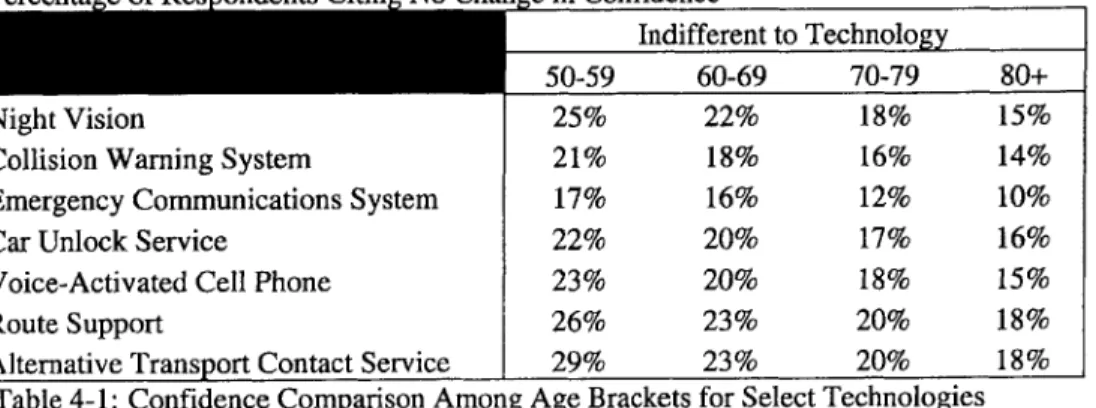
Population segmentation by age revealed interesting trends. For some of the technologies, there was an obvious pattern in the level of indifference across the age spectrum. This trend was true for both safety and service features. The following table outlines these differences:
Percenta e of Res ondents Citin No Chan e in Confidence
A i50-59 60-69 70-79 80+
Night Vision 25% 22% 18% 15%
Collision Warning System 21% 18% 16% 14%
Emergency Communications System 17% 16% 12% 10%
Car Unlock Service 22% 20% 17% 16%
Voice-Activated Cell Phone 23% 20% 18% 15%
Route Support 26% 23% 20% 18%
Alternative Transport Contact Service 29% 23% 20% 18%
Table 4-1: Confidence Comparison Among Age Brackets for Select Technologies
The table highlights the increase in indifference level in younger age cohorts. In short, younger respondents expressed "No Change in Confidence" with much higher frequency than older respondents. And those in the older age brackets who did think that these technologies would change their confidence level were much more likely to indicate some level of increase rather than a decrease in confidence.
Also of interest in this analysis was the response to Alternative Transport Contact Service. While only 10% of baby boomers (aged 50-59 at time of survey) indicated that the technology
would cause much more confidence in driving, more than twice as many in the 80+ age cohort felt the same way. Obviously, the oldest of drivers would be much more comfortable with an available alternative than younger drivers who less often have trouble in difficult driving situations.
For both "Automatically Dimming Mirrors" and "Larger Car for Increased Collision Safety", there were no striking patterns among age groups. The absence of differences among age cohorts is significant from a marketing and development perspective. Both safety features solicit similar responses for confidence level regardless of age.
4.1.2 Education
The results of the education-segmented analysis proved less intriguing. No striking differences among respondents with varying levels of formal education were evident. In fact, only the "Alternative Transport Contact Service" showed any significant result. Table 4-2 below provides these results:
Percentage of Respondents Citing No Change in Confidence Formal Education Does Not Include a College Degree 21%
College Degree Obtained 28%
Table 4-2: Indifference Levels of Two Education Cohorts
The above values indicate the levels of indifference to this service feature. The more highly educated group indicated with higher frequency that their driving confidence would not change with this feature. And the difference between these values for the less educated was skewed toward the "Much More Confident" end of the response spectrum. This implies the respondents with less education feel that, indeed, alternative mobility service would change their driving confidence level.
A discussion of the reasons for this result would be purely speculative. One may theorize that the highly educated are more experienced with technology and therefore less likely to be impressed by the novelty of new systems. Some may argue that the "gee whiz!" factor may affect the technological neophyte more easily than those of the techno-savvy population. In