READ THESE TERMS AND CONDITIONS CAREFULLY BEFORE USING THIS WEBSITE. https://nrc-publications.canada.ca/eng/copyright
Vous avez des questions? Nous pouvons vous aider. Pour communiquer directement avec un auteur, consultez la première page de la revue dans laquelle son article a été publié afin de trouver ses coordonnées. Si vous n’arrivez pas à les repérer, communiquez avec nous à [email protected].
Questions? Contact the NRC Publications Archive team at
[email protected]. If you wish to email the authors directly, please see the first page of the publication for their contact information.
NRC Publications Archive
Archives des publications du CNRC
This publication could be one of several versions: author’s original, accepted manuscript or the publisher’s version. / La version de cette publication peut être l’une des suivantes : la version prépublication de l’auteur, la version acceptée du manuscrit ou la version de l’éditeur.
Access and use of this website and the material on it are subject to the Terms and Conditions set forth at
Ice forces on the Nanisivik wharf
Frederking, R. M. W.; Sayed, M.
https://publications-cnrc.canada.ca/fra/droits
L’accès à ce site Web et l’utilisation de son contenu sont assujettis aux conditions présentées dans le site LISEZ CES CONDITIONS ATTENTIVEMENT AVANT D’UTILISER CE SITE WEB.
NRC Publications Record / Notice d'Archives des publications de CNRC:
https://nrc-publications.canada.ca/eng/view/object/?id=d0f29cde-bdc0-4f3f-88d8-e0cc69f57463 https://publications-cnrc.canada.ca/fra/voir/objet/?id=d0f29cde-bdc0-4f3f-88d8-e0cc69f57463S e r T H 1
N 2 1 d
INational Research
Conseil national
c. 2
1610*1
~ o u n c ~ ~ a n a d a
de recherches Canada
BLDG
-
Institute for
lnstitut de
Research in
recherche en
Construction
construction
Ice Forces on the Nanisivik Wharf
by R.M.W. Frederking and M. Sayed
Appeared in
Proceedings of the 9th International Symposium on Ice
Sapporo, Japan, August 23
-
27,1988
IAHR Committee on Ice Problems, Vol. 1
p. 463-472
(IRC Paper No. 1610)
Reprinted with permission
NRCC 30754
N R C-
C4STII
R
C
L I B R A R Y
o l
r
24 1289
--
B I B L I O T H ~ Q U E
I R C
CNRC-
ICiST -ILe present document examine les contraintes exerc6es par la glace et les facteurs
environnementaux au quai de Nanisivik en bordure du dktroit de Strathcona, dans
1'Arctique canadien, pendant l'hiver de
1985-
1986.
Le
&@meglaciaire
tst
caractkrisi
par
la formation de glace de rive de premibre
annke
qui atteint une 6paisseur maximale de
1,6
m
en mai. Le mecanisme premier de 1'apparitj.on de charges engendrees par la glace
i
cet
endroit semble
Stre
les deformations de la couvertute de glace attribuables
auxvariations de
temphture. Une analyse thermique basCe sut le comportement du fluage secondah p+&t
des contraintes therrniques inferieures
i
celles mesurees.
IAHR Ice
Symposium 1988
Sapporo
ICE FORCES ON THE NANISIVIK WHARF
R. Frederking and M. Sayed Research O f f i c e r s
Geotechnical Section I n s t i t u t e f o r Research i n Construction
National Research Counci 1 Canada CANADA
ABSTRACT
I c e stresses and environmental f a c t o r s a t N a n i s i v i k wharf on Strathcona Sound i n t h e Canadian A r c t i c are reported f o r t h e w i n t e r 1985/86. The i c e regime i s t h a t o f l a n d f a s t f i r s t - y e a r sea i c e t h a t a t t a i n s a maximum t h i c k n e s s o f 1.6 m i n May. The primary mechanism of generating i c e 1 oads a t t h i s 1 o c a t i o n appears t o be temperature-i nduced s t r a i n s i n t h e i c e cover. A thermal a n a l y s i s based on secondary creep behaviour p r e d i c t s thermal s t r e s s e s lower than those measured.
INTRODUCTION
I c e pressure measurements a t l o c a t i o n s i n t h e A r c t i c , g e n e r a l l y a t o f f s h o r e s t r u c t u r e s , a r e u s u a l l y designed t o generate i n f o r m a t i o n r e g a r d i n g t h e s a f e t y o f o f f s h o r e d r i l l i n g a c t i v i t i e s - ( H a w k i ns e t al., 1983,
P i l k i n g t o n e t al., 1983). The primary concern was w i t h t h e extreme o r maximum loads. I n t h i s study i n t e r e s t i s focused on a near shore
s t r u c t u r e , a sheet p i l e c e l l wharf constructed a t Nani s i v i k on Strathcona Sound (Girgrah and Shah, 1978). E f f o r t was focused on o b t a i n i n g a r e c o r d o f loads and associated environmental f a c t o r s over a complete w i n t e r season. This paper w i l l p r e s e n t t h e r e s u l t s o f measurements made by NRC over t h e w i n t e r 1985-86, p r o v i d e an i n t e r p r e t a t i o n o f t o t a l l o a d on t h e wharf, and discuss t h e i c e loads i n r e l a t i o n t o environmental factors. A
more complete record of t h e r e s u l t s i s a v a i l a b l e (Frederking and Sayed, 1987).
SITE
IAHR Ice Symposium
1988Sapporo
The Nanisivik Wharf i s located on t h e south shore o f Strathcona Sound (73'04'N-84'33'W) about 20 km from i t s o u t l e t . Strathcona Sound i s a f j o r d - l i k e f e a t u r e a t t h e n o r t h end o f B a f f i n I s l a n d i n the eastern Canadian Arctic. The width o f t h e Sound a t t h e wharf s i t e i s about 5 km; maximum t i d a l range i s 2.5 m. The wharf comprises t h r e e sheet p i l e c e l l s 21 m i n diameter, 38 m on centres, about 50 m offshore (Fig. 1). The t h r e e c e l l s are joined by an apron on the shore side, w i t h a causeway t o t h e shore. Maximum water depth a t the outer edge o f t h e c e l l s i s 13.5 m.
-0 0 0 -
f
, NO. 5/e-
-
N0.4 No. l-
-
N0.3\
'No. 2 -0- o-o- I C E MOVEMENT POINTS . \ - 0- -
0 - W H A R F 0-
m ? O J O i O S C ~ L I - mFIGURE 1 Schematic showing l o c a t i o n s o f i c e s t r e s s measuring instruments . i n s t a l l e d adjacent t o N a n i s i v i k wharf, w i n t e r 1985-86.-
MEASUREMENT PROGRAM
The f o l l o w i n g elements were measured: i n s i t u stresses i n t h e i c e cover adjacent t o t h e wharf, h o r i z o n t a l movements of t h e i c e cover, i c e temperatures, and meteor01 ogical data. I c e conditions were observed by means of a series o f s i t e v i s i t s and t h e use o f unattended data loggers.
Instruments were i n s t a l le d i n November, t h e i r operation v e r i f i e d i n March, and they were recovered i n May.
I n e a r l y November, f i v e panel -type transducers were i n s t a l l e d i n t h e l e v e l i c e cover adjacent t o t h e wharf t o measure i n s i t u stresses. Four panels were aligned p a r a l l e l t o t h e dock and one was placed normal t o i t
IAHR Ice
Symposium
1988
Sapporo
.
1 ). Panels No. 1 t o 4 were 1 m x 1 m, sectioned h o r i z o n t a l l y so t h a t t h e average s t r e s s i n t h e upper 0.5 m and lower 0.5 m c o u l d be measured independently. Panel 5, 1m
x 2 m, was h o r i z o n t a l l y sectioned i n f o u r s e c t i o n s each 0.5 m high. This allowed v e r t i c a l d i s t r i b u t i o n o f s t r e s s i n t h e i c e cover t o be measured. The f i v e panels provided a t o t a l o f 12 channels o f data. Output was recorded a t 15-minute i n t e r v a l s u s i n g a programmable battery-powered data l o g g e r able t o operate a t temperatures down t o -40'C. As problems were encountered i n i t i a l l y w i t h t h e logger, nore1 i able recordings were obtained u n t i 1 January 1986.
An e l e c t r o n i c distance-measuring
(EDM) instrument coupled t o a
t h e o d o l i t e ' w a s used t o measure movements o f reference p o i n t s on t h e i c e cover a t a number o f s e l e c t l o c a t i o n s . One a r r a y comprised n i n e reference p o i n t s arranged i n t h r e e l i n e s p a r a l l e l t o t h e face o f t h e wharf and 5, 25 and 55 m from i t (Fig. 1 ) t o determine h o r i z o n t a l movements . r e l a t i v e t o t h e wharf. A second a r r a y was e s t a b l i s h e d about 200 m t o t h e west o f t h e wharf and about 100 m from shore where t h e water depth was 5 m. This area was considered t o be r e p r e s e n t a t i v e o f a n a t u r a l beach and served as a b a s i s o f comparison w i t h h o r i z o n t a l i c e cover movements adjacent t o t h e wharf.I n November an automatic meteorological s t a t i o n was s e t up on t h e i c e s u r f a c e half-way across t h e Sound t o measure wind speed and d i r e c t i o n , a i r temperature, and temperatures i n t h e i c e . Data were recorded a t half-hour
i n t e r v a l s on a b a t t e r y powered logger. The thermocouple probe f o r measuring i c e temperatures had i n d i v i d u a l sensors a t depths o f 0.0, 0.25, 0.5, 0.75, 1.0, 1.5 and 2.0 m i n t h e ice.
RESULTS
AND
DISCUSSION
Results from i c e s t r e s s panel No. 3 f o r t h e p e r f o d 20 January t o 16 May, 1986 are shown i n Fig. 2. The r e s u l t s f o r a l l t h e panels were s i m i l a r . Panel No. 2, which was normal t o t h e face o f t h e wharf, showed stresses s u b s t a n t i a l l y l e s s than 100 kPa, except f o r a s h o r t p e r i o d a t t h e end o f March when they s l i g h t l y exceeded 100 kPa. The zero s t r e s s l e v e l e s t a b l i s h e d f o r these readings was taken i n November j u s t a f t e r t h e panels had been placed i n t h e i c e cover. I n e a r l y March s l o t s were c u t around t h e panels t o r e l i e v e t h e s t r e s s on them, thereby checking t h e zeros. A f i n a l s e t o f zero readings was obtained i n May when t h e panels were removed. The
IAHR Ice
Symposium
1988Sapporo
w x i m u m v a r i a t i o n i n the 'zero' stress l e v e l s was l e s s than 40 kPa, i n d i c a t i n g t h a t t h e panels were r e l a t i v e l y f r e e from zero d r i f t . The
concentration o f t h e l a r g e s t i c e stresses i n t h e t o p 0.5
m
o f the i c e cover was t y p i c a l f o r a l l panels. The maximum measured pressure was about425 kPa on 18 February, 1986 and occurred on t h e upper 0.5 m sector of panel 3.
500
-
LEGCNO
PANEL NO. 3 (EAST)
UPPEP 0.5 r..CO!tZ il:?.I!--
100
-
500
-
-1W ,
ao 27 1 1 0 1 7 2 I ID 17 n 31 r 1 4 21 a s 1 1 13
JANUARY FEBRUARY RARCH RPRIL MAY
1986
Figure 2 Results o f i c e pressure panel No. 3 f o r t h e period 1986 January
20 t o May 16.
Horizontal movements o f a l l nine reference p o i n t s next t o the wharf and t h e array o f p o i n t s 200 m t o the west o f i t were remarkably s i m i l a r , i n d i c a t i n g t h a t t h e i c e cover i n t h i s area e s s e n t i a l l y moved as a body. The movement r a t e averaged over the f i r s t h a l f of t h e w i n t e r was 40 mnlday; f o r t h e l a t t e r h a l f o f t h e winter i t had slowed t o 20 mnlday. The
d i r e c t i o n was n o r t h e r l y . Such movements have been measured previously a t t h i s l o c a t i o n (Frederki ng and Nakawo, 1984).
Close examination of two l i n e s o f reference p o i n t s 25 and 55 m n o r t h of the outer face o f the wharf showed t h e i c e cover t o be undergoing
fve s t r a f fis f n a d i r e c t i o n normal t o
the
outer face o f t h e wharf. For the f i r s t h a l f o f t h e w i n t e r the t o t a l s t r a i n change i n a n o r t h e r l y d i r e c t i o n was -1.6 x o r a s t r a i n r a t e o f 1.7 x 10 l"sl. That. i n t h e second h a l f of t h e winter, was -2.0 x o r a s t r a i n r a t e o f 2.9 x 10 -los-1.
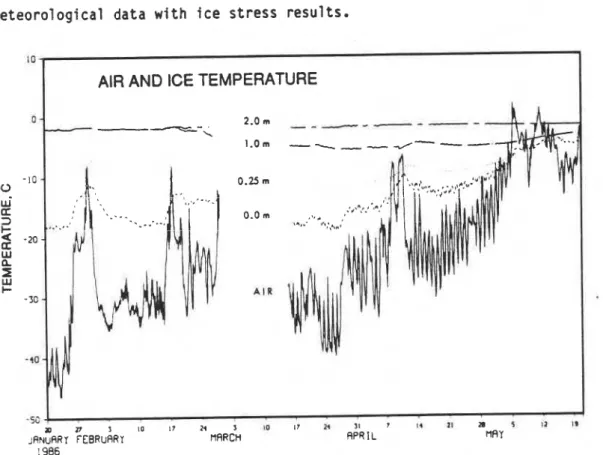
A i r temperature and i c e temperatures a t various depths measured a t t h e centre o f the Sound f o r t h e period 20 January t o 21 May, 1986 are p l o t t e d i n Fig. 3. This time i n t e r v a l was selected t o f a c i l i t a t e comparison o f meteorological data w i t h i c e stress results.
10
AIR AND ICE TEMPERATURE
A I R
-sc J
XI n 1 10 I? 24 1 10 17 n 11 7 1 4 ZI n 5 11 19
JANUARY FEBRUARY IlARCH APR 1 L MAY
! 986
Figure 3 A i r temperature and teniperature a t various depths i n t h e i c e cover f o r the period 1986 January 20 t o May 21.
The i c e conditions on t h e Sound could be characterized as landfast f i r s t - y e a r sea i c e having a very l e v e l surface.
In
November i c e thickness was 0.3 m. By t h e beginning o f March i t was 1.2 m, increasing t o 1.5 m by May. Ice cores taken i n March indicated an average s a l i n i t y o f 5.5*/..
3
IAHR Ice
Symposium 1988
Sapporo
t u r e t o be columnar over t h e e n t i r e thickness o f t h e i c e cover. A zone o f i c e about 4 m t h i c k and 8 m wide and hinged t o t h e l e v e l fi rst-year i c e accomodated r e l a t i v e v e r t i c a l movements o f t h e i c e and the wharf due t o tide. This feature, termed t h e ' a c t i v e zone' has been observed previously a t the s i t e (Frederking and Sinha, 1978; Frederking and Nakawo, 1984).
LOAD INTERPRETATION
The r e s u l t s f o r t h e f o u r s t r e s s panels aligned p a r a l l e l t o the wharf were combined t o determine an average e f f e c t i v e l i n e a r load a c t i n g on the wharf. For each panel t h e stress was m u l t i p l i e d by t h e area of the sector on which i t was acting. These loads were summed t o get t h e t o t a l load a c t i n g through t h e depth o f the i c e cover f o r t h e panel width, i n a l l cases 1 m. These r e s u l t s were then averaged t o o b t a i n an average i c e force per u n i t width o f t h e structure. The r e s u l t s o f t h i s c a l c u l a t i o n f o r the period 20 January t o 16 May, 1986 are p l o t t e d i n Fig. 4. The maximum i c e load (averaged over t h e width o f t h e wharf) was 175 kN/m and the average 1 oad was 50 kN/m.
300
-
AVERAGE FORCE
P U 1 10 17 24 1 10 17 24 11 7 I4 21 71 1 I I 13
JANUARY FEBRUARY MRRCH APR I L IlRY
1 9 8 6
- Figure 4 Average i c e f o r c e per meter o f width a c t i n g on Nanisivik wharf f o r p e r i o d 1986 January 20 t o May 16.
The ave temperature
IAHR Ice
Symposium 1988
Sapporo
'rage i c e l o a d appears t o be r e l a t e d t o changes i n a i r (compare Fig. 3 and 4). There i s a general correspondence between a i r temperature and i c e load; i.e., an increase i n a i r temperature leads t o an increase i n i c e load and v i c e versa. There i s not, however, a d i r e c t correspondence between t h e magnitude o f t h e a i r temperature change and t h e magnitude o f t h e average i c e l o a d change. For example, t h e a i r temperature increase i n l a t e January was much l a r g e r than t h a t i n l a t e February, b u t t h e i c e l o a d increase i n l a t e February was more than t w i c e t h a t f o r January.
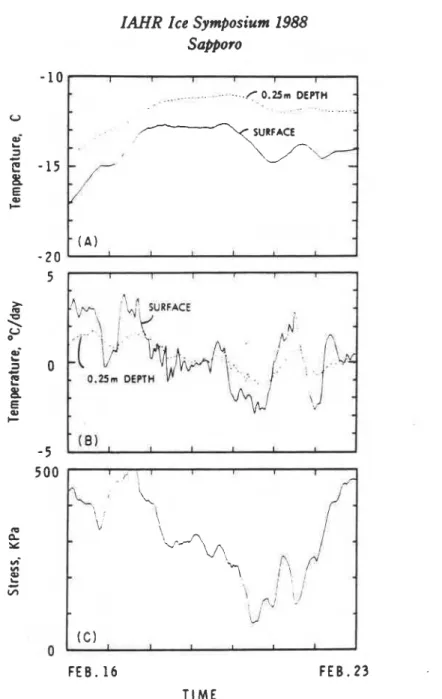
Sanderson (1984a) has provided suggestions f o r d e a l i n g w i t h thermal stresses i n f i r s t y e a r sea i c e covers. Stress, temperature, and time r a t e o f temperature change have a l l been p l o t t e d f o r t h e p e r i o d 16-23 February t o show t h e r e l a t i o n between s t r e s s and i c e temperature (Fig. 5). Time r a t e o f temperature change has been included, s i n c e i c e can behave as a v i s c o - e l a s t i c m a t e r i a l . I t i s t h e r e f o r e reasonable t o examine i c e stress v a r i a t i o n s i n terms o f i c e deformation r a t e also. Only t h e surface and 0.25 m temperatures have been included; Sanderson (1984a) states, and t h e s t r e s s measurements o f t h i s paper i n d i c a t e , t h a t t h e m a j o r i t y o f stress i s c a r r i e d i n t h e t o p 0.5 m o f t h e i c e cover. Taking a c o e f f i c i e n t o f thermal expansion o f 50 x 10 -60c-1 f o r sea i c e (Cox, 1983), s t r a i n changes and s t r a i n r a t e s I n t h e i c e cover can be calculated. The i c e surface
temperature increased by 4'C i n 2 days, which would correspond t o a s t r a i n increase o f
2
x 10'~. The maximum temperature r a t e s o f 4'C/day and P0C/day a t t h e i c e surface and 0.25 m depth correspond t o maximum s t r a i n rates o f 2.3 x 1 0 - ~ s - ' and 1.2 x 1 0 - ~ s - ~ . Taking an i c e temperature o f -12.C. a s a l i n i t y o f 5'/..,
and applying Sanderson's (1984b) a n a l y s i s f o r columnar- grained ice, secondary creep stresses o f 110 and 90 kPa are obtained f o r each rate. These p r e d i c t e d stresses are much lower than those measured here. The t o t a l s t r a i n change, 2 x and time (about one day) are much smaller i n t h i s case than would be a p p l i c a b l e f o r t h e secondary creep behavi our assumed i n Sanderson's (1984b) analysis. A much more thorough treatment o f thermal stresses i s required.The c r o s s - c o r r e l a t i o n between t h e s t r e s s from panel No. 3 versus t h e i c e surface temperature and r a t e o f change o f temperature i n t h e i c e cover a t a depth o f 0.25
rn
f o r t h e p e r i o d 16-23 February was determined (Fig. 6).IAHR Ice
Symposium 1988
Sapporo
- - - - - - - ..-.( O.25m DEPTH0
F E B . 16 F E B . 2 3 TIMEFigure 5 I c e temperature and time r a t e o f i c e temperature change a t surface and 0.25 m depth and panel No. 3 stress f o r t h e period 1986 February 16-23.
There i s a high c o r r e l a t i o n c o e f f i c i e n t (about 0.8) f o r stress, lagging t h e 0.25
m
temperature r a t e by about 20 h. There i s a l s o a p o s i t i v ec o r r e l a t i o n o f 0.6 between s t r e s s and i c e surface temperature, w i t h no phase lag. I n both cases t h e peaks are q u i t e broad, suggesting t h a t t h e r e may be several processes involved. It appears t h a t s t r e s s i s p r i m a r i l y a f u n c t i o n o f both surface temperature and i c e temperature r a t e a t a depth of 0.25 m.
IAHR
Ice Symposium 1988Sapporo
-
1-
80
-
4
0
0
4 0
8
0
P H A S E
L A G ,
h o u r sF i g u r e 6 R e s u l t s o f c r o s s - c o r r e l a t i o n o f i c e s t r e s s from panel No. 3 versus i c e surface temperature and 0.25 m i c e temperature and r a t e f o r t h e p e r i o d 1986 February 16-23.
CONCLUSION
The g l o b a l i c e loads a c t i n g on t h e wharf a t N a n i s i v i k are r e l a t i v e l y small, l e s s than 175 kN/m. Such low loads were expected, since t h e wharf i s l o c a t e d i n an area w i t h a s t a b l e l a n d f a s t i c e cover. There i s no evidence o f non-simultaneous i c e f a i l u r e i n t h i s instance, since a l l t h e l o a d panels gave s i m i l a r ( i n phase b u t various amplitudes) outputs. This i s n o t s u r p r i s i n g given t h e i ce behaviour o f re1 a t i v e l y u n i f o r m d u c t i l e deformation w i t h no cracks. The primary mechanism o f i c e load generation on t h e N a n i s i v i k wharf appears t o be temperature-induced s t r a i n s i n the i c e cover. A thermal a n a l y s i s based on secondary creep o f t h e i c e p r e d i c t s stresses s u b s t a n t i a l l y lower than those measured. An improved a n a l y t i c a l model i s required.
ACKNOWLEDGEMENTS
F i n a n c i a l support o f Pub1 i c Works Canada i s g r a t e f u l l y acknowledged, as i s t h e t e c h n i c a l assistance o f J.D. Neil, NRCC, and
J.
Egan, PWC.F i n a l l y , t h e cooperation o f t h e management and s t a f f of N a n i s i v i k Mines Ltd. g r e a t l y f a c i l i t a t e d t h e f i e l d work.
RENCES
IAHR Ice
Symposium 1988
Sapporo
Cox, G.F.N., 1983. Thermal expansion o f sea ice. Journal o f Glaciology, Vol. 29,
No.
103, pp. 425-432Frederking, R.M.W. and Nakawo, M., 1984. I c e Action on N a n i s i v i k Wharf, Winter 1979-1980. Can, Geotech. J., Vol. 11, pp. 996-1003
Frederking, R. and Sinha, N.K., 1978. I c e a c t i o n on wharf a t Strathcona Sound. Proc. 4th I n t e r n a t i onal Conference on Port and Ocean Engineering under A r c t i c Conditions, St. John's, Nfld., Vo1. 2, pp. 707-717
Frederking R. and Sayed, M., 1987. N a n i s i v i k i c e pressure measurements
-
Winter 1985-86, Report G9, Geotechnical Section, I n s t i t u t e f o r Research i n Construction, National Research Council o f Canada. December, 1987Girgrah, M. and Shah, V.K., 1978. Constructton o f a deep-sea dock i n t h e A r c t i c . Proc. 4th I n t e r n a t i o n a l Conference on Port and Ocean Engineering under A r c t i c Conditions, S t . John's, Nfld., Vol. 1, pp. 370-381
Hawkins, J.R., James, D.A., and Der, C.Y., 1983. Design, c o n s t r u c t i o n and i n s t a l l a t i o n o f a system t o measure environmental forces on a caisson r e t a i n e d i s 1 and. VTT Symposium 38, 7th I n t e r n a t i o n a l Conference on Port and Ocean Engineering under A r c t i c Conditions, H e l s i n k i , Finland, Vo1.4, pp. 770-779
P i l k i n g t o n , G.R., Blanchet, D, and Metge, M., 1983. F u l l s c a l e
miasurements o f i c e f o r c e s on an a r t i f i c i a l island. VTT Symposium 38, 7 t h I n t e r n a t i o n a l Conference on Port and Ocean Engineering under A r c t i c
Conditions, H e l s i n k i , Finland, Vol. 4, pp. 818-934
Sanderson, T.J.O., 1984a. Thermal i c e forces against i s o l a t e d structures. Proc IAHR Symposium on Ice, Hamburg, Germany, 27-31 August, 1984, Vol. 4,
pp. 289-299
Sanderson, T.J.O., 1984b. Theoretical and measured i c e f o r c e s on wide structures. Proc IAHR Symposium on Ice, Hamburg, Germany. 27-31 August, 1984, Vol. 4, pp. 151-207