Publisher’s version / Version de l'éditeur:
Journal of the Acoustical Society of America, 90, 3, pp. 1454-1463, 1991-09
READ THESE TERMS AND CONDITIONS CAREFULLY BEFORE USING THIS WEBSITE. https://nrc-publications.canada.ca/eng/copyright
Vous avez des questions? Nous pouvons vous aider. Pour communiquer directement avec un auteur, consultez la première page de la revue dans laquelle son article a été publié afin de trouver ses coordonnées. Si vous n’arrivez pas à les repérer, communiquez avec nous à [email protected].
Questions? Contact the NRC Publications Archive team at
[email protected]. If you wish to email the authors directly, please see the first page of the publication for their contact information.
NRC Publications Archive
Archives des publications du CNRC
This publication could be one of several versions: author’s original, accepted manuscript or the publisher’s version. / La version de cette publication peut être l’une des suivantes : la version prépublication de l’auteur, la version acceptée du manuscrit ou la version de l’éditeur.
Access and use of this website and the material on it are subject to the Terms and Conditions set forth at
Sound transmission through concrete blocks with attached drywall
Warnock, A. C. C.
https://publications-cnrc.canada.ca/fra/droits
L’accès à ce site Web et l’utilisation de son contenu sont assujettis aux conditions présentées dans le site LISEZ CES CONDITIONS ATTENTIVEMENT AVANT D’UTILISER CE SITE WEB.
NRC Publications Record / Notice d'Archives des publications de CNRC:
https://nrc-publications.canada.ca/eng/view/object/?id=dc2a5d85-d5f5-455d-be90-a7ce8bb4a96b
https://publications-cnrc.canada.ca/fra/voir/objet/?id=dc2a5d85-d5f5-455d-be90-a7ce8bb4a96b
Sound transmission through
concrete blocks with attached
drywall
Warnock, A.C.C.
NRCC-35546
A version of this document is published in Journal of the Acoustical Society of America, 90(3), pp. 1454-1463,
September-91
The material in this document is covered by the provisions of the Copyright Act, by Canadian laws, policies, regulations and international agreements. Such provisions serve to identify the information source and, in specific instances, to prohibit reproduction of materials without
written permission. For more information visit http://laws.justice.gc.ca/en/showtdm/cs/C-42
Les renseignements dans ce document sont protégés par la Loi sur le droit d’auteur, par les lois, les politiques et les règlements du Canada et des accords internationaux. Ces dispositions permettent d’identifier la source de l’information et, dans certains cas, d’interdire la
Sound transmission through concrete blocks with attached drywall
A.C.C. Warnock
Acoustics Section, Institute/or Research in Construction, National Research Council Canada, Ottawa,
OntarioKJA OR6, Canada
(Received 18 December 1990; accepted for publication 8 Aprill991)
The furring system for attaching drywall to concrete block walls must be chosen with care if sound transmission is not to be increased at low frequencies. Once drywall is attached to a
ョッイュ。ャセ@ weight block wall, sound transmission loss is increased above a frequency fx giVen.by
fx = K /(Md) 112
• (M is the surface mass of the drywall, kg/m2, and dis the depth of the cavity behind it, m. K is 108 for an empty cavity and 60 for a cavity filled with fibrous
sound-absorbing material.) Sound transmission loss data measured for a number of QYPセュュ@ normal-weight concrete block wall systems are presented to support the above result. Walls were measured with di"ywall systems mounted on different furring types on one side and on both sides. The cavities behind the drywall were either empty or filled with glass fiber. A simple, limited prediction scheme that can be used to recreate the data is described. The measurements in this' Paper present a consistent picture of the influence of the depth of the air space between the drywall and the block, and the presence of sound-absorbing material in the cavity. PACS numbers: 43.55.Rg, 43.55.Ti
INTRODUCTION
This paper presents results from a series of measure-ments of sound transmission through concrete block walls with drywall attached on five types of furring systems. Al-though block walls have been in use for many years, there was and still is a need for new measurements. There are sev-eral reasons for this.
There are differences among the transmission loss (TL) data presented in the literature for block walls. H
Improve-ments in measurement techniques that render old data obso-lete, and differences in materials, construction and
laborato-ry facilities, explain some of these differences. Whatever the reason, these differences make it difficult to see trends and draw conclusions from published data.
Many building codes in North America require relative-ly low values of sound transmission class (STC) for party walls (usually 45 or 50), but recently there has been an in-creased demand for greater sound insulation between homes. A preliminary survey in Canada suggested that occu-pants of apartments would prefer to have walls with STC 55
or greater separating them from their neighbors. 6
Prelimi-nary, unpublished results from a larger survey confirm this value. In response to the demand for increased acoustical privacy, STC requirements for party walls and floors in Cali-fornia7 and Canada8 have been increased to 50.
There is a lack of published data on block walls with high sound transmission class (STC) ratings. Many of the results in the literature are for bare blocks or blocks that have simple finishes such' as paint or plaster and do not usually have very high STC ratings. Block walls are com-monly finished by attaching layers of drywall to them, either directly to the block surface or supported on furring strips. Using furring strips can increase transmission loss and sound transmission class. The literature provides no consis-tent set of transmission loss data for comparing different finishing methods, especially at low frequencies. The meaw surements in this paper present a consistent picture of the
influence of the depth of the air space between the drywall and the block, and the presence of sound-absorbing material in the cavity.
Measurements reported in the literature typically only extend down to 125Hz [100Hz if the tests were done ac-cording to ISO 140 (Ref. 9) ]. Low-frequency sound, how-ever, is commonly audible and a cause for complaint in apartment buildings. Also, to reduce soUnd from very noisy machine rooms, walls with high sound transmission loss at low frequencies are often necessary. To meet this need for low-frequency data, results presented here extend down to the 63-Hz one-third octave band.
I. EXPECTED EFFECTS CAUSED BY ADDING DRYWALL A. Mass-air-mass resonance
The transmission loss curve for a cavity wall shows a dip at a frequency called the mass-air-mass resonance frequen-cy,fmam. At and around this resonance, sound transmission losses fall below those predicted by mass law for the total mass in both layers. For an air-filled cavity, this frequency may be calculated from the expression:10
fm•m = (1!211')(p0 C
2/M,.d)112
, (1)
wherep0 =density of air, kg/m3;
c
=speed of sound in air,m/s; d = the distance between the two layers, m; and Meff is the effective mass of the wall, kg, and is given by:
(2) •
where m1 and m2, kg, are the masses of the two layers form-ing the cavity.
Substituting typical values of physical constants gives
fm•m = 60/(M,.d) 112• (3)
The mass-air-mass resonance frequency, in typical con-struction, occurs at mid or low frequencies. With block walls, it is often the reason for a reduction in transmission loss and STC when drywall is supported too close to the
block on furring strips. The effect is not always obvious if the
, range of measurement frequencies is not low enough.
In data presented by Quirt, 11 the position of the
mass-ail-mass resonance is predicted correctly by Eq. ( 3). In Ref. 12,
hOwever,
readers are advised to use a constant of 90 ゥョセ@ stead of 60 to predict resonances that agree better with mea· surement. . .According to Ref. 13, adding drywall supported on ヲセイᆳ ring to a wall increases sound transmission loss relative to
the bare wall above the mass-air-mass resonance frequency. There is, however, no mention of a decrease in transmission
Joss below this frequency.
B. Effect of sound-absorbing material on
mass-air-mass resonance
Adding sound-absorbing material to the cavity in a dou· ble wall lowers the mass-air-mass resonance frequency; how far is not clear. In Ref. 13, the caption to Fig. 11.24 states thatfmom should be multiplied by 0.85 when sound-absorbing material is present in the cavity. This assumes a reduction in sound speed because the behavior of the air in the cavity changes from adiabatic to isothermal. This would change the constant in Eq. ( 3) from 60 to 51. Elsewhere in the same textbook, Schultz14 says that the resonance
fre-quency will be lowered by a factor 11../2 because of isother· mal conditions in the sound-absorbing material. This factor changes the constant in Eq. (3) from 60 to 43.
The work of Fothergill and Alp hey" shows many of the same effects to be discussed here, but the authors conclude that Eq. ( 3) can be used to predict the mass-air-mass reso-nance frequency to within a one-third octave band even when there is mineral fiber in the cavity.
Fahy10 discusses the influence of sound-absorbing
mate-rial in a cavity wall and shows that transmission loss will depend on the flow resistance of the sound-absorbing materi-al. He does not give a simple formula for predicting the shift in mass-air:...mass resonance. Sharp's model16 for a cavity
wall assumes there is sound-absorbing material in the cavity and does not predict any reduction of sound transmission loss around the mass-air-mass resonance. The expression he gives for the mass-air-mass resonance gives a result about 1.33 times higher than that given by Eq. ( 3). He denotes this frequency as/0 and uses it to calculate where the
transmis-sion loss curve for the double wall begins to increase above that for the single layer wall of equivalent weight. Thus Sharp's
fo
functions in the same way. as the crossover fre-quency,/_.., defined later.The damping due to sound-absorbing material reduces the effect of cavity resonances on tranSmission loss at mid and high frequencies. F)brous materials in the thicknesses normally used in wall cavities are not very absorptive at low frequencies and may have little influence on the depth of the mass-air-mass resonance. There is, hoWever, no informa-tion available in the literature on this point.
The frequency of the mass-air-mass resonance and the depth of the resonance are important pieces of information for designing block and other types of cavity walls. It is un-fortunate that the literature does not give clear information on this topic.
1455 J. Acoust. Soc. Am., VoL 90, No.3, September 1991
11. DESCRlPTlON OF MEASUREMENT FACIL!TlES AND PROCEDURES
Measurements were made in the sound transmission lo-ss suite at the National Research Council Canada in accor-dancewith ASTM E90 (Ref. 17). For wall transmission loss measurements, the source room has a volume of 65 m3 and
the receiVing room has a volume of250 m3• Wall specimens
measure' 2.44 X 3.05_ m and are constructed on a steel, wheeled frame that
fits
between the rooms. The frame is lined with wood and is not rigidly attached to either room. Each room baS fixed and rotating diffusers and four corner-mounted loudspeaker systems fed with independent pseu-dorandom noise sources. To measure transmission loss, white noise isfed
to the loudspeakers- in the source room. Pink noise is used to measure decays in the receiving room. Nine electret condenser microphones sample the sound fields in the central volume of each room. Measurements are controlled by a computer system interfaced to a GenRad 1921 real time analyzer and cover the one-third octave band frequencies from 63-6300 Hz.A. Low-frequency measurements
The influence of small room volumes on transmission loss measurements is not well understood. According to ASTM E90, for valid transmission loss measurements, room volumes should exceed 80 m3• This number is based on a
somewhat arbitrary requirement that エィセイッッュウ@ should have about 20 modes in the lowest band used for measurement. The lowest frequency used in the calculation of STC is 125 Hz, which leads to the 80-m3 figure. Rooms smaller than this are permissible according to ISO 14D (Ref. 9) where the lowest frequency band required is 100Hz.
Earlier work at NRC (Ref. 18) compared conventional techniques for transmission loss measurement with a tech-nique based on sound intensity. For sound intensity trans-mission loss measurements, the 250-m3 room was the source
room. In the 63-Hz one-third octave band, there are about 8 modes in the 250-m3 room and 3 in the 65-m3
room. Conven-tional measurements gave greater transmission loss values at low frequencies than did intensity-based measurements. Dif-ferences found were about 4 dB at 63 and 80Hz and about 2 dB or less up to 500Hz. The intensity-based technique might be considered more reliable because only the large room in-fluences the measurements; however, the conventional tech-nique is fully automated in the NRC laboratory. The con-venience and the consistent differences between the two techniques justifies the use of the conventional technique for the purposes of the work anct at the frequencies used here.
Weight Wall Flow
Thickness per block weight resistance
(mm) (kg) (kg/m') (mksohms)
190 17.5 236.2 1.8X 10⁶
140 (75% solid) 17.8 240.1 1.6X 10⁶
140 ( 100% solid) 22.3 300.7 2.2X 10⁶
I
'
.i
'·
'
TABLE II. Sound absorbing material used in cavities.
Thickness Surface weight
Type (mm) (kg!m')
AF300 19 0.4
AF300 38 0.7
RS 65 0.83
Rl2 90 1\16
Bias errors should be constant for the laboratory. Micro-phones, speakers, and other equipment are in fixed positions and measurements repeat within 0.5 dB. Thus trends in and differences between the low-frequency transmission loss measurements for the different specimens should be valid.
Ill. MATERIALS
The face dimensions of the blocks were 190 mm high by 390 mm long, the standard size. Table I gives some other physical parameters including flow resistance. Blocks were laid in a running bond pattern. On every second course, wire tiusses were embedded in the mortar to give horizontal rein-forcement. The
13-
and 16-mm drywall used weighed 9.2 and 10.7 kg/m2, respectively. The glass fiber materials usedwere manufactured by Fiberglas Canada Ltd. The designa-tions and properties are given in Table II. The flow resistivity of the materials was not measured.
(a) . f - - - 4 0 - 1---20--! 65 (d)
I
]
1 - - -40 _____., (b)I
40 1--30----!1
f---25--; (e) 75J
f---35 ----1FIG. 1. Cross sections of the furring and studs used to support drywall. (a)
13-mm resilient metal channels, {b) 40-mm wood strapping, (c) 65-mm steel studs, (d) 50-mm Z bars, and (e) 75-mm Z bars.
1456 J. Acoust. Soc. Am., Vol. 90, No.3, September 1991
A. Methods of attaching drywall
Four types of furring were used to attach drywall to the blocks. These were 13-mm resilient metal channels, 40-mm wood furring, and 50- and 75-mm resilient metal Z bars. All metal furring systems were formed from 0.5-mm-thick
gal-カ。ョゥコセ、@ sheet metal. Furring strips were installed 600 mm
apart. Z bars are nQt commonly used for acoustical purposes but they offer an alternative
to·
iriOi:e cOmmon techniques, such as steel studs. They are no more difficult to install thaniSセュュ@ resilient channels· yet, as
will
be seen, offer better system transmission loss because of the greater caVity depth. 65-mm steel studs with top and bottom tracks were also used。ッイMMMMMMMMMMMMMMMMMMMMMMMMMセ@
co
'0 70iii
60 0 ..Jz
Q 50 (/) (/) セ@セ@
40g
30 Ia! RC13 STC51 ZC50 STC55 セ@..,
セG@"
'"
,' ZC75 STC59"
"
,• I ,' I ,' I ( I ! I /.···
I..•
, ..tr/·"/
E ,'·
...
···
...
.(.:'/ ' ' ' \ I / .... セH@ / ' ' ,,...
.. ··
....
··
63 125 250 500 1k 2k FREQUENCY, Hz 9 0 r - - - , 80co
"- 708
..J 60z
0iii
セUP@ ::;; (/)セ@
40 1-30 20 lbl WF40 STC 52 SS65 STC 58 ' ! ' ' ' ',
...
:
/....
MMMMMMMMMセ@....
.. ··
..
····.
' / ' ' ' Bare, STC 50 63 125 250 500 1k 2k 4k FREQUENCY, Hz.. ··
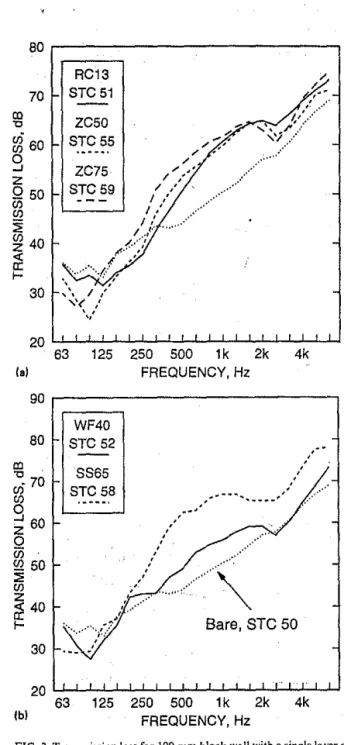
FIG. 2. Transmission loss for 190-mm block wall with a single layer of 16..
mm drywall on one side only. There is no sound-absorbing material in the
cavities. (a) RC13-13-mm resilient channels; ZC50 and ZC75-50- and
75-mm Z bars; and (b) WF40--40-mm wood furring; SS6S-65-mm steel studs.
to support drywall. The studs were not in contact with the blocks and were installed 600 mm apart. Figure I shows cross sections and dimension of the furring and the studs. For each method of drywall attachment, the wall was tested
c c with the cavity empty or filled with sound-absorbing
materi-c , a!. Drywall was also screwed directly to the blocks.
IV. RESULTS FOR 190-MM BLOCK WALLS
Complete details and transmission loss values for all the
c wall systems measured can be found in Ref.
19.
Selectedresults are presented here to illustrate the effects found. A. Effect of Increasing air space
Figure 2 shows the effect of increasing the depth of the airspace when a single layer of drywall is attached to the
XPイMMMMMMMセMMMMMMMMMMMMMMML@ m '0 70
g
609
z
Q 50en
en
:i1
セ@
40セ@
f-30 empty STC51 19 mm gf STC54 ' ' ' '.·
' ' ' 'MMセセMBO@
,....
--"
..
·
/ / NOセ@...
...
ᄋセᄋᄋ@.. ···'·· ...
-;-'.... .
13 mm resilient channels on one side onlyRPllセセMlllセェ⦅llセェ⦅llセMw@ 63 125 250 500 1k 2k 4k Ia) FREQUENCY, Hz
80 . - - - ,
70 m 'Cg
609
z
Q 50 (f) (f):i1
jg
40<
0: f-30.
. empty STC53 38 mm gf STC55...
,..--
....
/... ··
'.
'.
,
... ·
/ :'.
,' ,•' ... /.. 40 mm wood furringセM : on one side only
63 125 250 500 1 k 2k lbl FREQUENCY, Hz ' ' '
...
4kblock on one side only. It is clear that the mass-air-mass
resonance can seriously reduce the transmission loss of the wall at the important low frequencies, even if this-does not always result in a lower STC. Increasing cavity depth clearly moves the mass-air-mass resonance to lower frequencies, as Predicted. Note the peak in the.transmission loss curve at 200Hz for the 40-mm wood furring case. Screwed tothe stiff wood furring, the drywall behaves differently than it does when connectCd to the resilient metal supports. There are no
ウセュゥャ。イ@ peaks in the transmission loSs curves for the resilient
steel furring.
The coincidence dip due to the drywall is evident in the figures. In the case of the wood furring, the solid connections to the drywall reduce the transmission loss at the coinci-dence dip to about the same as that for the bare block wall.
80
イMMMMMMMMMMMMMMMMMMMMMMMMMセ@ 70!15
g
609
z
Q 50gJ
:i1
セ@
40g
30 empty STC52 50 mm gf STC59 '.
.
.
NGOセNセN@
,: ....
···
···
...ᄋᄋセZᄋZNGN@
.. .... '..
.
...
.·
....
--.·
.··
... ··
,.. ·
..
..···
.... 50 mm Z bars on one side only RqllセセMlllセェ⦅llセセMlセセ@ 63 125 250 500 1k 2k 4k lei FREQUENCY, Hz80.---,
m '0 70ui
60 ({).9
z
Q 50 (f) (f):i1
セ@
40g
30 empty STC57 75 mm gf STC61...
,•'.. ···
• ' " • ,.
I '"
.
........
.. ··
/
...
·.:.
75 mm Z bars on one side only. RqwMセセMlセセMlセセセセセセ@ 63 125 250 500 1k 2k 4k I d) FREQUENCY, HzFIG. 3. Transmission loss for 190-mm block walls with a single layer of 16-mm drywall on one side only. Results are for the cavity empty and filled with glass fiber (gf). In each case the bare block result is the dotted line (STC 50). (a) 13-mm resilient metal channels', (b) 40-mm wood strapping, (c) 50-mm Zbars, and (d) 75-mm Z bars.
1457 J. Aooust. Soc. Am., Vol. 90, No.3, September 1991 A. C. C. Warnock: Transmission through concrete block walls 1457
'c
v
,,
li
,,
:-."
l'i f):ャゥセ@
!
·1: .'I!',
i, ' i'i 'I'if;;
:;it
'
1! ji i!'
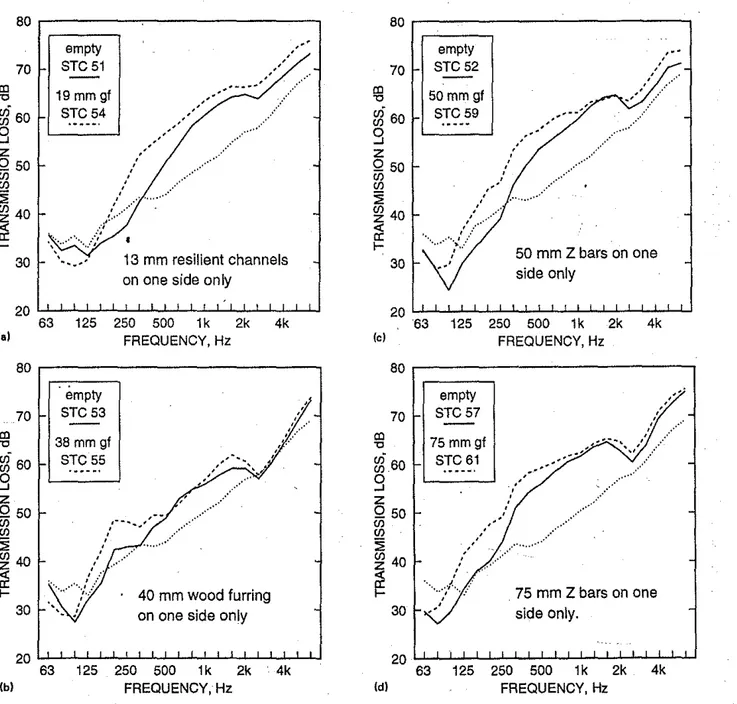
B. Effect of adding sound-absorbing material
Figure 3 shows a selection of results for drywall finishes with and without ウッオョ、セ。「ウッイ「ゥョァ@ material in the cavity. The presence of the sound-absorbing material moves the mass-air-m.ass resonance to a lower frequency, as expected, The magnitude of the change in frequency of the mass-air-mass resonance is discussed later. The addition of ウッオョ、セ@ absorbing material in the cavity usually results in higher STC ratings and improved transmission loss at frequencies above the mass-air-inasS resonance.
C. One-side versus two-side treatment
Figure 4 shows a selection of results for the block wall with 16-mm drywall applied on one side and on two sides of
XPLMMMMMMMMMMMMMMMMMMMセMMML@ 70
lg
セ@
60g
z
Q 50"'
"'
セ@lit
40セ@
30 (a) 63 one side STC51 both sides STC49 ''
:
I ,,•' ,'..
··
"....
13 mm resilient channels 125 250 500 1k 2k FREQUENCY, Hz 9 0 , - - - , 80co
70 "C .ui"'
60 0 ...Jz
0 50 Cii"'
セ@
40z
<
cr
30 f-20 (b) one side STC 53 --both sides STC 54 · 40 mm wood furring 63 125 250 500 . 1k 2k 4k FREQUENCY, Hz:
the block using the same furring method. The addition of the drywall to the second side further decreases the iッキMヲイ・アオ・ョセ@
cy transmission losses and further increases the high-fre-quency transmission losses. Thus, in some instances
it
might be better to leave one side of the blocks unfinished, except for paint or plaster, to ensure good low-frequency transmission loss.D. Attaching drywall directly
It might be thought that drywall screwed or glued di-rectly to the surface of the blocks would effectively become one with the block. This is not normally so. There is usually an air gap behind the drywall, although it is small. With the normal number of screws or patches of glue used to attach
80r---,
70co
": 60"'
gs
...J 50z
0 Ciisa
4o :::;"'
セ@
30 20 one side STC 52 both sides STC52:
' ' ' ' ' ' ',.
..
··
,'... .
....
;" ' ' ' ' '.
..
,
' ' ' ' ,' , '.···
..
·'..
.... ···
•
50 mm Z-bars QPキ⦅セセMlセセj⦅セセセセセMw@ 63 125 250 500 1k 2k 4k lei FREQUENCY, Hz YPイMMMMMMMMMMMMMMMMMMMMMMMMMセ@ 80co
": 70"'
."'
0 ...J 60z
0 Ciisa
5o:::;
"'
z
セ@ 40 f-30 (d) one side STC 58 both sides STC57 セセセセ@,
.... --
セ@...
' ' ':
':
... ··
..
··
...
' ' ',...,
' ''
I ,.··:
..
.. ···
..
··
...
·• .... •"•. ,'r· ' ' ' ' 65 mm steel studs...
63 125 250 500 1k 2k FREQUENCY, Hz 4k...
FIG. 4. Transmission loss for 190-mm block walls with a single layer of 16-mm drywall on one side and on both sides using different furring methods. In each case the bare block result is the dotted line (STC 50). (a) 13-mm resilient metal channels, (b) 40-mm wood strapping, (c) 50-mm Z bars, and (d) 65-mm steel studs.
80 1 side 70 STC50 2 sides
gi
60 STC499
' '. .
:z
'Q
50 ,' '..
·
(/) ' '.. ····
(/) ' セ@..
....
..
·
(/) 40..
'セ@
...
··
' 'a:
...
' t-30 63 125 250 500 1k 2k 4k FREQUENCY, HzFIG. 5. Transmission loss for l90.mm block walls with a single layer of 16· mm drywall screwed directly to one side only and to both sides. The bare
block result is the dotted line (STC 50).
the drywall, it can vibrate fairly independently of the block. As shown in Fig. 5, a mass-air-mass resonance still occurs
MNセG@ and transmission loss and sound transmission class can be
reduced. As in the case of the solid wood strapping transmis-sion loss around and above the coincidence frequency is mar-kedly reduced: in this case to below that for the bare wall.
V. DISCUSSION OF 190-mm BLOCK RESULTS
A. Crossover frequency
In the data presented here, it is not always easy to say precisely at what frequency the mass-air-mass resonance, Imam, occurs. Sometimes the resonance is not well enough defined; sometimes it is below the lowest frequency mea-sured. Data from other measurement series usually do not extend to low enough frequencies to allow estimation of this frequency either. To get around this difficulty, the idea of a crossover frequency, fx, was used. This is defined as the fre-quency where the transmission loss curve for the block wall with drywall attached crosses the transmission loss curVe for the bare wall. For cavities without added absorptive materi· al, fx, was found to be about 1. 8 times higher than
Imam
calculated using Eq. (3). The crossover frequency for ab-sorption-filled cavities was found from a regression analysis of data in this study and in Refs. 2-5. The factor ofl/,]2
given by Schultz" 。ーセャゥ・、@ to Eq. ( 3) to account for the effect of sound absorbing material gave a reasonable fit to the data but a factor of 1/1.8 was best. Thus the following equation was used to predict the crossover frequency:fx = K /(M,.d) 11
'. ( 4)
where K is 108 for an empty cavity and 60 for a cavity filled
with sound-absorbing materiaL Meff is given by Eq. (2) but, for block walls, it can be taken as the mass of the drywall because the blocks are so much heavier than the drywall.
1459 J. Acoust Soc. Am., Vol. 90, No.3, September 1991
セ@
0
500 400 w 300s
::>g
C3
200 100 Empty cavities 0 With absorber•
0 0 0 セ@ 0 -. 0 01-io
ᄋセ@
• 0 0i
8
1-
r ••
-••
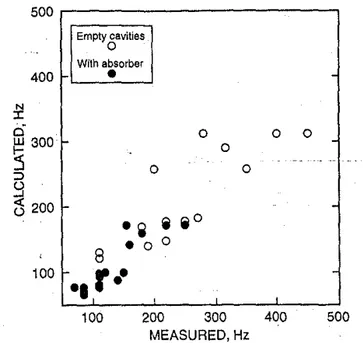
100 200 300 400 500 MEASURED, HzFIG. 6. Measured versus predicted crossover frequency for empty wall
cav-ities (0) and those containing sound-absorbing material (e).
Figure 6 plots measured values of crossover frequency against values calculated using Eq. ( 4). ·
Equation ( 4) should apply to blocks with material hav-ing similar flow resistivities to セィッウ・@ オセ・、@ here, that is nor-mal-weight blocks. It is likely that with more porous blocks the effective depth of *e cavity. will .be inCreased, but this was not' investigated in this work. This equation can be used to select cavity depths to ・ョウセイ・@ that the transmission loss is not reduced at important frequencies, for example at 125Hz to ensure that STC is not reduced.
The presence of sound-absorbing material in the cavity might have been expected to effectively reduce the depth of the mass-air-mass resonance. As Fig. 3 shows, this is not the case for the materials used here.
The data reported in Ref. 15 does not show any
infiu-TABLE III. Measured STC ratings for 190-mm block wall systems. Letter Codes in column 1 identify methods of attaching 16-mm gypsum wallboard in column 2. In column 2, the following codes are used: WF-wood furring, GFB-glass fiber batts, RC-resilient metal channels, ZC-Z bars, SS-steel studs. The number following these codes is the thickness of the materi-al or the airspace, in mm. Side2 Side 1 Bare A B
c
D E F G H Bareso
A Directso
49 B WF40 53 54 C WF40 _ GFB40 55 57 58 59 D RC\3 51 58 49 E RCI3 GFBI9 54 52 49 F ZC50 52 52 . 52 G ZCSO_GFBSO 59 59 59 64 H SS65 58 57 .J SS65 GFB65 60 61 65 72 J ZC7S 57 57 59 68 K ZC75 GFB75 61 62 66 7320 ' セセセ@ セ@ セN@ ᄋセ@
...
' 15 ' / ' ' ' ' / セ@'
...
' ':
,•,'
'
I ' ' ''
' \ ' i I ' ', ' \ ' ' ' 10 / I ' ' \ \'-..
,·...
'
' I ' '.
'
...
·,.
...
/-/ / \,....
_-
., '
\co
'
('
...
,-
..
' \ , ''
,...
..
.
''-,
\ "0 5 / I.·'····>··
J J I,' '\ f- ,'I,' ·.,
<l:I
J / / 0 i!• 40 mm wood furring -5 65 mm steel studswith glass fibre
-1 0 U....l.-l-'-J...J...L..L...W-Ll...J...L..L...L.;W...L..L.J...J
63 125 250 500 1k 2k 4k FREQUENCY, Hz
FIG. 7. Average difference in transmission loss between the bare wall and
the wall with different surface treatments on one side only. The dotted
curves are the mean
±
1 standard deviation for each treatment. The type ofdrywall support is indicated in the figure.
ence due to the presence of glass fiber. There were, however, only three ci:tses where there should have been an effect, and the type of glass fiber used was probably quite different from that used here since it was laminated to the drywall.
VI. SIMPLE METHOD FOR PREDICTION OF 190-mm BLOCK RESULTS
A. Explanation of the method
Sharp's model16 calculates sound transmission Joss for
double or triple walls by simply adding terms to the
trans-20 15 10
co
"0セ@
5 <l 0 13 mm resilient channels -5 75 mm Z·bars -1 0 W....J...J...J....J....L.;L-L.L.LJ..J-Ll...J...J....J....WL-L.U 63 125 250 500 1k 2k 4k FREQUENCY, HzFIG. 8. Average difference in transmission loss between the bare wall and
the wall with different surface treatments on one side only. The dotted
curves are the mean ± 1 standard deviation for each treatment. The type of
drywall support is indlcated in the figure.
mission loss for the bare wall. This additive approach to pre-diction was investigated with this dati s·et. The assumption ·was made that each time a layer of gypsum wallboard on some support is added to a bare block wall surface, it has the same relative effect no matter what is on the other side of the wall. That is, if some method of drywall attachment gives a change in transmission loss of X dB is some frequency band when used on one side of the wall, it will give a change of2X dB when used on both sides. Thus for each drywall mounting technique there exists a difference transmission loss ( ATL)
TABLE IV. Mean change in transmission loss, ATL, relative to the bare block for different methods of adding l6·mm gypsum wallboard. Letter codes to identify furring methods are the same as those used in Table III.
Frequency B
c
D E F G H K 63 -1.3 -3.4 -0.2 -2.3 -3.7 ·5.1 -4.7 -4.0 -5.7 -5.2 80 -4.4 -5.3 -0.3 -3.6 -5.1 -5.5 -3.8 -0.8 -6.2 -2.1 100 -7.4 -5.5 -2.3 -5.8 . -6.8 -2.3 -3.0 2.5 1.6 4.2 125 - 1.7 2.3 - 1.6 -3.5 -3.3 4.2 1.0 7.1 1.9 8.1 160 -1.1 5.7 -3.6 -1.1 -1.9 5.5 2.5 8.3 3.8 10.6 200 3.1 9.7 -4.0 2.5 - 1.0 7.7 6.4 11.8 4.4 12.3 250 3.1 8.5 -3.6 5.8 1.6 8.L. 8.8 13.7 7.8 12.9 315 1.2 5.7 -0.2 7.6 4.1 10.2 !0.0 14.3 10.5 12.5 400 4.7 7.8 4.5 9.0 7.6 12.5 14.6 15.4 12.9 16.0 500 5.0 6.3 6.6 8.9 9.3 12.2 16.6 14.8 14.2 16.1 630 6.4 5.9 6.2 7.8 9.2 I 1.9 15.5 13.9 14.4 15.1 800 6.5 5.9 6.8 8.0 9.6 11.7 15.1 !3.1 13.3 13.4 1000 5.6 5.7 5.8 7.8 !0.0 10.3 !3.3 I 1.0 I 1.5 11.2 1250 5.4 6.4 6.2 7.7 9.9 9.5 10.7 9.0 10.9 10.3 1600 4.5 6.0 5.7 6.5 8.6 6.5 8.6 8.2 10.0 10.0 2000 3.3 3.5 4.6 5.1 6.6 5.1 7.7 7.8 6.3 8.4 2500 0.0 0.1 3.9 5.2 4.3 4.5 7.0 7.7 3.7 5.3 3150 0.4 !.I 3.4 4.7 3.4 4.2 7.3 9.0 4.4 6.2 4000 1.1 2.2 3.4 4.7 3.8 4.6 7.6 8.4 6.6 7.4 5000 2.5 3.5 3.9 4.7 4.2 4.5 7.1 7.2 6.3 6.1 6300 4.3 4.7 3.4 3.6 2.7 2.5 4.2 4.7 5.5 4.2spectrum that can be added to the transmission loss spec-trum for an existing wall to predict the effect of adding an-,· other layer of drywall to a bare block surface using the
par-!1· ticl}lar construction technique. To understand this idea more clearly, observe in Fig. 4 that the addition of the second layer further improves transmission loss at higher frequen-cies and further reduces it at lower frequenfrequen-cies.
Table
III
shows the measured STC values for all the 190-mm block wall systems that were tested. This table shows the data that were available for calculation of the!::. TL spectra. Walls on the diagonal had both sides finished in the same way. Other walls had mixed finishes that can be identi-fied from the row and column headings in the table.Table
III
shows that there were usually several ways to calculate the difference transmission loss (!::.TL) spectrum90.---.
80
セ@ 70ui
g
60z
Q50
(f) (f)セ@
40 (f)z
セ@
30 1-'20
Ia)40 mm wood furring, glass fibre and drywall on both sides STC59 63 125 250 500 1k 2k FREQUENCY, Hz
•
4k YPNMMMMMMMMMMMMMMMMMセMMMMML@80
セ@ 70ui
gJ
60 ...Jz
Q
50 (f)fa
::;: 40 (f)z
<! セ@ 30 20 (b) 6340 mm wood furring and drywall on both sides STC52
125 250 500 1k 2k FREQUENCY, Hz
4k
for a given mounting technique. These included the obvious: the one-side result minus the bare result, and the two-sided result minus the bare result divided by two. Results not on the diagonal or in the first column were also used. For exam-ple, subtracting the spectrum corresponding to the result in the Bare column, row D from the result corresponding to column C, row D gave an estimate of b. TL corresponding to 40-mm wood furring with 40 mm of glass fiber in the cavity. Several ATL spictra were calculated in this·way for each surface treatment and averaged to get a mean and a standard deviation.
Figures 7 and 8 give examples of!::. TL curves for some of the wallboard mounting methods tested. The mean
±
1standard deviation curves are also shown in the graphs. Some mounting methods gave more variable results than
90,---.
80
"'
"- 70セ@
...J 60z
0Vi
qJ50
::;:
(f)セ@
40 3013 mm resilient channels and drywall on both sides. Glass fibre on one side only. STC 52
••
••
•••
•
RPllllセセllセセllセセセセNNNjNNNj@ 63 125 250 500 1k 2k 4k (c) FREQUENCY, Hz8 0 . - - - ,
70"'
"- 60 (f) (f) 0 ...J50
z
0Vi
fa
40::;:
(f)z
セ@ 301-20
•••
•••
50 mm Z bars, glass fibre and drywall on both sides STC59
QPllセセllセMォセMlllセMォセTセォMlw@
63 125 250 500 1k 2k (d) FREQUENCY, Hz
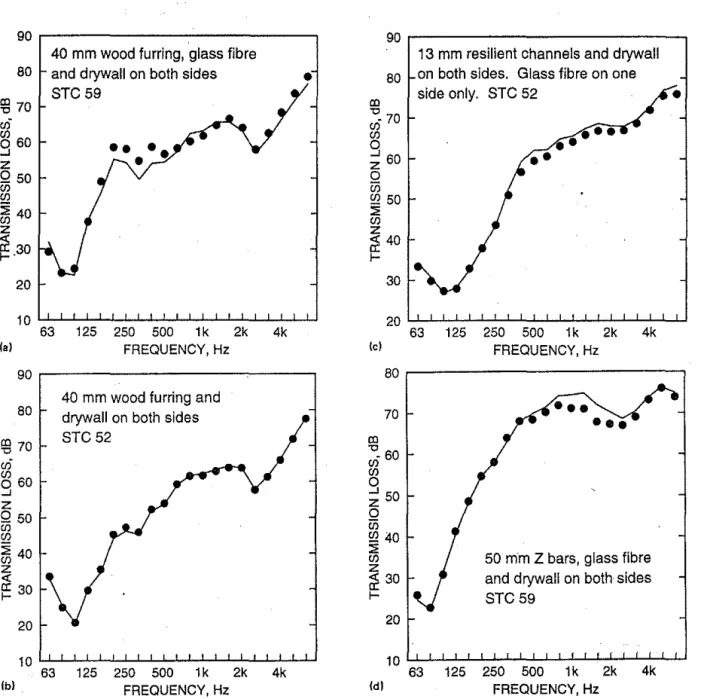
FIG. 9. Comparisons of measured (solid line) and predicted (e) transmission loss for 190-mm concrete block walls. (a) 40-mm wood furring, glass fiber and
drywall on both sides. (b) 40-mm wood furring and drywall on both sides. (c) 13-mm resilient metal channels and drywall on both sides, glass fiber on one side only. (d) 50-mm Z bars, glass fiber, and drywall on both sides.
others. That for the 13-rnrn resilient channels was most vari-able; the wood furring result was least variable. Table IV lists the A TL values calculated from the measured data for all drywall mounting methods.
B. Comparison of measurement with prediction The ATL spectra can be added to the bare block result to predict measured results. It is hardly surprising that the pre· dicted STC ratings agree well with those measured. Of the 31 values predicted, 15 agreed with measurement, 11 differed by I point, and 5 differed by 2. What is more useful is that the method predicts the shape of the transmission loss curve quite well, especially at low frequencies, as Fig. 9 shows.
The A TL spectra can be used to calculate transmission loss and STC values for all the unmeasured cases in Table III, although many of the constructions are unJikely to be used in practice. More important, one can assume that the same !i TL spectra can be used to predict transmissiOn loss and STC for other normal-weight block walls. The block weight is so much greater than that of the added wallboard that it does not significantly affect the calculated mass-air-mass resonance frequency. Only the transmission loss for the bare block wall changes. Measurements were also made with 140-mm block walls and provided an opportunity to find how well this assumption works.
c.
Application to other blocks: 140-mm blocks withadded gypsum wallboard
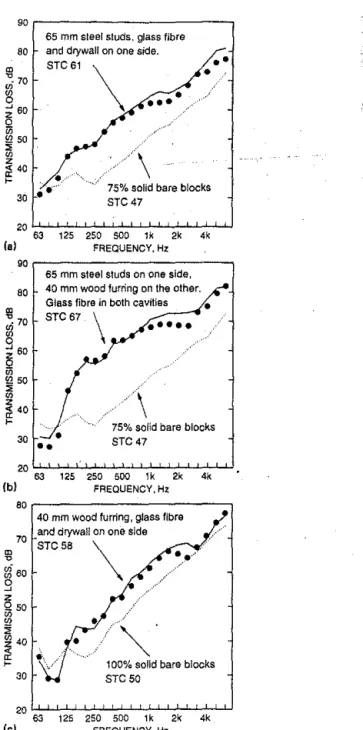
Two types of 140-mm block were measured, a 75% solid block and a 100% solid block. Figure 10 shows the measured and predicted transmission loss values for three configura-tions. There were four configurations tested. The predicted STC in each case was 1 point lower than that measured, which is acceptable agreement considering the fact that in three of the constructions 13-mm gypsum wallboard was used in place of 16-mm gypsum wallboard. The STC ratings aie determined in this instance by the transmission loss val-ues from about 200-800 Hz. The predicted valval-ues are mar-kedly low at high frequencies, but the agreement is fairly good in the important low-frequency range.
This prediction scheme is obviously very limited. Changing the thickness of the drywall, the number of screws attaching the drywall to rigid furring, the spacing of the fur-ring, the thickness or the flow resistivity of the sound·ab-sorbing material can all be expected to influence the position of the mass-air-mass resonance frequency or the increment in transmission loss at the higher frequenpies. Another com· plication is block porosity. The prediction scheme should not be extended to blocks that are significantly more porous than the blocks measured here unless the surfaces are paint-ed. If the block is sufficiently porous, the effective depth of the air cavity is increased and the mass-air-mass resonance frequency decreased. ATL spectra extracted from data in Refs. 2 and 5 showed reasonable agreement with those found here, but there were also changes in the position of the crossw over frequency by one band or so. Above the crossover, changes of a few decibels in the increments in transmission loss were seen.
This prediction method sheds no light on the physical
1462 J. Acoust. Soc. Am., VoL 90, No.3, September 1991
90r---, ao
"'
"O_ 70セ@
セ@ 60セ@
!:!2 so セ@ z65 mm steer studs, glass fibre and drywall on one side. STC61 \ 0
•••
..
··'·••
•
セ@ 40 セ@セ@
·•····
3075% solid bare blocks STC47 (a) FREQUENCY, Hz 90r---, 80
"'
'0. 70セ@
セXP@§
£?.50 セ@セ@
40 3065 mm steer studs on one side. 40 mm wood furring on the other. Glass fibre in both cavities
STC67 \
•••••
\
•
•
••
75% solid bare blocks STC 47
RPキ⦅セセセセMlセセセセセセ@
63 125 250 500 1k 2k 4k (b) FAEOUENCY,Hz
80
40 mm wood furring, glass fibre and drywall on one side 70 STC58 \ 'll g:f 60 g
._
•...
z Q 50 13"
セ@ 40セ@
30•
•..
•
100% solid bare blocks STC 50
20
63 125 250 500 1k 2k 4k
(c) FREQUENCY, Hz
FIG. 10. Measured (solid line) versus predicted (e) transmission loss for 140-mm concrete block walls. (a) 65-mm steel studs, glass fiber, and drywall on one side. (b) 65-mm steel studs on one side, 40-mm wood furring on the other. Glass fiber in both cavities. (c) 40-mm wood furring, glass fiber, and the drywall on one side.
mechanisms determining the transmission loss behavior of the wall and it has the obvious limitations just mentioned. It does deal with the mass-air-mass resonance and has the カゥイセ@ tue of simplicity.
By
entering the ATL values from Table IV together with data for bare block walls into a spreadsheet, it becomes a simple matter to select walls and attachment techw niques and to predict STC and transmission loss as needed. For many engineering calculations, this process should be adequate. Of course, simple models such as that in Ref. 16 could be empirically modified to include the mass-air-mass resonance.VII. CONCLUSIONS
The data presented here show the important influence of the mass-air-mass resonance on transmission loss for block
wa11 systems. This influence would not have been so 。ーー。イセ@
ent had the measurement frequency range extended to only 125Hz as required by current standards. 17 The
low-frequen-,.-,. cy effects are important for selecting wall constructions to
t reduce noise transmission between homes or to reduce the
transmission of low-frequency machine noise. Similar mass-air-mass resonance effects can be expected for cavity walls
using studs and drywall where the masses of the layers are not so disparate. Again, systematic data extending to low
frequencies is needed for such cases.
The location of the mass-air-mass resonance was not ·well established by these measurements. If one assumes that the crossover frequency is at some constant ratio above the mass-air-mass resonance, as is done here, then the data sug-gestthat sound-absorbing material in the cavity lowers the mass-air-mass resonance bY more than the 15% suggested in Ref. 13. The
11,J2
factor suggested by Schultz" gives bet-ter agreement with these data but an empirical factor of 1/1.8 is betterstill. More work is needed to clarify the effect of sound-absorbing material.Possible interactions between structural resonances in the bare wall and the various attached panels were not inves-tigated. Such interactions could influence the position of low-frequency resonances.
The prediction method presented here could be labeled simplistic. Nevertheless, it lets consultants and others pre-dict block wall performance with reasonable accuracy for these particular drywall finishes. More work is needed to find out how factors such as block porosity will influence transmission loss for block wall systems such as these.
ACKNOWLEDGMENTS
Part of this work was supported by the Ontario Con-crete Block Association. The author is grateful for this sup-port.
1463 J. Acoust. Soc. Am., Vol. 90, No.3, September 1991
1"Catalog ofSTC and IIC Ratings for Wall and Floor/Ceiling
Assemb-lies," Office of Noise Control, California Department of Health Services, 2151,-Berkeley Way, CA 94704.
2A. C. C. Warnock and D. W. Monk, "Sound Transmission Loss of
Ma-sonry Walls: Tests on 90, 140, 190, 240and 290mm Concrete Block Walls with Various Surface Finishes," Building Res. Note 217, June 1984. lT. D. Northwood and D. W. Monk, "Sound Transmission Loss ofMa·
sonry Wails: Twelve-inch Lightweight Concrete Blocks with Various Sur-face Finishes," Building Res. Note 90, April1974. ·
4T. D. Northwood and D. W. Monk, "Sound Transmission Loss of
Ma-sonry Walls: Twelve-inch Lightweight Concrete Blocks.:...Comparison of Latex and Plaster Sealers," Building Res. Note 93, September 1974.
セaN@ Litvin and H. W. Belliston, "Sound Transmission Loss Through Con-crete and ConCon-crete Masonry Walls," Proc. J. Am. Concrete Institute 75 {12), 641, December 1978.
6J. S. Bradley, "SubjectiveRatingofParty Walls," Canadian Acoustics 11,
37 (1983).
lCaJifornia Noise Insulation Standards, State Building Code, Appendix Chap. 35, Sound Transmission Control, December 1988.
8''National Building Code of Canada 1990," Associate Committee on the
National Building Code, National Research Council Canada, Ottawa, NRCC 30619, 1990.
9ISO 140/1, "Measurement of Sound Insulation in Buildings and of
Build-ing Elements."
10F, J. Fahy, Sound and Structural Vibration (Academic, New York,
1985), p. 169.
11J. D. Quirt, "Sound Transmission Through Windows. I. Single and
Dou-ble Glazing," J. Acoust. Soc. Am. 72, 834 { 1982).
12R. Josse (Ed.), Acoustique, REEF Vol. II, Centre Scientifique et Tech·
nique due Batiment, 4, avenue du Recteur Poincare, Paris, p. 186 ( 1982),
13I. L. Ver and C. I. Holmer, Noise and Vibration Control, edited by L, L.
Beranek {McGraw-Hill, New York, 1971 ), p. 320.
14T, J. Schultz, Noise and Vibration Control, edited by L. L. Beranek
(McGraw-Hill, New York, 1971 ), p. 488. '
15L, ·c. Fothergitl and R. S. A1phey, "The Effect of Wall Linings on the
Sound Insulation Between Dwellings," Appl. Acoust. 26,57 (1989).
16Jl. H. Sharp, "Prediction Methods for the Sound Transmission of Build·
ing Elements," Noise Control Eng. 11, 53 (1978); "A Study of Tech· niques to Increase the Sound Insulation of Building Elements," Rep. PB-222 829, NTIS U.S. Dept. of Commerce.
11 ASTM E90, Standard Test Method for Laboratory Measurement of
Air-borne Sound Transmission Loss of Building Partitions.
lKR. E. Halliwell and A. C. C. Warnock, "Sound Transmission Loss: Com-parison of Conventional Techniques with Sound Intensity Techniques;" J. Acoust. Soc. Am. 77,2094 (1985).
19 A. C. C. Warnock, "Sound Transmission Loss Measurements Through
190 mm and 140 mm Blocks with Added Drywall and Through Cavity Block Walls," IRC Internal Rep. 586, National Research Council of Can· ada, 1990.