Publisher’s version / Version de l'éditeur:
Materials and Structures, 36, April, pp. 147-155, 2003-04-01
READ THESE TERMS AND CONDITIONS CAREFULLY BEFORE USING THIS WEBSITE.
https://nrc-publications.canada.ca/eng/copyright
Vous avez des questions? Nous pouvons vous aider. Pour communiquer directement avec un auteur, consultez la première page de la revue dans laquelle son article a été publié afin de trouver ses coordonnées. Si vous n’arrivez pas à les repérer, communiquez avec nous à PublicationsArchive-ArchivesPublications@nrc-cnrc.gc.ca.
Questions? Contact the NRC Publications Archive team at
PublicationsArchive-ArchivesPublications@nrc-cnrc.gc.ca. If you wish to email the authors directly, please see the first page of the publication for their contact information.
NRC Publications Archive
Archives des publications du CNRC
This publication could be one of several versions: author’s original, accepted manuscript or the publisher’s version. / La version de cette publication peut être l’une des suivantes : la version prépublication de l’auteur, la version acceptée du manuscrit ou la version de l’éditeur.
Access and use of this website and the material on it are subject to the Terms and Conditions set forth at
A Coupled A.C. impedance - creep and shrinkage investigation of
hardened cement paste
Tamtsia, B. T.; Beaudoin, J. J.; Marchand, J.
https://publications-cnrc.canada.ca/fra/droits
L’accès à ce site Web et l’utilisation de son contenu sont assujettis aux conditions présentées dans le site LISEZ CES CONDITIONS ATTENTIVEMENT AVANT D’UTILISER CE SITE WEB.
NRC Publications Record / Notice d'Archives des publications de CNRC:
https://nrc-publications.canada.ca/eng/view/object/?id=445a257a-ec23-4524-91ba-448d749eccf6 https://publications-cnrc.canada.ca/fra/voir/objet/?id=445a257a-ec23-4524-91ba-448d749eccf6
A Coupled AC impedance – creep and shrinkage
investigation of hardened cement paste
Tamtsia, B.T. ; Beaudoin, J.J. ; Marchand, J.
NRCC-43925
A version of this document is published in / Une version de ce document se trouve dans:
Materials and Structures, v. 36, April 2003, pp. 147-155
A Coupled AC Impedance – Creep and Shrinkage
Investigation of Hardened Cement Paste
Tamtsia T. Basile
1, Beaudoin J. James
1and Marchand Jacques
2(1) Institute for Research in Construction, National Research Council of Canada, Ottawa, Canada, K1A 0R6 (2) Department of Civil Engineering, Université Laval, Ste-Foy, Québec, Canada, G1K 7P4
Paper received: December 17, 2002 Paper accepted: January 10, 2003
ABSTRACT
The effect of three pre-drying treatments (prior to re-saturation with synthetic pore fluid) on time dependent deformation was investigated.
The pre-drying treaments comprised methanol and isopropanol exchange (followed by vacuum heating at 37°C) and vacuum drying at 37°C alone. Real-time changes in microstructure due to sustained load were followed through the coupling of an a.c. impedance frequency analyzer with a miniature loading system.
Cement paste specimens were in the form of T-shaped columns with minimum thickness value around 1 mm. The impedance analysis included an assessment of the relevance of the high frequency arc depression angle to creep and shrinkage behavior of cement paste.
RÉSUMÉ
L’effet de trois traitements de pré-séchage (suivi d’une resaturation avec une solution interstitielle synthétique) sur les déformations différées a été investigué.
Les traitements de pré-séchage consistes au séchage sous vide à 37°C d’éprouvettes avant et après immersion dans un solvant (méthanol ou isopropanol). Les modifications causées par la charge appliquée sur la microstructure étaient suivies en temps réel par le biais du couplage d’un analyseur de fréquences d’impédance avec un système de chargement miniature.
Les éprouvettes de pâte de ciment étaient de petites colonnes en forme de T ayant une épaisseur minimale d’environ 1 mm. L’analyse des spectres d’impédance inclue une évaluation de la pertinence de l’angle de dépression sur le fluage et le retrait de la pâte de ciment.
1. INTRODUCTION
Despite the extensive number of publications on deformation and creep of cement paste, mortar and concrete, no satisfactory theory for the time-dependent chemical and physical processes responsible for creep has been universally accepted [1,2]. An excellent review of the mechanisms of creep and shrinkage is provided by Neville et al. [3]. A detailed description of the mechanisms will not be provided here. There remains however, a dichotomy of opinion concerning the role of water in the creep process. Water movement is considered either an essential element or a secondary factor [4,5]. Descriptions of creep mechanisms often correspond to conceptions or models of the calcium silicate hydrate microstructure [6]. Powers has suggested that creep of cement paste is caused by a diffusion of the load-bearing water as an external load changes the free energy of the
absorbed water [7]. This view referred to as the ‘seepage’ theory is argued on the assumption that cement paste is a microporous ‘gel-like’ material. Movement of water is an intrinsic feature of the mechanism. Feldman has suggested that creep occurs through the gradual crystallization or aging of the layered C-S-H leading to an increased amount of layering [8]. Water movement was not considered a major mechanism.
Recently electrical methods, e.g. A.C. impedance spectroscopy, have shown promise as tools for characterizing microstructural development in cement-based materials [9-27]. Analysis of the spectra provides pore structure information. The objective of this study was to obtain real-time descriptions of microstructural change during creep and shrinkage of cement paste through the coupling of time-dependent deformation and impedance measurements. In addition the use of the solvent exchange process as a
microstructural probe was investigated in order to provide additional insight into creep behavior. The experiments were designed to further understanding of creep mechanisms in cement-based materials.
2. DRYING OF HYDRATED CEMENT
PASTE
The drying of hydrated Portland cement paste was the subject of considerable debate in the 1960's and 1970's due to its relevance to the development of models for the structure of C-S-H [28]. A primary issue was whether or not water was capable of re-entering the layered structure subsequent to drying. This had not only structural implications but also relevance to the validity of applying classical sorption theory to the cement paste – water system.
The concept of D-drying was first introduced by Copeland and Hayes [29]. It referred to drying of cement paste by outgassing to the vapor pressure of dry ice at -79 °C (0.5xl0-3 mm Hg). They stated that it took from 4 to 7 days for equilibrium to be reached. This involves drying from fairly wet conditions to the removal of both the tightly held first layer and the even more tightly held interlayer water from the very narrow spaces. The slower than normal times required for equilibrium of water during the adsorption stage is probably due to the lengthy process of re-opening the layers.
The 11% RH condition corresponds to approximately a monolayer of coverage [30]. Other drying conditions described in this paper are intermediate between the D-dry state and the equilibrium position at 11%RH. Feldman established an equivalent to D-dry method using a vacuum electrobalance and thermal balance techniques [31]. It was determined that vacuum degassing at 105°C for 3 hours was equivalent to D-drying. This corresponds to a mass loss of 8 to 9 % based on the D-dried state.
The drying pre-treatments described in this paper are as follows:
(1) D-dry - this stage was attained using the equivalent drying method described above.
(2) Vacuum drying at 37°C for 24 hours - this 'soft drying' procedure is equivalent to P- drying [32]. P-drying refers to drying to the vapor pressure of Mg(ClO4)2.2H20 or Mg(ClO4)2.4H20 i.e. 8xl0-3 mm Hg. At this vapor pressure there is about 14% more water retained by the paste than by D-drying.
(3) Solvent exchange using methanol or isopropanol followed by vacuum drying at 37°C. The solvent replacement is effective in removing the bulk of the evaporable water. Subsequent vacuum drying provides a state intermediate between D-drying and P-drying.
The relative states of drying described above can be illustrated by the differential TGA (DTGA) traces in Figure 1. It can be observed that the hydrated cement paste sample that has been vacuum dried at
105°C for 3 hours (D-dried) will lose a larger amount of water than the sample that has been vacuum dried at 37°C for 24 hours. The variation of mass change is similar for both drying methods up to 105°C. From 105°C to about 180°C the derivative change indicates that the D-drying may have a greater effect on the structure of C-S-H than drying at 37°C. A comparison of the TGA results for the D-dry specimen to those for the vacuum dried specimen (37°C for 24 hours) indicates that the latter contains 2.2% (based on ignited weight) more water than the former at 180°C. The curves for the saturated specimens all display significant changes in the derivative values. The significance of these curves is discussed later in section 5.3.
Fig. 1 – Derivative mass change of hydrated cement paste (w/c=0.50) after re-saturation with synthetic
pore solution subsequent to different drying pre-treatments. The relevance of the different pre-treatments lies in the degree to which water is removed below the monolayer level and to its implication for volume change. The relevance of the solvent exchange process for creep is given in section 3.
Drying to 96% RH
A characteristic of the water sorption isotherm for cement paste is that the desorption branch (in the high humidity region) is less steep than the adsorption branch as a result of the large secondary hysteresis [31]. The amount of water desorbed at 96% RH is only about six per cent of the D-dried mass of the cement pastes. Most of the capillary pores continue to contain some bulk water. Those pores that empty would still have adsorbed films on their surfaces.
A.C. impedance spectra are readily obtained when equilibrium is attained at 96% RH as the system is still effectively percolated. The objective of choosing a test humidity of 96% RH was to provide a test environment for both creep and shrinkage measurements (shrinkage, although small, will occur due to meniscus effects) while minimizing any significant decrease in percolation. Changes in the spectra are readily detected during the equilibrium process. It is well known that the menisci do not completely rupture until about 45% RH where there is a marked effect in the length change desorption isotherm due to elastic rebound [6].
3. THE RELEVANCE OF SOLVENT
EXCHANGE TECHNIQUES FOR
CREEP INVESTIGATIONS
Several studies of the microstructure of cement paste describe solvent exchange with methanol as a technique that 'preserves' the wet-state structure of the material [33,34]. For example, large decreases in surface area do not result subsequent to the removal of methanol. An implicit assumption in these studies is that the solvent does not interact with C-S-H. This may not be correct [35]. The 'preservation' capacity of the solvent exchange process is relevant to creep investigations as the 'in-situ' microstructure may be more closely approximated. Complete drying does not occur in practice. The accompanying collapse of the C-S-H structure due to water removal is therefore more moderate.
The 'preservation' of C-S-H structure on drying is also influenced by the solvent exchange process. Powers reported that even a slow drying of a cement paste to 79% relative humidity increases its water permeability 70 times suggesting the effect would be even greater if drying to equilibrium at a lower humidity had occurred [36]. Studies by Parrott on the effect of drying history upon the exchange of pore-water with methanol corroborates Powers observations and suggests that drying even to intermediate humidities causes a partial collapse in the smaller pores and a corresponding increase in the volume of the largest pores [37]. This supports the assumption that the total porosity is relatively constant and that only the pore size distribution is altered.
AC. impedance studies have also demonstrated a pore coarsening effect on drying [27]. The impedance spectra for cement paste (w/c=0.30) re-saturated with synthetic pore solution subsequent to cycles of wetting and drying undergo a systematic decrease in the size of the high frequency arc to lower resistance values (Figure 2) suggesting an increase in the mean pore size. The pore coarsening effect was confirmed by mercury intrusion data.
Fig. 2 – AC impedance spectra for cement paste (w/c=0.50) subjected to cycles of wetting/drying subsequent to re-saturation with synthetic pore solution. Numbers indicate the conditioning sequence. Data point are experimental; solid lines are obtained from computer simulation [27].
The microstructural 'preservation' effect (including pore coarsening phenomena) of the solvent exchange process is useful for studying the varying degrees of microstructural collapse on the creep process. In addition the exchange process affords the opportunity of examining the 'dry-state' (obtained through different procedures) and its effect on creep. Parallel studies on the role of water in the creep process are on-going [38]. This work examines the creep phenomena in absence of water.
4. IMPEDANCE BEHAVIOR OF
CEMENTITIOUS MATERIALS
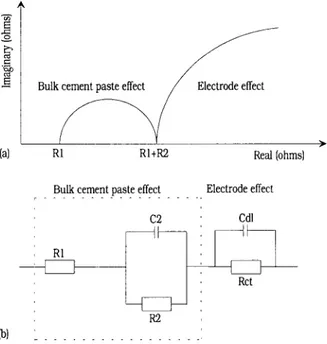
Impedance spectra recorded over a wide range of frequencies (from 15 MHz to 1 Hz) have provided new information and insight on cement paste microstructure and hydration. An idealized impedance spectrum for a cement system is plotted in the real versus imaginary plane (Fig. 3(a)). A single arc in the high-frequency range with a small part of a second arc in a relatively low-frequency region is shown. It is suggested that the high-frequency arc (HFA) is attributed to the bulk paste impedance behavior and the second arc is due to the cement paste-electrode surface capacitance contribution [10].
Fig. 3 – (a) Schematic plot of a high frequency arc in the impedance complex plane obtained for cement paste systems. (b) A simplified electrical equivalent circuit for hydrating cement systems. R1, R2 and C2 are high frequency resistance, solid-liquid interface and capacitance. Rct and Cdl are cement-electrode interface charge transfer resistance and double layer capacitance.
The intercepts R1 (at the high-frequency end, at c. 20 MHz-7 MHz) and R1+R2 (at the minimum between the electrode arc and bulk arc, at frequency c. 100 kHz) are important parameters providing information related to cement paste microstructure. Interpretation
of an impedance spectrum (IS) usually involves modeling with an equivalent circuit (Fig. 3(b) until the electrical response of the elemental microstructure of the cement paste is well simulated.
Cement based materials generally contain a broad size distribution of conducting pores [11,12]. The network of these conducting pores continuously changes during the drying process [13-15]. This change can be detected in AC impedance spectra [13-17]. In very dry materials the content of electrolyte is not large enough to cover the internal pore surfaces, Brantervick and Niklasson [18]. Hence the geometry of the conductive network is changed depending on broken links in the original network. Christensen et al. [19] found the cement paste to be a complicated composite conductor because its microstructure and the conductivity of its pore fluid are interrelated and time-dependent. McCarter et al. state that only the free capillary water in mortar samples would require a higher energy input to remove it from the gel surface. in such mortar samples the water adsorbed by capillary suction forces has been shown to have a significant influence on the electrical response[20].
Previous investigations [21-23] have indicated that impedance behavior of the hydrating Portland cement system depends upon the ionic concentration of the pore solution and porosity. The high frequency arc diameter (or chord), R2, has been shown to be an inverse function of porosity, mean pore size and ionic concentration of the pore solution. In practice, an ideal semi-circle is generally not observed in most materials. It is normally an inclined semi-circle with its center depressed below the real axis by a finite angle referred to as the depression angle. This behavior, normally associated with a spread of relaxation times [24], cannot be described by the classical Debye equation employing a single relaxation time [25,26]. A dispersive, frequency-dependent element or so-called constant phase element (CPE) [39-41] can be introduced to account for the shape of the depressed complex plot. The impedance contribution of this element can be expressed as follows: n o
j
A
CPE
Z
(
)
=
−1(
ω
)
− (1)where n=1-αd and αdπ/2 is the depression angle. Therefore, n can be used to represent the degree of perfection of the capacitor and represents a measure of how far the arc is depressed below the real impedance axis.
Influencing factors on the depression angle such as a spread of relaxation times and non-Debye behavior have been suggested [24,42]. A wider spread of pore diameters can also be associated with a larger dispersion angle [26]. The magnitude of the depression angle reported for normal cement paste, silica fume-Portland cement paste and porous glass is 28.5, 17 and 9° respectively. The time for the reorientation of ions or relaxation time appears to be
affected by the geometry of the pores and the surface chemistry of the solid. Pore size and pore surface chemistry could limit the oscillation frequencies of the hydrated ions a water molecules, which respond to the applied A.C. signal. That is because a stronger ion-ion interaction-ion would be expected in small pores than in larger ones. Therefore a broader pore size distribution would result in a wide spread of relaxation times corresponding to a larger depression angle.
Disturbed circuit elements are associated with two types of physical interpretation. The first association is directly with a non-local process, for example, diffusion. The other arises because microscopic characteristics such as interface properties and grain boundary effects are themselves often distributed throughout the material.
5. EXPERIMENTAL PROGRAM
5.1 Specimen preparation and
characteristics
The hydrated cement paste used for this experimental study was made with type 10 Portland cement mixed with de-aired distilled water at a w/c=0.5. The Portland cement had the following composition in percent: SiO2 (20.72); Al2O3 (5.87); Fe2O3 (3.07); CaO (62.66); MgO (3.46); SO3 (2.18) and free lime (0.24). The Bogue composition was as follows: C3S (46.5); C2S (24.6); C3A (10.4) and C4AF (8.3). The fineness of the cement was 340 m2/kg. Vacuum mixing was carried out in hollow Perspex cylinder 30 mm in diameter and 80 mm in length. Mixing of the paste was carried out using a magnetic stirrer placed inside the cylinder and the latter place between two large magnets [43]. This ensured homogeneity. The cylinders were slowly rotated while the paste hardened in order to avoid bleeding and resulting in a homogeneous product. Specimens were demoulded after 24 hours and stored in lime water at 22°C for up to two years.
The resistivity of the saturated cement paste at 2 years was about 35.2 Ω.m. The compressive strength at 28 days was 34.5 MPa. The stress-strength ratio for the creep tests performed on 2 years old samples was 0.30. The samples were fabricated from paste cylinders in order to obtain a ‘T-shaped’ specimen about 1 mm thick with a height of 25.4 mm and a flange width of 5.72 mm. A special jig was constructed to facilitate the cutting of the specimens with a precision saw.
5.2 Specimen pre-treatment
5.2.1 Untreated control samplesSamples were saturated surface dry and directly used for test without any further treatment. The
following experiments were conducted with the control specimens.
• Shrinkage measurements from saturation to about 96% relative humidity.
• Total strain measurements from saturation to about 96% RH under sustained load for a period of 3 days followed by strain recovery measurements after the removal of the load.
• Real time A.C. Impedance spectra determination associated with the shrinkage test.
• Real time A.C. Impedance spectra determination associated with total strain and strain recovery tests.
5.2.2 Pre-drying
The initial pore solution conductivity was determined by expressing pore fluid from the cement paste using a hydraulic press and collecting it in a syringe. Measurements were taken using a conductivity probe. A synthetic pore solution was prepared using saturated lime water to which potassium chloride was added to obtain the same resistivity as that of the pore solution of the cement paste.
Treatment 1 (Drying at 37°C): Samples were initially saturated surface dried, vacuum dried at 37°C for 24 hours and then re-saturated under vacuum for 18 hours. Prior to the re-saturation process, the samples were vacuum dried for 3 hours in a desiccator at 1x10⁻⁴ mm Hg.
Treatment 2 (Methanol Exchange): Water saturated samples were soaked in methanol for 48 hours, vacuum dried at 37°C for 24 hours, then saturated under vacuum for 18 hours. Prior to the re-saturation process, the samples were vacuum dried for 3 hours in a desiccator at 1x10⁻⁴ mm Hg.
Treatment 3 (Isopropanol Exchange): Water saturated samples were soaked in isopropanol for 48 hours, vacuum dried at 37°C for 24 hours, then saturated under vacuum for 18 hours. Prior to the re-saturation process, the samples were vacuum dried for 3 hours in a desiccator at 1x10⁻⁴ mm Hg.
The same experiments were conducted for all the pre-dried specimens (three treatments) as were carried out for the untreated control samples.
5.3 Differential thermogravimetric
analysis (DTGA)
DTGA curves were obtained using a Dupont 951 Thermal Analyzer. The DTGA curves for the control specimens and those subjected to the three pre-treatments are presented in Figure 1. They provide an appreciation of the initial moisture state prior to loading.
The appearance of two low temperature peaks (at about 50°C and 105°C) has been associated with the presence of bulk pore water and interlayer water [44]. The control sample exhibits two peaks at these
temperatures. Two peaks can also be discerned for each of the pre-treated samples. They are much broader. The peak at the higher temperature appears to have shifted to a lower temperature i.e. about 75°C. The pre-treatment (heat or solvent exchange) appears to have perturbed the C-S-H structure. Removal of interlayer water appears to begin at a lower temperature.
5.4 Detail of coupled AC impedance –
creep measurement system
The AC impedance shrinkage and creep spectral responses were carried out by mounting the ‘T-shaped’ specimens on a fixed frame linking the specimens to a load cell through electrode interfaces which were connected to a Solartron 1260 frequency response analyzer. The microstructural changes were continuously monitored in a controlled relative humidity environment as the time under load increased. Figures 4 and 5 show the experimental device as well as detail of the ‘T-shaped’ specimen-electrode connection interface.
Fig. 4 – Experimental creep frame showing linkage of the AC impedance measurement system.
Fig. 5 – Detail of ‘T-shaped’ specimen-electrode connection interface.
6. RESULTS AND DISCUSSION
The total strain-time curves for the cement paste specimens (w/c=0.50, stress-strength ratio=0.30) under sustained load at 96% RH are presented in Figure 6. The rate of change of total strain in the first 20 hours is lower for the saturated control specimens than the rates for specimens dried by heating or
solvent exchange plus heating. The total strain at 72 hours is 320, 450, 515 and 600 µ∈ for the control specimens and those dried at 37°C, solvent exchanged with isopropanol and solvent exchanged with methanol respectively prior to re-saturation with pore solution. Strain recovery for the control specimens and those dried at 37°C or exchanged with isopropanol prior to re-saturation with pore solution is about 100 µ∈. The value of strain recovery for the methanol exchanged specimen is about 200 µ∈. The increase in total deformation of the dried (37°C) or solvent exchanged specimens may be partly due to the pore coarsening effect. However, substantial evidence has been presented that indicates methanol perturbates (interacts with) the solid [35]. Nevertheless the collapse of the C-S-H structure on drying prior to re-saturation may occur to a lesser extent for pastes that have undergone solvent exchange. This may be a reason for the higher strain values observed.
Fig. 6 - Total strain (Creep+Shrinkage) and strain recovery of hardened cement paste (w/c=0.5) conditioned at about 96% relative humidity after re-saturation from different drying pretreatment.
The shrinkage behavior of the re-saturated cement paste in the first few hours is similar for all drying pre-treatments, Figure 7. The isopropanol exchanged specimens re-saturated with pore solution and the control specimens shrink about 150-160 µ∈ after 120 hours. The re-saturated methanol exchanged specimens and those dried to 37°C before re-saturation shrink about 300 and 275 µ∈ at 120 hours respectively. The bulk of the shrinkage takes place in the first 20 hours for all specimens. Methanol exchanged results in both the largest total strain and shrinkage for these specimens.
The drying creep curves (total strain - shrinkage strain) are plotted in Figure 8. Solvent exchange and drying at 37°C prior to re-saturation results in significantly larger creep (e.g. at 72 hours). Isopropanol and methanol exchange result in creep of 325 and 280 µ∈ respectively. The specimens dried at 37°C have creep values of about 265 µ∈. The control saturated specimens have a creep value of about 160
µ∈, considerably less than the treated specimens.
Creep recovery at 120 days is 110, 170, 230, 125
µ∈ for control specimens and those treated by 37°C drying, methanol and isopropanol exchanges. Methanol exchange results in the largest total strain, the largest shrinkage and the largest creep recovery. Creep of methanol exchanged specimens is also large and approaches that of the isopropanol exchanged specimens.
Fig. 7 - Shrinkage of hardened cement paste (w/c=0.5) conditioned at ~96% relative humidity after re-saturation from different drying pre-treatment.
Fig. 8 - Specific drying creep of hardened cement paste (w/c=0.5) conditioned at ~96% relative humidity after re-saturation from different drying pre-treatment.
AC impedance spectra (real-time) were obtained at 96% RH for unloaded and loaded cement paste specimens for all four pre-treatment conditions. The magnitude of the high frequency resistance (HFR) and the size of the high frequency arc diameter (HFA) have been attributed to the properties of the pore solution, pore size and pore network [21-23]. Only the information provided by HFA will be presented and discussed in this paper. Figures 9 and 10 are Nyquist plots for shrinkage and total strain of methanol exchanged specimens. Plots for all the four pre-treatments are similar in character and are not shown. The size of the high frequency arc increases with time (up to 72 hours) in both cases for all pre-treatments. The growth of the high frequency arc is
also consistent with loss of moisture accompanying shrinkage. About six percent (by mass of D-dried paste) of capillary water is lost at 96% RH. The size of the high frequency arcs for the unloaded specimens is significantly greater than the corresponding arcs (at each specific time) for the loaded specimens.
Fig. 9 - AC impedance spectra: shrinkage of hcp methanol soaked vacuum dried at 37oC and re-saturated with pore solution (w/c=0.5); specimens conditioned at about 96% relative humidity for 0, 1, 2, 3.66, 6.5, 9, 12.66, 24, 48, and 72 hours.
Fig. 10 - AC impedance spectra: total strain of hcp methanol soaked vacuum dried at 37oC and re-saturated with pore solution (w/c=0.5); specimens conditioned at about 96% relative humidity for 0, 1, 2, 3.66, 6.5, 9, 12.66, 24, 48, and 72 hours.
The growth of the high frequency arc diameter (total strain conditions) for all the specimens subjected to the four pre-treatments is plotted in Figure 11. The size of the arc at 72 hours is in the following order: Untreated > isopropanol exchanged > methanol exchanged > drying at 37°C. The total strain (Figure 6) was in the following order: methanol exchanged > drying at 37°C > isopropanol exchanged > untreated. These results are consistent with the relative pore coarsening effects (described earlier) due to the pre-drying treatments. The fact that the methanol exchanged specimens and those pre-dried at 37°C exhibited the smallest arcs and largest total strains suggests that pore coarsening affects these samples to a greater extent. Pore coarsening and subsequent
re-saturation reduces overall resistivity relative to the untreated specimens [27].
It is suggested that the smaller arc sizes for the total strain sequences (compared to shrinkage) are indicative of processes involving displacement (slipping and sliding) of C-S-H sheets induced by the applied load. This suggestion is supported by the observation that creep of cement paste occurs even in the dry state [38]. Previous work has shown that loading cement paste up to about 50 percent of the maximum load did not significantly affect the size of the high frequency arc [45]. This suggests that microcracking processes had little effect on the A.C. impedance response (stress/strength ratio ≈ 0.30) obtained in these experiments.
Fig. 11 - High-frequency semi-circle diameter R2 after re-saturation from several drying conditions during total strain (Creep+Shrinkage) test at about 96% RH.
Fig. 12 - Difference between shrinkage and total strain (creep + shrinkage) high-frequency semi-circle diameter R2 of cement paste (w/c=0.5) conditioned at about 96% relative humidity.
Figure 12 is a plot of the difference in high frequency arc diameter between the shrinkage and the total strain impedance spectra at corresponding times. The differences reflect the effect of the applied load on creep. There is generally an increase in the difference with time (except at early times (up to 4 hours) for the isopropanol exchanged specimens). At 24 hours the differences are in the following order:
methanol exchanged > isopropanol exchanged > untreated > pre-drying at 37°C. The large differences for the methanol and isopropanol exchanged samples are consistent with the large relative creep observed for these specimens. There may be an enhanced tendency for the relative displacement of the C-S-H sheets at the microstructural level. The early decrease in arc diameter difference with time for the isopropanol exchanged specimens suggests that sliding-slipping processes affecting displacement of the C-S-H sheets may be delayed. In this case it would appear that some pore compression (pore size reduction) may occur in the early stages.
The depression angle parameter n=1-αd is plotted against time for the cement paste specimens in Figure 13. The initial value of n is in the following order: untreated > methanol exchanged > isopropanol exchanged > pre-drying at 37°C. The order remains the same after the first few hours with the exception of n for the untreated specimen which decreases rapidly between 2 and 6 hours reaching a value significantly lower than for the treated specimens. This suggests that initially the drying treatments perturbate (increase the roughness) the surface. It has been suggested that grain boundary effects in polycrystalline materials contribute to the arc depression [46]. The dependence of the arc depression has also been linked to fractal characteristics of the surfaces [47,48]. The low values of drying creep for the untreated specimens may be related to the low values of the depression angle parameter. As previously stated a broader pore size distribution would result in a wide spread of relaxation times corresponding to a larger depression angle. The low value of creep for the untreated specimen is consistent with a broader pore size distribution (no pore coarsening) and hence larger depression angle (smaller values of n). The fractal nature of the surface may affect the slipping-sliding behavior of the C-S-H sheets in cement paste under load. The relative magnitude of the creep of methanol and isopropanol exchanged specimens corresponds to a higher value of the depression angle parameter, n. This is consistent with smaller depression angles and a narrower pore size distribution (pre-treatment leads to significant pore coarsening).
The specific total strain rate versus time is plotted as a log-log relation in Figure 14. Two straight lines describe the data. The line for the untreated control specimens lies below a line representative of the other specimens. Ulm has demonstrated that the specific creep rate is independent of loading time and degree of hydration [49]. An important observation supporting this was the co-linearity of the log creep rate-log time curves. It was also demonstrated that the long-term aging effect was characterized by a decrease of the creep rate that was proportional to the inverse of the material age. This would appear to suggest that the rate determining mechanism is associated with the behavior of the C-S-H sheets themselves, perhaps involving a slipping and sliding process. This is
supported by the observation that D-dry cement paste specimens were found to exhibit significant creep [38].
Fig. 13 - Depression angle of the high frequency arc after re-saturation from several drying conditions.
Fig. 14 – Compliance rate of hardened cement paste (w/c=0.50) conditioned at about 96 % relative humidity after re-saturation from different drying pre-treatments.
7. CONCLUSIONS
1. The pdrying of cement paste prior to re-saturation with synthetic pore solution results in an increase in the total strain with time due to the application of a sustained load.
2. The increase in total deformation (under sustained load) of the vacuum dried (37°C) or solvent exchanged cement paste may be partly due to a pore coarsening effect.
3. Methanol exchange appears to perturb the solid phase of the cement paste to the extent that both total strain, strain recovery and shrinkage have the largest values in this study.
4. Creep of cement paste subjected to drying is most affected by the solvent exchange pre-drying treatment. This also applies to creep recovery.
5. A.C. Impedance spectroscopy can detect real-time microstructural changes in cement paste unloaded or subjected to a sustained load.
6. There is a systematic time-dependent growth in the size of the impedance high-frequency arc for unloaded or loaded cement paste.
7. The size of the high frequency arc is consistent with a pore coarsening effect in the cement paste due to pre-drying treatment. Observation of the smallest arcs corresponds with the largest values for total strain.
8. Smaller high frequency arc sizes for total strain measurements relative to the arcs obtained for shrinkage measurements suggests that continuous
processes involving slipping and sliding of the C-S-H sheets are operative when cement paste is under sustained load.
9. The value of the high frequency arc depression angle parameter (with time) appears to reflect the relative amount of creep that occurs. Low values of creep for the untreated specimens may be related to the low values of the depression angle parameter.
10. The linear character of the log specific strain versus log time relation for cement paste subjected to a sustained load suggests that the rate determining mechanism may be associated with slipping and sliding of the C-S-H sheets.
REFERENCES
[1] Yunping X. and Jennings H. M., ‘Relationships Between Microstructure and Creep and Shrinkage of Cement Paste’, Materials Science of Concrete III, The American Ceramic Society, 1992, pp. 37-63.
[2] Young J. F., ‘Assessment of the Influence of Microstructure on Time Dependent Deformation of Hardened Cement Paste’, First Australian Conference on Engineering Materials, Sidney, 1974, pp. 3-28.
[3] Neville A. M. , Dilger W. H. and Brooks J. J., ‘Creep of plain and structural concrete’ Construction Press- Longman, London, New York, 1983, 438 p.
[4] Mullen W. G., W. L. Dolch W. L., ‘Creep of Portland Cement Paste’, Proceedings of the American Society of Testing Materials, 64 (1964) 1146-1171.
[5] Wittmann F. H., ‘Influence of Moisture Content on the Creep of Hardened Cement’, Reol. Acta., 9 (2) (1970) 282- 287.
[6] Ramachandran V. S., Feldman R. F. and Beaudoin J. J., Concrete Science, Heyden & son, 1981, p. 427. [7] Powers T. C., ‘Mechanisms of Shrinkage and Reversible Creep of Hardened Cement Paste’, Int. Conf. on Structure of Concrete, Cement and Concrete Assoc., London, England, 1968, pp. 319-344.
[8] Feldman R.F., ‘Mechanism of Creep of Hardened Portland Cement Paste’, Cem. Conc. Res., 2 (5) (1972) 509- 520.
[9] Gu P., Xie P., Y. Fu and J. J. Beaudoin, ‘Microstructural Characterization of Cementitious materials: Conductivity and Impedance Methods’, Materials Science of Concrete IV, The American Ceramic Society, 1995, pp. 201-262. [10]Gu P., Xie P., Y. Fu and J. J. Beaudoin, ‘A.C. Impedance Phenomena in hydrating cement systems: Origin of the high frequency arc’, Cem. Concr. Res., 24 (2)(1994) 704-706.
[11]Von Schwiedler E., ‘Studies on the Anomalous Behaviour of Dielectrics’, Annalen Der Physik, 24 (1907) 711-770.
[12]Jonscher A. K., ‘Physical Basis of Dielectric Loss’, Nature, 253 (717) 1975, 256 (566) 1975. [13]Macdonald J. R., Impedance Spectroscopy, John Wiley, New York, 1987.
[14]Mc N. Alford N. and Double D. D. in Adsorption at the Gas-solid and Liquid-solid Interface, Studies in Surface Science and Catalysis 10, Ed. By J. Rouquerol and K. S. W. Sing, Elsevier Amsterdam (1982) 259-266.
[15]Dalgliesh B. J., Pratt P. L. and Toulson E., ‘Fractographic Studies of Microstructural Development in Hydrated Portland Cement’, Journal of Mater. Sci. 17 (1982) 2199.
[16]McCarter W. J. and Afshar A. B., ‘Monitoring the early hydration mechanics of hydraulic cement’ Journal of Mater. Sci. 23 (2)(1988) 488-496.
[17]Tashira C. and Shimamura H., ‘Dependence of the Electrical Resistivity on Evaporable Water Content in Hardened Cement Pastes’, Mater. Sci. Lett. 6 (1987) 1379.
[18]Brantervik K. and Niklasson G. A., ‘Circuit Models for Cement Based Materials Obtained from Impedance Spectroscopy’, Cem. Concr. Res., 4 (21) (1991) 496-508.
[19]Christensen B. J., Mason T. O. and Jennings H. M., ‘Experimental and Computer Simulation Results for the Electrical Conductivity of Portland Cement Paste’, Mat. Res. Soc. Symp. Proc., (245) (1992) 259-264. [20]McCarter W. J. and Garvin S., ‘Dependence of Electrical Impedance of Cement Based Materials on Their Moisture Condition’, Journal of Physics. D. Applied Physics, 22 (11) (1989) 1773-1776.
[21]Xu Z., Gu P., Xie P. and Beaudoin J. J., ‘Application of A.C. Impedance Techniques in Studies of Porous Cementitious Materials (II). Relationship Between ACIS Behavior and the Porous Microstructure’, Cem. Concr. Res., 25 (4)(1993)853-862.
[22]Gu P., Xu Z., Xie P. and Beaudoin J. J., ‘Application of A.C. Impedance Techniques in Studies of Porous Cementitious Materials (I). Influence of Solid Phase and Pore Solution on High Frequency Resistance’, Cem. Concr. Res., 23 (3)(1993)531-540.
[23]McCarter W. J. and Curran P. N., ‘The Electrical Response Characteristics of Setting Cement Paste’, Mag. Concr. Res., 36 (126) (1984) 42-49.
[24]McCarter W. J., Garvin S. and Bouzid N., ‘Impedance Measurement on Cement Paste’, Journal of Mater. Sci. 7 (10) (1988) 1056-1057.
[25]MacDonald J.R. and Johnson W. B., Chapter One, ‘Fundamentals of Impedance Spectroscopy’, in Impedance Spectroscopy, Edited by J. Ross MacDonald, John Wiley & Sons, New York, 1987, p. 346.
[26]Gu P., Xie P., Fu Y. and Beaudoin J. J., ‘A.C. Impedance Phenomena in hydrating cement systems: Frequency dispersion angle and pore size distribution’, Cem. Concr. Res., 24 (1) (1994) 86-88.
[27]Beaudoin J. J., Gu P., Tumidajski P. J. and Perron S., ‘Microstructural Changes on Drying and Rewetting of Hydrated Cement Paste - An A. C. Impedance Spectroscope study’, Proc. RILEM Conference: Concrete from Materials to Structure, Aries, France, 1998, pp. 32-42.
[28]Feldman R. F., ‘Assessment of Experimental Evidence for Models of Hydrated Portland Cement’, High. Res. Record, 370 (1971) 8-24.
[29]Copeland L. E. and Hayes J. C., ‘Determination of Non-Evaporable Water in Hardened Portland Cement Paste’, ASTM Bulletin, (1953) 70-74.
[30]Feldman R. F., ‘Application of the Helium Inflow Technique For Measuring Surface Area and Hydraulic Radius of Hydrated Portland Cement’, Cem. Concr. Res., 10 (1980) 657-664.
[31]Feldman R.F., ‘Sorption and Length-Change Scanning Isotherms of Methanol and Water on Hydrated Portland Cement’, Proc. Fifth Int. Symp. Chem. Cem., Tokyo, 1968, Part III, Vol. Ill, pp.53-66.
[32]Brunauer S, Kantro D. L., Copeland L. E., ‘The Stoichiometry of the Hydration of P-Dicalcium Silicate and Tricalcium Silicate at Room Temperature’, J. Amer. Chem. Soc., 80 (1958) 761-767.
[33]Litvan G. G., ‘Variability of the Nitrogen Surface Area of Hydrated Cement Paste’, Cem. Concr. Res., 6 (1976) 139-144.
[34]Parrott L. J., ‘Thermogravimetric and Sorption Studies of Methanol Exchange in an Alite Paste’, Cem. Conc. Res., 13 (1983) 18-22.
[35]Beaudoin J. J., ‘Validity of using methanol for studying the micro structure of cement paste’, Materials and structures, 20 (115) (1987) 27-31.
[36]Powers T. C., Copeland L. E., Hayes J. C. and Mann H. M., ‘Permeability of Portland Cement Paste’, J. Amer. Concr. Inst., (26) (1954) 285-296.
[37]Parrott L. J., ‘Effect of Drying History Upon the Exchange of Pore Water with Methanol and Upon Subsequent Methanol Sorption Behavior in Hydrated Alite Paste’, Cem. Concr. Res., 11 (1981) 651-658.
[38]Tamtsia T. B. and J. J. Beaudoin, ‘Basic Creep of Hardened Cement Paste: A Re-examination of the Role of Water’, Cem. Concr. Res., 30 (1) (2000) 1465-1475.
[39]Sluyters-Rehbach M. and Sluyters J. H., ‘Electroanalytical Chemistry’, 4, Edit. A. J. Bard, Marcel Dekker, New York, 1990, pp. 1-125.
[40]Cole K. S. and Cole R. H., ‘Dispersion and Absorption in Dielectrics I. Alternating Current Characteristics’, J. Chem. Phys., 9 (1941) 341-351.
[41]Scuderi C. A., Mason T. O. and Jennings H. M., ‘Impedance Spectra of Hydrating Cement Pastes’, Journal of Mater. Sci., 26 (1991) 349-353.
[42]Bonanos N., Steele B. C. H., Butler E. P., Johnson W. B., Worrell W. L., MacDonald D. D. and McKubre M. C. H., Chapter 4 in Application of Impedance Spectroscopy, Edited by J. R. McDonald, Wiley & Sons, NY, 1987. [43]Sereda P. J. and Swenson E. G., ‘Apparatus for preparing Portland cement paste of high water cement ratio’, Materials Research and Standards, 7 (4) (1967) 152.
[44]Feldman R. F. and Ramachandran V. S., ‘Differentiation of Interlayer and Adsorbed Water in Hydrated Portland Cement by Thermal Analysis’, Cem. Concr. Res., 1 (6) (1971) 607-620.
[45]Gu P., Xie P. and Beaudoin J. J., ‘Impedance characterization of microcracking behavior in fiber-reinforced cement composites’, Cement and Concrete Composites, 15 (3) (1993) 173-180.
[46]Mulder W. H. and Sluyters J. H., ‘An Explanation of Depressed Semi-circular Arcs in Impedance Plots for Irreversible Electrode Reactions’, Electrochemica Acta, 33 (3) (1988) 303-309.
[47]Pajkassy T. and Nyikos L., ‘Impedance of Fractal Blocking Electrodes’, J. Electrochem. Soc: Electrochemical Science and Technology, 133 (10) (1986) 2061-64.
[48]Brug G. J., Van den Elden A. L. G., Sluyters-Rehbach M. and Sluyters J. H., ‘The Analysis of Electrode Impedances Complicated by the presence of a Constant Phase Element’, J. Electroanal. Chem., 176 (1984) 275- 295.
[49]Ulm F. J., Le Maou F. and Boulay C., ‘Creep and Shrinkage Coupling: New Review of Some Evidence’, Revue Francaise de Génie Civil, 3(3-4) (1999) 21-37