Publisher’s version / Version de l'éditeur:
Conference on Computer Vision and Pattern Recognition Workshop, 2003.
CVPRW '03., p. 11, 2003
READ THESE TERMS AND CONDITIONS CAREFULLY BEFORE USING THIS WEBSITE. https://nrc-publications.canada.ca/eng/copyright
Vous avez des questions? Nous pouvons vous aider. Pour communiquer directement avec un auteur, consultez la première page de la revue dans laquelle son article a été publié afin de trouver ses coordonnées. Si vous n’arrivez pas à les repérer, communiquez avec nous à [email protected].
Questions? Contact the NRC Publications Archive team at
[email protected]. If you wish to email the authors directly, please see the first page of the publication for their contact information.
NRC Publications Archive
Archives des publications du CNRC
This publication could be one of several versions: author’s original, accepted manuscript or the publisher’s version. / La version de cette publication peut être l’une des suivantes : la version prépublication de l’auteur, la version acceptée du manuscrit ou la version de l’éditeur.
For the publisher’s version, please access the DOI link below./ Pour consulter la version de l’éditeur, utilisez le lien DOI ci-dessous.
https://doi.org/10.1109/CVPRW.2003.10002
Access and use of this website and the material on it are subject to the Terms and Conditions set forth at
Laser Range Imaging in Archaeology: Issue and Results
Godin, Guy; Blais, François; Cournoyer, Luc; Beraldin, Jean-Angelo; Domey,
Jacques; Taylor, John; Rioux, Marc; El-Hakim, Sabry
https://publications-cnrc.canada.ca/fra/droits
L’accès à ce site Web et l’utilisation de son contenu sont assujettis aux conditions présentées dans le site LISEZ CES CONDITIONS ATTENTIVEMENT AVANT D’UTILISER CE SITE WEB.
NRC Publications Record / Notice d'Archives des publications de CNRC:
https://nrc-publications.canada.ca/eng/view/object/?id=7ab98190-db02-4ba3-9cc1-61387d6b441d https://publications-cnrc.canada.ca/fra/voir/objet/?id=7ab98190-db02-4ba3-9cc1-61387d6b441d
National Research Council Canada Institute for Information Technology Conseil national de recherches Canada Institut de technologie de l’information
Laser Range Imaging in Archaeology:
Issue and Results *
Godin, G., Blais, F., Cournoyer, L., Beraldin, J.-A., Domey, J., Taylor, J.,
Rioux, M., El-Hakim, S.
July 2003
* published in IEEE/CVPR Workshop on Applications of Computer Vision to Archaeology (ACVA'03) Madison, Wisconsin. July 17, 2003. NRC 45818.
Copyright 2003 by
National Research Council of Canada
Permission is granted to quote short excerpts and to reproduce figures and tables from this report, provided that the source of such material is fully acknowledged.
Laser range imaging in archaeology: issues and results
Guy Godin
Franc¸ois Blais
Luc Cournoyer
J.-Angelo Beraldin
Jacques Domey
John Taylor
Marc Rioux
Sabry El-Hakim
Visual Information Technology Group
National Research Council of Canada
Ottawa, Ontario, Canada
Abstract
Archaeology is emerging as one of the key areas of applica-tions for laser range imaging. This particular context im-poses a number of specific constraints on the design and operations of range sensors. In this paper, we discuss some of the issues in designing and using laser range sensor sys-tems for archaeology. Results obtained on remote archae-ological sites will serve to illustrate these considerations.
1. Introduction
Archaeology is rapidly becoming one of the main areas of applications for range imaging. Explicit geometric mea-surements available through a reliable acquisition process complements the recording techniques already in use in this field. Furthermore, since range imaging provides dense sur-face measurement, it can quickly record a large amount of detailed information on complex shapes. The 3D models built from these measurements become another tool for on-or off-site documentation, as well as the basis fon-or analysis and study of the findings. Virtual versions of the artefacts can be rapidly disseminated to distributed research groups, as soon as they are excavated and digitized. Range imag-ing is at the heart of a number of recent projects related to archaeology and cultural heritage (e.g. [1, 3, 7, 10]).
By nature, archaeological artefacts tend to span a wide spectrum of materials, scale, and shape complexity. The documentation needs are likely to vary accordingly. If the imaging of the artefacts is to occur on site, then a number of additional constraints are imposed on the design of the systems as well as on the imaging and processing strategies. This paper will illustrate and discuss some of our ex-periences in the use of laser range imaging in the specific context of archaeology. Results obtained on sites and in the laboratory are shown. Issues related to the design of range sensors, to their deployment, and to the applications of the data will also be discussed.
2. Range imaging
Active optical range imaging relies fundamentally on projecting light on the scene in a controlled manner, and on measuring one property of the reflected light. In the case of outdoors archaeological site work, the presence of intense sunlight is an issue, and requires high-intensity light pro-jection in order to achieve a sufficient signal-to-background ratio. Range sensors project either a laser (beam or plane) or structured incoherent light patterns. Outdoors operation fa-vors the use of laser-based techniques over incoherent light ones, since the challenge is signal detection under high am-bient illumination.
Two basic principles are used in range imaging, triangu-lation and time-of-flight [4, 6]. Triangutriangu-lation systems tend to be less costly, and provide significantly higher accuracy for smaller volumes (up to several meters). However they cannot be easily scaled up to handle long distance measure-ments. On the other hand, time-of-flight systems can reach hundreds of meters, with a quasi-constant resolution, and are the preferred technique for measuring an entire site at once.
Laser triangulation systems project a beam or a plane of light on the scene. Coverage of a surface is achieved by optical deflection with precisely controlled mirrors, or by mechanical displacement of the sensor system. If a beam is projected, then two degrees of freedom are required.
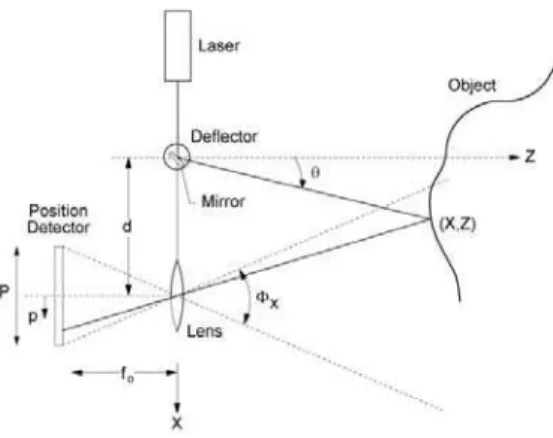
The basic geometrical principle of optical triangulation is shown in Fig. 1. Knowing two angles of a triangle relative to its base (baselined) uniquely determines the triangle, and thus the relative position of its apex, here the illuminated point on the surface. One of the angles is known by control of the laser deflection device, the other angle is measured indirectly from the position of the imaged spot on a photo-sensor. A profile in(x, z) is obtained by scanning the spot, or by translating the entire device.
The coordinates (x, z) of the illuminated point on the object (Fig. 1) are given by:
z = d fo p + fo tan θ
Figure 1. Optical triangulation
wherep is the position of the imaged spot on the position detector, θ is the deflection angle of the laser beam, d is the known separation between the lens and the laser source (called the sensor baseline), andfois the effective distance between the position detector and the lens. Approximating σz, the standard deviation of the error inz, as a function of p only, the law of propagation of errors yields
σz≈ z2 d fo
σp (2)
where σp is the standard deviation of the error in p. The measurement uncertainty inz is therefore inversely propor-tional to both the baseline and the effective focal length of the lens, but directly proportional to the square of the dis-tance z. In practice, fo andd cannot be made arbitrarily large. The baselined is limited mainly by the mechanical structure of the optical set-up and by the increased presence of shadows (points that are occluded from illumination or observation) asd is enlarged. Lengthening foreduces the measurement field of view of the system.
An important feature of any triangulation-based system is that the noise varies withz2. The width of the field of view, and thus the lateral sampling density, varies linearly withz, since scanners usually apply a constant angular sam-pling density on the projection.
3. Resolution and depth of field
If the 3D imaging is to be performed during the excava-tion, it is not always possible to predict in advance the range of artefact sizes that will be encountered and digitized. Even if the artefacts to be imaged are known, they may very well span a variety of sizes and resolution requirements. Range sensors, specifically triangulation-based ones, are by nature designed for a specific volume of measurement. If an arte-fact exceeds the volume of the sensor, it is always possible to successively scan areas of the surface, and then assemble
them into a model using registration and integration algo-rithms (e.g. [11]). In fact, such a multiple-view integration approach is required to build complete models of objects even if they fit with the measurement volume. However, it imposes additional time and effort. Some situations may not require a complete all-around model, and thus obtaining all the information in a single view, or in as few as possible, is a significant practical advantage.
One solution to the fixed volume constraint would be to have a family of sensor heads designed for different vol-umes. This approach, akin to a photographer carrying a number of fixed lenses, while seemingly prohibitive now, may prove more feasible as the cost of integrated opto-electronics goes down. A zoomable and field reconfigurable sensor, while technically feasible, poses serious challenges, in particular with regard to calibration, if the goal is high-quality geometric measurements.
Another approach is to use to one’s advantage the vari-ation withz2of accuracy in triangulation and the perspec-tive imaging geometry of angular scanning. This means that range images taken at a shorter distance from the sensor ex-hibit not only a denser lateral sampling, but also a higher depth accuracy. Thus, if properly designed, the same unit can be used for smaller object work as well as longer range measurements, albeit with different performances.
One such sensor was used in an imaging mission to test and demonstrate its performance for on-site archaeological work. The same system was used to image stone artefacts, mosaics and marble floors, up to a 2-metre tomb carved in rock (details of each case will be discussed in Section 6). This system can measure surfaces from a standoff distance ranging from 0.5m to 10m, with a baseline of only 150mm. The light source is a solid-state infrared (λ = 820nm) laser diode, with typical 1-σ accuracies varying from 0.1mm at 0.5m, to 0.5mm at 1.5m, and up to 5mm at 10m. It should be noted that the values do not vary exactly as z2, since sources of error other than peak positions affect the imaging process. Immunity to solar illumination is provided by a bandpass optical filtering around the laser wavelength, but also by a non-linear peak position detection method [2].
4. Biris
The Biris range sensor was developed to work in dif-ficult environments where reliability, robustness, compact-ness and ease of maintenance are as important as the accu-racy. Archaeological site work imposes such requirements. The main components are a standard CCD camera, a cam-era lens, and a mask with two apertures. A laser line is pro-jected on the scene; a double image of the laser line is mea-sured on the CCD camera (Fig. 2). The Biris range sensor is in fact a combination of optical triangulation and of a focus-based method. For each imaged point, the two-aperture
mask produces two distinct pointsp1 andp2that are mea-sured on the CCD. Range is obtained by either measuring the average position of the two laser spot images (triangula-tion) or the separation of the peaks (focus). In practice, the two measurements are weighted to obtain minimum vari-ance on1/z [5].
Figure 2. The Biris principle.
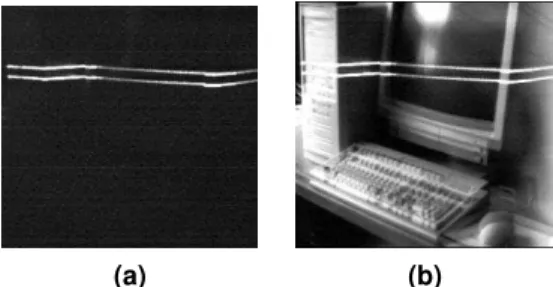
The combination of the triangulation and double mask techniques makes the Biris principle very tolerant to mul-tiple reflections or ambient light illumination, in particular sunlight. Indeed, a bandpass optical interference filter will reduce the optical effects of the sun and ambient illumina-tion, but will not eliminate them altogether. Furthermore, multiple or indirect reflections of the laser light will not be filtered, and may cause false measurements around concav-ities or discontinuconcav-ities, if care is not taken to clearly iden-tify the proper laser line. This phenomenon is illustrated in Fig. 3 where the presence of an optical interference filter is unable to remove the sunlight shining through the window. However the double line pattern is still identifiable and is explicitly detected. Since there is only one valid combina-tion of peak posicombina-tion and spacing, the deteccombina-tion process can be made very robust.
(a) (b)
Figure 3. Effect of the Biris double mask. (a) in the dark; (b) with light from outside and a narrowband filter.
This camera configuration measures an entire profile at once. One additional degree of freedom needs to be pro-vided, by translating or rotating the plane of light. Because Biris is intrinsically a triangulation-type system, its accu-racy also behaves according to thez2law.
This technology, and its commercial derivatives, is be-ing used by several groups in heritage and archaeological
3D imaging (e.g. [7]). One of our laboratory prototypes is shown in Fig. 4, mounted on a translation rail, being used to record carved niches at the Bei Shan site near Dazu, China.
(a) (b)
Figure 4. Biris in the field. (a) mounted on a trans-lation rail; (b) image of the carved niche.
5. Surface conditions
The underlying hypothesis of all range imaging is that the surface element being measured at one given time is smooth, flat, opaque and uniformly reflective. Each mea-surement is represented as a point. In practice, the illumi-nant (spot or line) has a finite width, and the materials may be rough (at a macroscopic scale), translucent, inhomoge-neous in surface or volume, or highly specular.
In archaeology, issues of surface conditions and mate-rials may be a factor in the actual field performance. The impact of material properties has been discussed in the case of clean marble [9], where a direct correlation between the spot diameter and the noise level has been observed. Sharp transitions in surface reflection within the footprint of the illuminant induce errors in the estimation of the spot po-sition, and thus the 3D measurement. Space-time analysis [8] alleviates these measurement errors; however it has not been widely used in practice due to the high memory re-quirements.
6. Field test cases
Archaeology was seen early on as an application area that could potentially benefit from 3D imaging, but also as one that would put stringent constraints on the equipment. While this field had already developped an extensive set of documentation techniques, there was an interest in seeing how the availability of 3D data could add to these, and what types of image processing would prove useful to practition-ers. For this reason, a number of test projects were de-vised. We report here on one particular mission to Israel that is particularly relevant. It included a number of sites and artefacts, under actual field environmental conditions. A range of target applications were identified in collabora-tion with our partners from the Israel Antiquities Authority.
The imaging was performed on-site by a two-person team from our laboratory. The processing was done in part dur-ing the mission, and completed later in the laboratory. The scans took place over the course of a few days, including packing and transport.
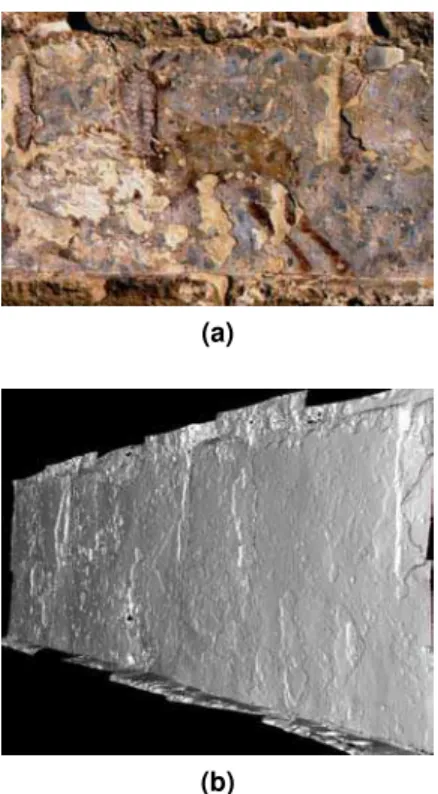
(a)
(b)
Figure 5. Frescoes at the Hippodrome in Cae-sarea. (a) photograph of a detail; (b) model from range images, the areas of loss due to surface spalling are clearly visible.
6.1. Frescoes
Frescoes are not usually thought of being within the realm of interest of 3D imaging. However, when frescoes are uncovered at an archaeological site, one of the first tasks to be accomplished is to record the condition of the surface as much as the pictorial information. One important part of the condition report is the delineation of loss areas. One usual recording technique consists in sketching the surface detail to scale and providing photographic records of the paintings. The fresco at the Hippodrome in Caesarea was scanned to evaluate how much of the condition reporting could be automated. This test was undertaken to facilitate comparison of the data recorded by the scanner with tradi-tional recording methods. The fresco was recorded using the system in direct sunlight. Images were acquired from a distance ranging from 0.75m to 1m. Approximately three square meters of wall were scanned within half a day of field work. Twelve overlapping images were acquired. One day
of image compilation time was required to produce the re-sults shown in Fig. 5. The accuracy of the 3D data is within 0.2mm, at an average lateral resolution of 0.5mm. Deteri-oration of the wall surface can be measured over time by re-scanning the same surface at a later date and registering the two scans. With a complete scan, monitoring over the entire surface, not just at the borders of loss areas, can be obtained.
6.2. Mosaics
Caesarea also contains mosaic floors of both Roman and Byzantine periods. With its small and irregular spaced tiles and patterns, mosaic flooring is often difficult and time consuming to accurately record using conventional tech-niques such as rectified photography. Three-dimensional laser imaging provides a metric representation for the com-plete mosaic surface, not just the interstices as is usually the case. This 3D representation contains information on the tile conditions that are not easily extracted from pho-tographs, even with multiple views.
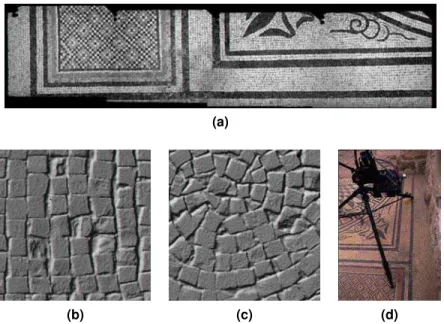
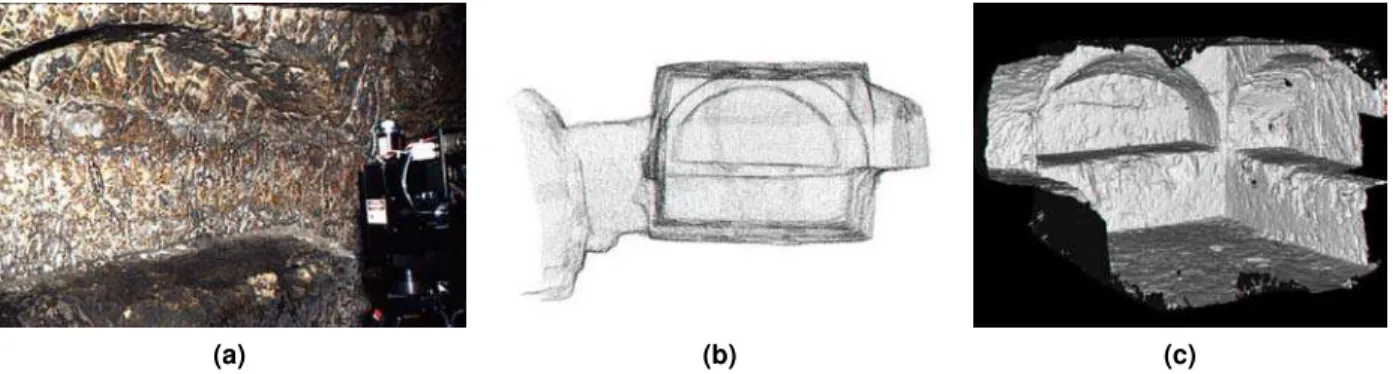
The documentation of mosaics allows the study of their design, as well as a record of their condition. Some tiles were missing, and parts of the surface of the Byzantine mo-saics were severely deformed. The exact amount of damage at a given time can be recorded for conservation purposes. The images were taken at a standoff distance of 0.75m, each image covering approximately 0.5m × 0.5m. Figure 6(a) shows four individual scans assembled into a 3D model. It is rendered with the measured infrared intensity. Detailed areas of two individual scans appear in (b) and (c), and il-lustrate the lateral resolution achieved on tiles. The sensor is shown in operation in (d) over the corresponding area of mosaic. Other portions of mosaic and marble floors were also documented during the same half-day.
6.3. Bas-relief
The Rockefeller Museum in Jerusalem houses the lin-tel of the Holy Sepulchre Church. A 1 m2 section of the lintel was scanned ”in-situ” in the display case, at a lateral resolution of 0.5 mm inx and y (Figure 7). The depth res-olution varied from 0.1 mm at a standoff distance of 0.75 m, and up to 0.2 mm at 1 m. It required approximately two hours to scan the 13 images covering the section, with additional time required for set-up. Relief surface such as this one requires additional views to access the occluded ar-eas. Approximately two days were subsequently needed to complete the modeling of the data. The objective of this scan was to prepare a high resolution 3D digital model of a section of the lintel to provide a record which can be used to fabricate a replica, to provide documentation for curatorial research and to provide information for the monitoring of future decay or deterioration.
(a)
(b) (c) (d)
Figure 6. Roman mosaics in Caesarea. (a) model assembled from 4 scans; (b),(c) details of single scans; (d) the sensor in operation.
(a) (b)
Figure 7. Holy Sepulchre Lintel at the Rockefeller Museum. (a) multiple-view model; (b) detail.
6.4. Arcosolia room
The Arcosolia Room of St. James’ Tomb in Ben`e H´ezir measures approximately 2m × 2 m × 1.8m in height. It is carved in rock and the interior surfaces are rough and irregu-lar in shape. Architectural and archaeological sites that bear surfaces of this nature are difficult to record accurately with a high level of detail using conventional techniques such as traditional surveying, rectified photography, photogramme-try, and distance meters. Traditional surveying techniques have difficulty in acquiring and representing such level of details. Here, the goal was to digitize the tomb’s entire en-velope to prepare an archival record for conservation docu-mentation. It required one half day of on-site recording time to acquire 65 images that cover the entrance tunnel, walls, floor, and ceiling.
In this case, the scanner operated on average at a
dis-tance between 1 and 1.5m from the rock surface. Angular sampling was half of what was used for the mosaics. Each 512 × 512 image has a sampling resolution of 2 mm and a depth resolution of 0.3 mm. Subsequently, about four days were required off-site to finalize a series of 3D digital mod-els at different resolutions.
The resulting digital models can be rendered in several ways to assist in the analysis and interpretation by experts. This flexibility of representation from a single source of in-formation is one of the advantages of 3D imaging as a ba-sic documentation system. In discussions with users of the data, it has proven useful to show the ability to extract, from the models, information in forms that are currently in use for documentation.
7. Operational considerations
Archaeological site work imposes severe conditions on equipment. The conditions of temperature and humidity impact on the electronics. Fine sand, salt or dust inter-feres with the mechanical components. Most of these prob-lems can be addressed to some extent by applying tradi-tional engineering solutions. Logistic issues are also con-straining: availability and stability of electrical power have posed difficulties for the operations of some equipment; the fragile nature of sites often imposes restrictions on access and available points of view for in situ imaging. Addition-ally, the imaging must not interfere with the usually tight work schedule of the archaeological team. Other 3D imag-ing projects requirimag-ing field work have also met similar
chal-(a) (b) (c)
Figure 8. Arcosolia room. (a) measuring the walls; (b) overall envelope in point cloud; (c) exploded view of the model.
lenges [1, 3, 10].
Imaging in an uncontrolled environment imposes limits to the performance of any 3D imaging equipment: inade-quate mounting, vibration, temperature fluctuations, atmo-spheric refraction and dispersion in long distance measure-ment are variables that are not encountered in a laboratory setting. Expectations on accuracy of measurement need to be scaled down accordingly. Additionally, on-site verifica-tion and monitoring of sensor performance is essential to prevent against calibration drifts that might not be recover-able afterwards.
The use of laser scanning equipment in an active ex-cavation must also follow the normal safety requirements and regulations. Since those tend to vary on a national ba-sis, working abroad with such equipment may entail some authorization procedures. Eye-safe systems, for example those operating at the 1.54µm wavelength [2], may simplify the task of deploying of sensors in active excavations.
8. Conclusion
This paper has shown a series of actual results obtained with range imaging on archaeological sites. Our goal was to illustrate what we believe is achievable on real sites, with existing technology. We are pursuing research in sensors, procedures, as well as processing techniques, in collabora-tion with praccollabora-tionners, in the hope of bridging the gap be-tween the laboratory demonstration and the regular use of these techniques in archaeology.
Acknowledgements
The authors would like to thank the Israel Antiquities Au-thority, the Canadian Foundation for the Preservation of Chinese Cultural and Historical Treasures, and Guy C ˆot´e of Innovision-3D.
References
[1] Beraldin, J.-A. et al., “Digital 3-D imaging system for rapid response on remote sites”, Proceedings of the Second Inter-national Conference on 3-D Digital Imaging and Modeling, Oct. 4-8, 1999. Ottawa, Ontario. pp. 34-43.
[2] Beraldin, J.-A. et al., “Eye-safe digital 3-D sensing for space applications”, Optical Engineering, vol. 39, no. 1, Jan. 2000. pp. 196-211.
[3] Bernardini, F. et al., “Building a Digital Model of Michelan-gelo’s Florentine Piet`a”, IEEE Computer Graphics and Appli-cations, Jan./Feb. 2002. pp. 59-67.
[4] Besl, P., “Active, Optical Range Imaging Sensors”, Machine Vision and Applications, vol. 1, no. 2, 1988. pp.127-152. [5] Blais, F. et al., “Real-time processing and validation of optical
ranging in a cluttered environment”, 7th Int. Conf. Signal Pro-cessing and Applications Technologies, Boston, Mass., Oct. 7-10, 1996. pp. 1066-1070.
[6] Blais, F., “A Review of 20 Years of Range Sensor Develop-ment.” Videometrics VII, Proceedings of SPIE-IST Electronic Imaging” , SPIE Volume 5013 (2003). pp. 62-76.
[7] Cooper, D. et al., ”Bayesian Virtual Pot-Assembly from Fragments as Problems in Perceptual-Grouping and Geometric-Learning”, Proc. Int. Conf. on Pattern Recogni-tion (ICPR’02), vol. III, Quebec City, Canada, Aug. 11-15, 2002. pp. 297-302
[8] Curless, B., Levoy, M., “Better optical triangulation through space-time analysis”, Proc. Fifth Int .Conf. Computer Vision, Cambridge, Mass., June 23-25, 1995. pp. 987-994.
[9] Godin, G. et al., “An assessment of laser range measurement on marble surfaces”, 5th Conference on Optical 3D Measure-ment Techniques, Oct. 1-4, 2001, Vienna, Austria. pp. 49-56. [10] Levoy, M. et al., “The Digital Michelangelo Project: 3D Scanning of Large Statutes”, Proc. SIGGRAPH 2000, ACM Press, New York. pp.131-144.
[11] Soucy, M. et al., “Sensors and Algorithms for the Construc-tion of Digital 3D Color Models of Real Objects”, Proc. IEEE Conf. Image Processing, vol. II, Lausanne, Switzerland, Sept. 16-19, 1996. pp. 409-412.