HAL Id: hal-00662707
https://hal.archives-ouvertes.fr/hal-00662707
Submitted on 24 Jan 2012
HAL is a multi-disciplinary open access
archive for the deposit and dissemination of
sci-entific research documents, whether they are
pub-lished or not. The documents may come from
teaching and research institutions in France or
abroad, or from public or private research centers.
L’archive ouverte pluridisciplinaire HAL, est
destinée au dépôt et à la diffusion de documents
scientifiques de niveau recherche, publiés ou non,
émanant des établissements d’enseignement et de
recherche français ou étrangers, des laboratoires
publics ou privés.
General architecture of a genetic regulatory network.
Applications to embryologic control
Jacques Demongeot, Alexandra Henrion-Caude, Athanasios Lontos,
Emmanuel Promayon
To cite this version:
Jacques Demongeot, Alexandra Henrion-Caude, Athanasios Lontos, Emmanuel Promayon. General
architecture of a genetic regulatory network. Applications to embryologic control. ECAL 2011,
Eleventh European Conference on the Synthesis and Simulation of Living Systems, Aug 2011, Paris,
France. pp.1-8. �hal-00662707�
General architecture of a genetic regulatory network. Applications to embryologic
control
Jacques Demongeot
1, Alexandra Henrion-Caude
2, Athanase Lontos
3, Emmanuel Promayon
31Université J. Fourier Grenoble 1, AGIM, CNRS FRE 3405, 38706 La Tronche, France
2Université Paris Descartes, INSERM U 781, Hôpital Necker – Enfants Malades, 149 rue de Sèvres, 75015 Paris, France 3Université J. Fourier Grenoble 1, TIMC-IMAG, CNRS UMR 5525, 38706 La Tronche, France
Abstract
The general architecture of a genetic regulatory network consists of strong connected components of its interaction graph, to which are attached three kinds of sub-structures: - a set of up-trees, rooted in the sources of the interaction graph, represented either by small RNAs like microRNAs: nuclear miRs or mitochondrial mitomiRs, i.e., translational inhibitors respectively of the messenger mRNAs and of the transfer tRNAs, or by gene repressors and/or inductors, - a set of circuits in the core (in graph sense) of the strong connected components of the interaction graph,
- a set of down-trees going to the sinks of the interaction graph, i.e., to genes controlled, but not controlling any other gene.
The various state configurations it is possible to observe in the above sub-structures correspond to different dynamical asymptotic behaviors. The network dynamics have in general a small number of attractors, corresponding in the Delbrück’s paradigm to the functions of the tissue they represent. Examples of such dynamics will be given in embryology: cell proliferation control network in mammals and gastrulation control network in Drosophila melanogaster.
Introduction
Genetic networks can be considered as the analogues of neural networks for controlling the expression of genes. Their time constants are different (e.g., the rhythms of protein expression are of the order of magnitude of some minutes and those of neural firing are of some milliseconds) but their connectivity is about the same (in-degree between 1.5 and 3, i.e., the mean number of the genes or neutrons influencing positively or negatively other ones is between 1.5 and 3) as well as the number of their strong connected components (rarely more than 2 for the control of a dedicated function). For these reasons, many common mathematical features have been adopted by the modelers in charge of designing the interaction graph of such networks: i) Boolean representation of the state space (1 if the gene is expressed, 0 if not), ii) Hopfield-like transition function (Demongeot and Sené, 2008d; Demongeot et al., 2008c, 2009b, 2011b, in press) and iii) extraction of the same features, like entropy and motifs (Demongeot et al., 2010). We will use in this paper this common theoretical framework in order to interpret examples of the genetic network dynamics.
Generalities about the architecture of the
interaction graph of a genetic network
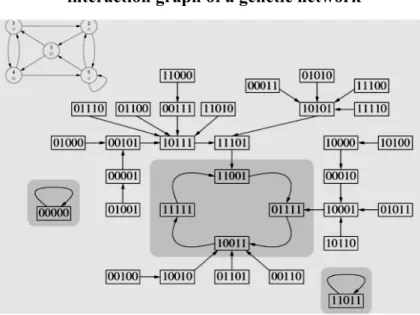
Figure 1: The interaction graph (top left) and the trajectory graph of a Boolean genetic regulatory network
The architecture of a genetic network can be decomposed into 3 directed graphs: i) the interaction graph with positive (resp. negative) arrows for induction (resp. repression), ii) the trajectory graph made of the consecutive states from an initial state until an asymptotic behavior (fixed state or limit-cycle of periodic states) and iii) the updating graph with an arrow between two genes if the target gene is updated after the source one. The knowledge about the first graph is given by DNA-protein interactions, about the second by DNA array devices recording gene expression and about the third by the chromatin clock. This architecture shows in Figures 2 and 3 some common features: i) a set of up-trees, issued from the sources of the interaction graph of the network, made either of small RNAs like siRNAs or microRNAs (nuclear miRs or mitochondrial mitomiRs, respectively translational inhibitors of the messenger mRNAs and of the transfer tRNAs), or of gene repressors and/or inductors, self-expressed without any
other gene controlling them, ii) a set of circuits in the core (in the graph sense) of the strong connected components of the interaction graph. These circuits are unique or multiple, disjoint or intersected, reduced to one gene or made of several ones, negative (having an odd number of negative interactions) or positive, and iii) a set of down-trees going to the sinks of the interaction graph.
By identifying each function of a regulatory network to one of the attractor of its dynamics as suggested by Delbrück (Demongeot, 1998), it is possible to count the number of the attractors provided by isolated circuits, and the number – largely reduced – brought by tangential or intersected circuits (Demongeot et al., 2009b, 2011a, 2011b, in press), depending on the updating mode fixed by the chromatin dynamics.
The control of the genetic networks by
microRNAs (miRs). Example of mitomiRs
Since a decade, numerous small RNAs issued from the non coding part of plant and animal genomes (like silencing siRNAs and microRNAs or miRs) have been found as inhibiting the translation by hydridizing the mRNAs with the help of RNA-binding oligo-peptides. This inhibition is partly aspecific because of the large number of possible mRNA targets for each small RNA. On Figure 2, the dynamics of a circuit of size 3 (3-circuit) is analyzed, when one gene of the 3-circuit is inhibited by a miR. If the inhibition is associated to another inhibition of this gene or if it is sufficiently strong, it is able to transform a limit-cycle behavior in a fixed configuration, the circuit being either negative or positive (Figure 2 top left and top middle). When the miR inhibition is less than the activation on the target gene, then the periodic behavior is conserved (Figure 2 top right). We can say that the inhibitory influence by the small RNAs is exerted only on sufficiently “weak” circuits, like on the carved (weak) zones of an etching on which only the nitric acid can carve.
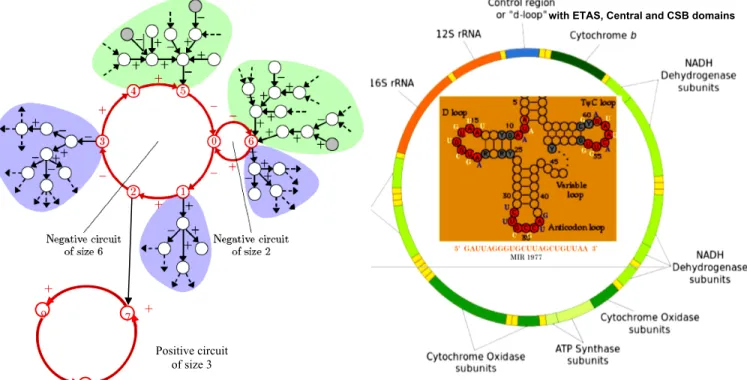
Recently some nuclear miRs like miR-1977 (Figure 3) have been discovered whose targets are mitochondrial mRNAs coding for enzymes of the oxidative phosphorylation (Bandiera et al., 2011). Such miRs have been called mitomiRs (Dass et al., 2010). This discovery invited to examine if there exist parts of the non-coding mitochondrial DNA (called the d-loop, cf. Figure 3) susceptible to code for hybridizing RNAs blocking the free parts (the loops) of the mitochondrial tRNAs: the corresponding inhibition would be totally aspecific and exerted in situ without nuclear control in order to slow oxidative phosphorylation in absence of a strong energetic need. This effect could be useful for ruling the balance Pasteur/Warburg effect versus OxPhos effect, allowing to avoid both cancers in case of Pasteur/Warburg dominance and degenerative diseases in case of oxidative phosphorylation dominance (Demetrius et al., 2010; Israel and Schwartz, 2011).
Several sequences corresponding to the tRNA loops – essentially the tRNA D-loop, but also Anticodon-loop and TψC-loop have been found both in nuclear and in mitochondrial miRs. We will take in the following as reference the Lewin’s tRNA given in (Krebs et al., 2009): it
has been proved that the loops sequence in this reference tRNA was the closest among all known tRNAs to an Archetypal Basic RNA sequence of 22 bases (called RNA AB) verifying the following variational min-max principle: - to be as short as possible,
- to present one and only one triplet corresponding to each amino-acid, in order to serve as “matrimonial agency” favouring the vicinity of any couple of amino-acids, close to RNA AB, and able to form strong peptide bonds (i.e., covalent chemical bonds formed by two amino-acids, when the carboxyl group of one reacts with the amine group of the other) between them, in order to initiate the peptide building as an ancestral tRNA, well conserved for example in the present Gly-tRNA of Œnothera lamarckiana.
For satisfying the constraints above, the RNA AB must be circular and contain at least 20 triplets. The minimal solution is given in (Demongeot and Besson, 1983; Demongeot and Moreira 2007; Demongeot et al. 2006, 2008a, 2009a, 2009c). The corresponding RNA AB sequence can be given in circular or hair-pin form and could be considered as the ancestor of the present tRNA loops. We will indicate in the following in blue the possible hybridization sites, by using the complementary pairing A-U, C-G and G-U:
1) for the nuclear mitomiRs, we have a pairing with: - the D-loop and TψC-loop (13/22) (Bandiera et al., 2011)
5’ UAAAUGGUACUGCCAUUCAAGA 3’ AB
3’ AAUUGUCGAUUCGUGGGAUUAG 5’ miR 1977
- the Anticodon-loop (12/22) (Bandiera et al., 2011)
5’ UUCAAGAUAAAUGGUACUGCCA 3’ AB
3’ AUAAGAGCGUGCCUGAUGUUGGU 5’ miR 1974
- the TψC-loop (12/22) (Bandiera et al., 2011)
5’ GAUAAAUGGUACUGCCAUUCAA 3’ AB
3’ AUCUUUCCGAUCCUGGUUUGG 5’ miR 1978
2) for the mitochondrial mitomiRs, we have a pairing with: -‐ the D-loop (Cui et al., 2007)
the sequence AAUGGUA is found in many species in the CSB part of the mitochondrial d-loop (Figure 3)
- the TψC-loop (Sbisa et al., 1997)
the sequence GUACAUU is found in many species in the ETAS part of the mitochondrial d-loop (Figure 3)
Each pairing described above corresponds to a probability less than 10-4 to occur (Demongeot and Moreira, 2007) and
could correspond to the relics of an ancient protein building mechanism without ribosomes, in which the amino-acids were directly linked to RNA chains or cycles playing the role of matrimonial agency, i.e., facilitating the grouping of amino-acids, hence favoring the constitution of peptidic bonds between them (for other hypotheses concerning the catalysis of peptidic synthesis, see (Huber and Wächtershäuser, 1998; Hsiao et al., 2009)). When tRNA loops are hybridized by nuclear or mitochondrial mitomiRs, efficacy and specificity of the complex made of amino-acid, tRNA and amino-acyl-synthetase (enzyme esterifying an amino-acid for complexing it to a specific tRNA) can be affected, causing an inhibition of the translation mechanism.
Figure 2: Top) Architecture of 3-circuits controlled by a miR, with negative (left) and positive (middle and right) circuits. Middle) Periodic dynamics when the miR is not expressed (miR=0). Bottom) Fixed configuration if the miR is expressed (miR=1), except if the miR inhibition is less than the gene activation (in parentheses), case in which the periodic behavior is conserved.
Figure 3: Left) General architecture of a genetic network with 2 circuit layers (red), 2 up-trees (green) and 3 down-trees (violet). Right) the circular mitochondrial DNA with its non-coding part (d-loop blue) and inside a tRNA structure hybridized by miR 1977.
7 8 9 + + + Positive circuit of size 3
Genetic network ruling the cell-cycle
The genetic network ruling the cell-cycle in mammals, centered on the gene E2F, is crucial for cells because of its links with Engrailed network controlling: i) through gene Elk
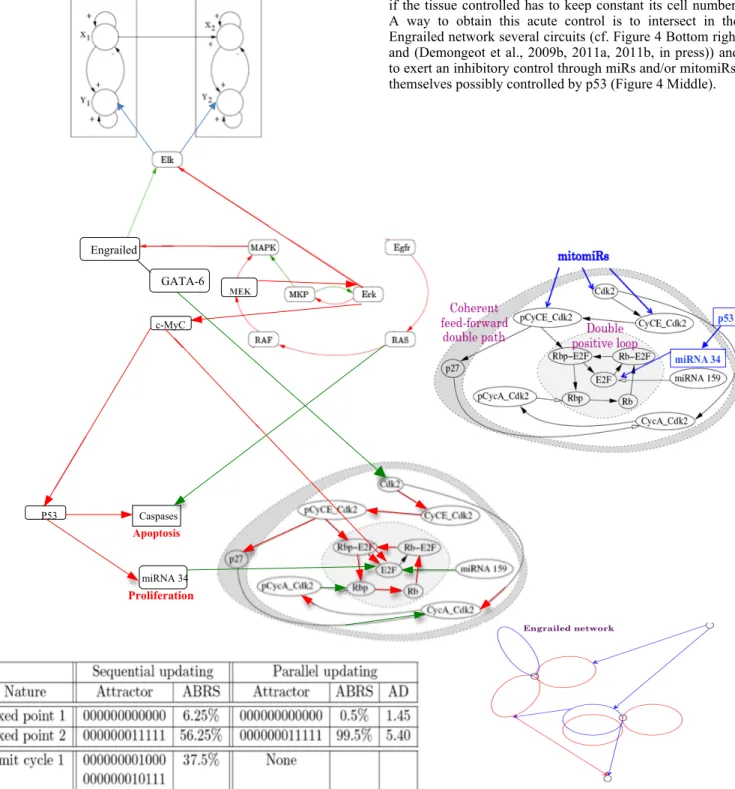
the potassium channels in hippocampus neurons ruling the memory (Top of the Figure 4) and ii) through genes Engrailed/GATA-6, c-Myc and RAS, in a double incoherent control pathway (with both positive and negative arrows, respectively in red and green in Figure 4), the apoptosis and proliferation processes. This last control must be very precise if the tissue controlled has to keep constant its cell number. A way to obtain this acute control is to intersect in the Engrailed network several circuits (cf. Figure 4 Bottom right and (Demongeot et al., 2009b, 2011a, 2011b, in press)) and to exert an inhibitory control through miRs and/or mitomiRs, themselves possibly controlled by p53 (Figure 4 Middle).
Figure 4: Middle right) Cell cycle controlling genetic network centered in mammals on the E2F box inhibited by small RNAs (miRs or nuclear and/or mitochondrial mitomiRs). Top left) Engrailed network controlling the potassium channels of hippocampus neural networks. Middle left) Engrailed network controlling both apoptosis and proliferation processes. Bottom left) Attractors of the dynamics specific to the E2F box. Bottom right) General structure of the Engrailed network.
c-MyC P53 Caspases miRNA 34 Apoptosis Proliferation Engrailed GATA-6 MEK
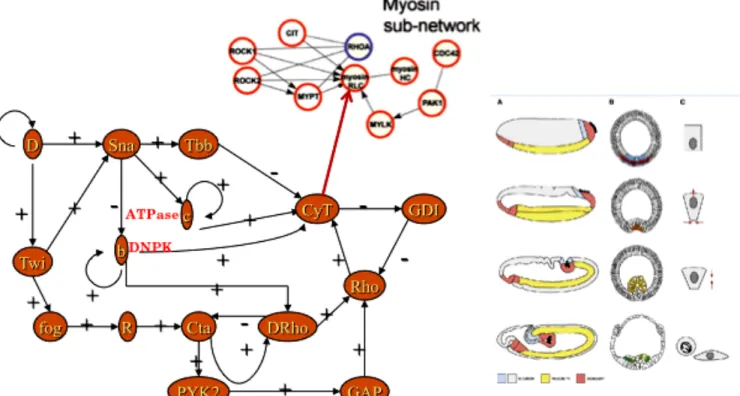
Figure 5: Bottom left) Gastrulation controlling genetic network from (Leptin, 1999) with addition of 2 ATP and GTP controlling enzymes b and c. Top middle) Myosin controlling subnetwork. Bottom right) The 4 differentiated cells needed for building the future digestive tube.
A triple action (accelerate, stop and slow down the cell cycle) on proliferation process is exerted negatively by the gene GATA-6 which is inhibited 1 time out of 2 by MAPK, and successively positively and negatively by the gene c-MyC which is activated 1 time out of 2 by Erk. The limit cycle of order 4 brought by the negative circuit of size 2 (MKP/Erk) leads genes MKP, Erk, MAPK, Engrailed, GATA-6, c-MyC, p53, miRNA34, Cdk2, E2F and caspases to the limit-cycle: 01100001001, 11110100001, 10011110000, 00000011011. Then the second fixed point of the E2F box is reached 1 time out of 4 and the caspases/apoptose box is activated 1 time out of 2: this result allows the exponential growth of the cell number to be compensated in a tissue by the linear growth of the apoptosis, 2 daughter cells replacing 2 dead cells during one period of the limit cycle, hence ensuring the conservation of the tissue volume and tissue function, any disequilibrium of the balance giving either a tumor growth or tissue rarefaction.
Genetic network ruling the gastrulation
The gastrulation is a dynamical process occurring at the end of the blastula phase. It is an early embryonic stage, including mass movement of cells to form complex structures from a simple starting form. Experiments in vivo have shown that there are many types of mass cell movement taking place during gastrulation: ingression, invagination, involution, epiboly, intercalation and convergent extension. In the next Section, we will focus on the simulation of the phenomenon of invagination of cells, which leads to the creation of the ventral furrow. In order to control the gastrulation process, a genetic regulatory network has been proposed in (Leptin, 1999). This network has been improved by adding 2 genes
(Figure 5 Bottom left): ATPase (enzyme located inside the inner mitochondrial membrane ensuring the resourcing of ATP from ADP) and DiNucleotide Phosphate Kinase (enzyme resourcing GTP from GDP and ATP). This addition of genes allows the network to pass from 2 to 4 attractors, providing the 4 types of differentiated cells (from bottle cell to intestinal epithelial cell) needed to achieve and finish the digestive tube (Figure 5 Bottom right). The CyT node correspond to the genes involved in the CyToskeleton formation, i.e., essentially the genes of Actin, Tubulin and Myosin, the latter being controlled by a specific subnetwork (Figure 5 Top middle). When the genes coding for the two types of Myosin (RLC, with Regulatory Light Chain and HC, with Heavy Chain) are expressed, then the ventral furrow invagination can start. We will model this process in the next Section showing with a simple mechanical model that it begins by a cell contraction followed by an invagination at the two extremities of the Drosophila embryo, extended after to central embryo region.
Physical Model of Ventral Furrow
Several successful models have already been created in order to simulate the process of ventral furrow invagination in Drosophila melanogaster. Although they have been extensively monitored, the parameters driving the movement and deformation of cells are not fully explained. We shall describe the structure of our physical model, the parameters we used to create it, the assumptions we made and the new possibilities and questions raised by this approach. This work focuses on the area of the structure where the phenomenon begins. As a result, we have modelled the upper part of one side of blastula (Figure 6) as described in (Abbas et al., 2009).
Figure 6: a) Representation of the simulated embryo structure at its initial shape and b) of an individual cell located at area of the centre row of the structure with its centrosome in red. In our approach, the structure consists of 75 cells arranged in 15 columns of 5 cells each. The first 8 columns form the central part of the structure. The curvature of the structure starts at column 9 and ends at column 15, for a total curvature of 90° (Figure 6a). Each cell is modelled as a hexahedral object, composed of 9 particles. 8 particles are used as the vertices of the hexahedron and one particle is located in the middle, denoting the centrosome of each cell. The cells, with the aid of a biomechanical library, are defined as individual physical objects, with three distinct characteristics: incompressibility, elasticity and contractility. The structure is represented on Figure 6 at its initial shape and an individual cell is located at the central row of the structure. The grey cell corresponds to the cell presented in Figure 6b. The cells of the central area are modelled by cubes with edges of 5µm2, resulting to 6 facets of initial surface equal to 25µm2. The initial volume is 125µm3. Muscular forces (black arrows) connect the particles of the top facet of the cell. The red sphere represents the centrosome, initially located at the centre of the cell. The particles are modelled as nodes with the ability to interact with their environment. They are defined by their position and their mass. Elastic and muscular forces are applied on them and they can also be submitted to boundary conditions. Their combined displacement is the crucial factor that affects the cell deformation and movement. The
incompressibility algorithm, uses the facets geometry and a displacement constraint, to keep the volume of cells constant. Elasticity forces are defined between neighbouring particles in order to model the tissue reaction against deformation (Henon et al., 1999; Promayon et al., 2003). The elasticity parameters have a small value, so that the cell shape can be modified quite easily by other forces. As a result, we have deformable cells, with nearly unchangeable volumes (which imitates the behaviour of cells in vivo). In addition, using muscular forces, we can induce the contraction of cellular objects similar to those due to the Myosin excess (Patwari and Lee, 2008). Using a higher value of the elasticity parameter for the centre particle (centrosome), we ensured that this particle stays close to the centre of the cell, even when the cell is deformed. This allows us to model the rigidifying effect of the cytoskeleton. In vivo experiments have shown that neighbouring cells form Adherens Junctions (AJs), which contain complexes of the transmembrane adhesion molecule E-cadherin and the adaptors α-catenin and ß-catenin (Gumbiner, 2005; Martin et al., 2010). In addition, these AJs are formed in the apical areas of the lateral surfaces of the cells (Tepass and Hartenstein, 1994; Oda and Tsukita, 2000). In our model, we have considered AJs to offer very strong linking between cells. Therefore, the vertices of the hexahedron are merged, summing up the forces and constraints of all concurrently surrounding cells. This allows a faster propagation of the forces during the simulation.
Simulation
Particles at the top of each cell in the central row are linked by muscular forces, which are used to model the forces applied by the orthogonal perpendicular Myosin fibres (Figure 6b). The norm of these forces for each particle is the same, resulting from a uniform distribution of forces along the structure, as suggested in (Brodland et al., 2010). More, boundary conditions are applied to the movement of some particles to verify the symmetry of the simulation (Figure 7):
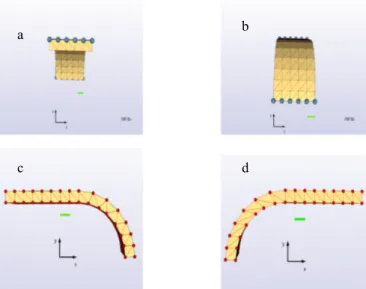
Figure 7: Representation of the boundary conditions imposed on the simulated embryo structure.
a
b
a b
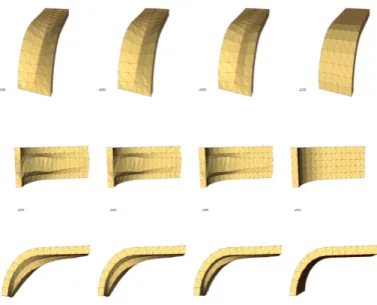
Figure 8: Simulation of the ventral furrow invagination process in Drosophila melanogaster.
i) the first boundary condition implies that structure edges cannot move in any direction (Figures 7a,b), ii) the second is applied on the side parts of the structure (Figures 7c,d). The particles can “slide” on the x and y axis but they cannot move on the z axis. These boundary conditions allow the simulation to consider that this model is a part (Figure 8) of a bigger structure, with cells expanding from all sides, in order to form a tubular shape, as presented in Figure 9. At the beginning of the simulation, all the particles are submitted to forces of equal value. This is achieved by applying uniform elasticity and contractility coefficients along the structure. The simulation is divided in time-steps. Each time-step corresponds approximately to 0.05 seconds. At each time-step, the following processing takes place:
- the forces are summed up on all the particles and integrated along the structure using a classical integration scheme, - the velocity and position of each particle are calculated and integrated also along the structure,
- the constraints are applied (incompressibility and boundary conditions).
In Figure 8, we present the geometry obtained for four different instances of the simulation, from three different angles. In the first row, the geometry is shown from the top, in the second row, it is shown from the bottom and in the third row it is shown from the side of the structure. In next papers to appear, we will provide videos of the entire simulation from all three points of view. At the beginning the cells in the centre row are contracting due to the activation of the Myosin fibres (after entering in the Bottle cells attractor of the previous Section). This contraction pulls all the cells of the model towards the centre. Due to the initial geometry of the structure, as shown in Figure 8, the vertical component of the force applied on the particles of the curved area causes the particles to move downward. As the cells located on the centre
row of the curved part move downward, they concurrently pull the other cells of the structure as well, due to the cell-cell bonds. As a result, all the cells start to move downwards (see Figure 8).
Figure 9: Simulation of invagination starting at the Drosophila embryo extremities (Bottom from (Martin et al., 2010)). An important factor concerning the invagination process is the surface/volume ratio. In vivo experiments have shown that, as the phenomenon proceeds, the area of the cell in contact with the nourishment fluid decreases (Leptin, 1999). On the other hand, cell volume increases. As a result, the surface/volume ratio decreases with time. It has been noted that it can decrease up to a certain threshold, after which the cell tends to divide (Figure 9) as observed in (Cui et al., 2005).
Figure 9: Proliferation occurring at the most invaginated part of the Drosophila embryo extremities, the Top left showing a BrDU pre-mitotic S-phase activity from (Cui et al., 2005)).
Conclusion
We have shown in this paper that the general architecture of a genetic regulatory network involves several genetic circuits, which are crucial for imposing a dynamics having only few attractors, corresponding to few functions to fulfil. This small number of attractors is well controlled by the existence of circuit intersections as well as by the presence of an aspecific inhibitory “noise” from small RNAs, like miRs and mitomiRs.
References
Abbas, L., Demongeot, J. and Glade, N. (2009). Synchrony in Reaction-diffusion models of morphogenesis: applications to curvature-dependent proliferation and zero-diffusion front waves. Phil. Trans. Royal Soc. A, 367:4829-4862.
Bandiera S, Rüberg S, Girard M, Cagnard N, Hanein S, Chrétien, D., Munnich, A., Lyonnet, S. and Henrion-Caude, A. (2011) Nuclear Outsourcing of RNA Interference Components to Human Mitochondria. PLoS ONE 6:e20746.
Ben Amor, H., Demongeot, J., Elena, A. and Sené, S. (2008). Structural Sensitivity of Neural and Genetic Networks. Lecture Notes in Computer Science, 5317:973-986.
Brodland, G., Conte , V., Cranston, P., Veldhuis, J., Narasimhan, S., Hutson, M. S., Jacinto, A., Ulrich, F., Baum, B. and Miodownik, M. (2010). Video force microscopy reveals the mechanics of ventral furrow invagination in drosophila. Proceedings of the National Academy of Sciences USA 107:22111-22116.
Cui, C., Yang, X., Chuai, M., Glazier, J. A. and Weijer, C. J. (2005). Analysis of tissue flow patterns during primitive streak formation in the chick embryo. Developmental Biology 284 :37-47.
Cui, C., Ji, R., Ding, F., Qi, D., Gao, H., Meng, H., Yu, J., Hu, S. and Zhang, H. (2007). A complete mitochondrial genome sequence of the wild two-humped camel (Camelus bactrianus ferus): an evolutionary history of camelidae BMC Genomics 8:241
Das, S., Ferlito, M., Wang, R.,, Liu, D., Raghavachari, N., Munson, P., Murphy, E. and Steenbergen, C. (2010). Existence of microRNA, “mito-miR-181c”, in Heart-Derived Mitochondria: Role in regulation of mitochondrial function by targeting mt-COX1. Circulation 122:A20624.
Demetrius, L., Coy, J. F. and Tuszynscki, J. A. (2010). Cancer prokifeartion and therapy: the Warburg effect and quantum metabolism. J. R. Soc. Interface 7:2.
Demongeot, J. and Besson, J. (1983). Code génétique et codes à enchaînement I. C.R. Acad. Sc. Série III 296:807-810.
Demongeot, J. (1998). Multi-stationarity and cell differentiation. J. Biol. Systems., 6:1-2.
Demongeot, J., Bezy-Wendling, J., Mattes, J., Haigron, P., Glade, N. and Coatrieux, J.L. (2003). Multiscale modeling and imaging: the challenges of biocomplexity. Proceedings of the IEEE Soc., 91:1723 – 1737.
Demongeot, J., Glade, N., Hansen, O. and Moreira, A. (2007). An open issue: the inner mitochondrial membrane (IMM) as a free boundary problem. Biochimie, 89:1049-1057.
Demongeot, J. and Moreira, A. (2007). A circular RNA at the origin of life. J. Theor. Biol., 249:314-324.
Demongeot, J., Glade, N. and Moreira, A. (2008a). Evolution and RNA relics. A Systems Biology view. Acta Biotheoretica, 56:5-25. Demongeot, J., Elena, A. and Sené, S. (2008b). Robustness in neural and
genetic networks. Acta Biotheoretica, 56:27-49.
Demongeot, J., Glade, N., Moreira, A. and Vial, L. (2009a). RNA relics and origin of life. Int. J. Molecular Sciences, 10:3420-3441. Demongeot, J., Ben Amor, H., Gillois, P., Noual, M. and Sené, S.
(2009b). Robustness of regulatory networks. A Generic Approach with Applications at Different Levels: Physiologic, Metabolic and Genetic. Int. J. Molecular Sciences, 10:4437-4473.
Demongeot, J., Drouet, E., Moreira, A., Rechoum, Y. and Sené, S. (2009c). Micro-RNAs: viral genome and robustness of the genes expression in host. Phil. Trans. Royal Soc. A, 367:4941-4965. Demongeot, J., Elena A., Noual, M., Sené, S. and Thuderoz, F. (2011a).
"Immunetworks", attractors and intersecting circuits. J. Theor. Biology, 280:19-33.
Demongeot, J., Elena A., Noual, M. and Sené, S. (2011b). Random Boolean Networks and Attractors of their Intersecting Circuits. In Barolli, L. et al., editors, IEEE AINA' 11 & BLSMC' 11, pages 483-487. IEEE Press, Piscataway.
Demongeot, J., Noual, M. and Sené, S. (in press). Combinatorics of Boolean automata circuits dynamics. To appear in Discrete Applied Mathematics.
Forest, L., Glade, N. and J. Demongeot, J. (2007). Liénard systems and potential-Hamiltonian decomposition. Applications. C. R. Acad. Sci. Biologies, 330:97-106.
Forest, L. and Demongeot, J. (2008). A general formalism for tissue morphogenesis based on cellular dynamics and control system interactions. Acta Biotheoretica, 56:51-74.
Gumbiner, B (2005). Regulation of cadherin-mediated adhesion in morphogenesis. Nat. Rev. Mol. Cell Biol. 6:622-634.
Henon, S., Lenormand, G., Richert, A. and Gallet, F. (1999). A new determination of the shear modulus of the human erythrocyte membrane using optical tweezers. Biophys. J. 76:1145-1151. Hsiao, C. L., Mohan, S., Kalahar, B. K. and Williams, L. D. (2009).
Peeling the Onion: Ribosomes are ancient molecular fossils. Molecular Biology and Evolution 26:2415-2425.
Huber, C. and Wächtershäuser, G (1998) Peptides by activation of amino- acids with CO on (Ni,Fe)S surfaces: Implications for the origin of life. Science 281:670-672.
Israel, M. and Schwartz, L. (2011). On the metabolic origin of cancer : substances that target tumor metabolism. Biomedical Research 22, 22 :132-166.
Krebs, J. E., Kilpatrick, S. T. and Goldstein, E. S. (2009) Lewin’s Genes X. Jones & Bartlett Learning, Sudbury, MA.
Leptin, M. (1999). Gastrulation in drosophila: the logic and the cellular mechanisms. EMBO J. 18:3187-3192.
Martin, A., Gelbart, M., Fernandez-Gonzalez, R., Kaschube, M., Wieschaus, E. (2010) Integration of contractile forces during tissue invagination. J. Cell Biol. 188:735-749.
Michon, F., Forest, L., Collomb, E., Demongeot, J. and Dhouailly, D. (2008). BMP-2 and BMP-7 play antagonistic roles in feather induction. Development, 135:2797-2805.
Oda, H. and Tsukita, S. (2000). Real-time imaging of cell-cell adherens junctions reveals that drosophila mesoderm invagination begins with two phases of apical constriction of cells. Journal of Cell Science 114:493-501.
Patwari, P. and Lee, R. (2008) Mechanical control of tissue morphogenesis. Circ. Res. 103:234-243.
Pratt, A. J. (2010). Evolution, Selection and the Metabolic Foundations of the RNA World. In Fellermann, H. et al., editors, Artificial Life XII Proceedings of the Twelfth International Conference on the Synthesis and Simulation of Living Systems, pages 49-56. MIT Press, Cambridge, MA.
Promayon, E., Martiel, J. L. and Tracqui, P. (2003). Physically-based 3D simulations of cell deformations and migrations. In Alt, W., Chaplain, M., Griebel, M. and Lenz, J., editors, Polymer and Cell Dynamics -Multiscale Modeling and Numerical Simulations, pages 125-138, Birkhauser, Berlin.
Sbisà, E., Tanzariello, F., Reyes, A., Pesole, G. and Saccone, C. (1997). Mammalian mitochondrial d-loop region structural analysis: identification of new conserved sequences and their functional and evolutionary implications. Gene 205:125-140.
Tayyab, M., Lontos, A., Promayon, E. and Demongeot, J. (2011c). Modelling and image processing of constriction and proliferation in the gastrulation process of Drosophila melanogaster. In Barolli, L. et al., editors, IEEE AINA' 11 & BLSMC' 11, pages 473-477. IEEE Press, Piscataway.
Tepass, U. and Hartenstein, V. (1994). The development of cellular junctions in the drosophila embryo. Developmental Biology 161:563-596.