HAL Id: inserm-00956391
https://www.hal.inserm.fr/inserm-00956391
Submitted on 7 Mar 2014
HAL is a multi-disciplinary open access
archive for the deposit and dissemination of
sci-entific research documents, whether they are
pub-lished or not. The documents may come from
teaching and research institutions in France or
abroad, or from public or private research centers.
L’archive ouverte pluridisciplinaire HAL, est
destinée au dépôt et à la diffusion de documents
scientifiques de niveau recherche, publiés ou non,
émanant des établissements d’enseignement et de
recherche français ou étrangers, des laboratoires
publics ou privés.
Spatio-temporal Registration of 2D US and 3D MR
images for the Characterization of Hypertrophic
Cardiomyopathy
Julian Betancur, Frédéric Schnell, Antoine Simon, François Tavard, Erwan
Donal, Alfredo Hernández, Mireille Garreau
To cite this version:
Julian Betancur, Frédéric Schnell, Antoine Simon, François Tavard, Erwan Donal, et al..
Spatio-temporal Registration of 2D US and 3D MR images for the Characterization of Hypertrophic
Car-diomyopathy.
Functional Imaging and Modeling of the Heart, Jan 2013, France.
pp.292-299,
�10.1007/978-3-642-38899-6_35�. �inserm-00956391�
Spatio-temporal Registration of 2D US and 3D
MR images for the Characterization of
Hypertrophic Cardiomyopathy
Juli´an Betancur1,2, Fr´ed´eric Schnell1,2,3, Antoine Simon1,2, Fran¸cois Tavard1,2,
Erwan Donal1,2,4, Alfredo Hern´andez1,2, and Mireille Garreau1,2
1
INSERM, UMR1099, Rennes, 35000, France,
2
Universit´e de Rennes 1, LTSI, Rennes, 35000, France,
3 Universit´e de Rennes 1, Lab. de Physiologie M´edicale, Rennes, 35000, France, 4
CHU Rennes, Service de Cardiologie, Rennes, 35000, France.
Abstract. A spatio-temporal registration procedure of speckle-tracking echocardiography (STE) and cine magnetic resonance (MR) images is presented. It aims to fuse the mechanical information in STE with the tissue information in MR late-gadolinium-enhanced image (LGE-MR), in order to describe the relationship between left ventricular myodial strain and macroscopic fibrosis in patients with hypertrophic car-diomyopathy (HCM). The registration was performed between the four-chambers-view STE contours (at rest), and the endocardial surfaces of the left ventricle (LV) from cine-MR short-axis-view sequence. The dy-namic LV geometries were described by their Fourier descriptors. This spatio-temporal representation of LV geometries was exploited to avoid the lack of dissimilarity between static geometries. To accomplish this goal, the temporal alignment was performed with the dynamical time warping method. The registration was evaluated on four HCM patients with myocardial fibrosis. First results suggest a relationship between my-ocardial fibrosis and the modification of the strain curve.
1
Introduction
Hypertrophic cardiomyopathy (HCM) is a common genetic cardiovascular dis-ease with a worldwide prevalence of 0.2% [7]. HCM is characterized by left ven-tricle (LV) hypertrophy. It is usually recognized by maximal LV wall thickness ≥ 15mm based on echocardiography, although cardiovascular magnetic reso-nance (MR) is now used with increasing frequency [2]. Many studies have now documented that approximately half of patients with HCM have late gadolinium enhancement (LGE) suggestive of areas of fibrosis [8]. Previous studies demon-strated that the extent of LGE was correlated with LV systolic and diastolic dysfunction as well as adverse cardiac events such as sudden cardiac death, fatal arrhythmia or worsening heart failure in patients with HCM [1]. Myocar-dial strain is a sensitive parameter of ventricular systolic function [3]. Two-dimensional speckle-tracking echocardiography (STE) had shown to provide an angle-independent, rapid and accurate method for strain measurement [6]. Some
previous studies reported that regional myocardial strain and wall thickening were affected by regional myocardial fibrosis in patients with HCM [9]. The de-scription of the relationship between myocardial strain and the macroscopic fi-brosis in myocardial tissue can lead to a better understanding of the strain curve. It would allow a low cost and precose characterization of this tissue and an im-provement in diagnostic. Then, the fusion of speckle tracking echocardiography and the LGE magnetic resonance (LGE-MR) sequences should be considered to establish and describe the aforementioned relationship.
The static registration of the LV surface from LGE-MR image (routinely ac-quired at mid-diastole) with its corresponding STE contour is difficult because of the lack of dissimilarity in LV geometry (i.e. LV smoothness and symmetry). In fact, a dynamic registration approach (2D+t / 3D+t) leads to a better regis-tration [11]. Although some iconic regisregis-tration approaches as been reported [5], a surface-based approach was selected here given the available STE data. In this approach, different methods could be used to describe shape information like in [12]. The representation of LV contours by their Fourier descriptors (FDs) was selected because the comparison of surfaces issued from different modalities becomes straighforward. Therefore, we use the FDs of both STE contours and corresponding contours extracted from 3D+t LV surfaces on MR short-axis-view (MR-SAX), to perform their registration. The temporal alignment is computed with the dynamical time warping (DTW) method [10]. DTW alignment allows to compare the two dynamic Fourier representations.
This paper presents a 2D+t to 3D+t surface-based registration method aim-ing to fuse mechanical (strain) and tissue information from STE and inversion recovery (IR-MR) sequence, respectively. It is organized as follows: the meth-ods are presented in Section 2 for (i) the representation of US and MR-SAX contours, (ii) their Fourier decomposition, (iii) the DTW alignment and metric computation, and (iv) the optimization of the similarity metric. Finally, the re-sults obtained on four HCM patients are presented and discussed in Section 3 to then derive a conclusion and present some perspectives.
2
Methods
The general scheme of the registration method is shown in Fig. 1. It aims to find the position of the US-plane in the MR-SAX space. For this purpose, a set of parameters (ν), defining the position of the US-plane, is optimized. This plane cuts the LV dynamic surface (S) obtained from MR-SAX images. It also
locates the input STE contours (UUU) in MR-SAX space. UUU and S are registered
performing a spatio-temporal alignment that includes the dynamical information (i.e., LV deformation). This is achieved as follows: first, a plane P (ν) is defined to extract a set of LV contours from S. Next, the Fourier decomposition of both
UUU and the extracted contours are computed. Then, a spatio-temporal similarity
metric between the two Fourier decompositions is calculated using the temporal
alignment (p′) obtained with the DTW method. These steps are iterated by a
gradient descent procedure that changes the parameters ν of the US-plane until this metric is minimized.
Fourier decomposition Input data STE contours LV surfaces from MR-SAX yes no min ? DTW Definition of US plane on MR-SAX Optimal US plane on MR-SAX and temporal alignment Temporal alignment and metric computation
Redefinition of (gradient descent)
Fig. 1. General scheme of the registration method.
2.1 Representation of Input Data
Two sequences are aligned by the registration method: the STE contour sequence
UUU, and the MR-SAX surface sequence S. Let Um∈ UUU be the STE contour at
the cardiac phase m (m ∈ {0, . . . , M −1}). Umis a set of LU ordered points e.g.,
clockwise. Similarly, let Sn ∈ S be the LV surface from MR-SAX image at the
cardiac phase n (n ∈ {0, . . . , N − 1}). The LV contour Sn(ν) is then extracted
from the surface Sn using the plane P (ν), with ν the plane parameters. Since
US and MR acquisitions are ECG-gated, m = n = 0 are the peak of the R-wave in STE and MR-SAX ECGs, respectively.
2.2 Fourier Decomposition of a 2D Contour
Each contour Um ∈ UUU and Sn(ν) ∈ SSS(ν) is decomposed into its Fourier
de-scriptors ˆUm∈ ˆUˆUˆU and ˆSn(ν) ∈ ˆSˆSˆS(ν), respectively. Thus, the discrete Fourier
transform (DFT) is computed for the sequence of complex numbers that encodes
the localization of each vertex in Umand Sn(ν). These descriptors can be made
invariant to translation, scale and/or rotation. Given that the deformation of the LV contours throughout the cardiac cycle contains important information, the translation and rotation invariances seem to be useful to compare these contours that belong to different spatio-temporal coordinate systems.
2.3 Temporal Alignment and Metric Computation
We propose the use of the DTW method to perform the temporal alignment [10]. DTW is depicted in Fig. 2. It is advantageous because the temporal inter-polation of the two dynamic contours is not needed. However, both sequences must share the same synchronization. In our case, the latter corresponds to the synchronization using the peak of the R-wave on ECGs. The use of the DTW method is convenient given the non-linear relationship between the ECG and a given variation of the RR-interval [4]. Despite the fact that temporal alignment can be performed using the ECGs that gated the acquisitions [5], ECG from MR acquisition is not always available.
0 10 20 30 40 50 56 0 5 10 15 20 25 29 0 1000 2000 3000 4000 5000 6000 7000 24 8 C ar d iac p ha se M R -S A X
Cardiac phase STE
C ar d iac p ha se M R -S A X
Cardiac phase STE
4000 2000 6000 8000 0 10000 12000 0 5 9 15 20 25 29 0 10 20 30 40 50 60 70 81
Fig. 2. DTW alignment between STE FDs sequence ( ˆUˆUˆU) and LV FDs sequence from MR-SAX ( ˆSˆSˆS(ν)) using 60 FDs, for patient 1 (left) and patient 2 (right) (optimal path p′ is the solid white line). The color indicates the distance between a pair ˆU
m and
ˆ
Sn(ν). TUSand TMRare the distances from p′to the end-systole point (ESUS, ESMR),
along ˆUˆUˆU and ˆSˆSˆS(ν) axes, respectively. They are used to evaluate temporal alignment.
The DTW method is performed on a matrix whose entries are the
dis-tances between each pair ˆUm, ˆSn(ν) (Eq. (1)). Let p={c0, . . . , ci, . . . , cI} with
ci=(mi, ni) be a warping time function. ci is a tuple indicating a temporal
correspondence between Umi and Sni(ν) such that mi ∈ {0, . . . , M − 1} and
ni ∈ {0, . . . , N − 1}. It is well known that FDs of higher order account for fine
contour details that, in our case, are more likely due to noise or sharp changes in the surface given the rough thickness of MR-SAX slices. Therefore, the
num-ber of descriptors of both ˆUm
i and ˆSni(ν) were limited to L. In addition, the
incidence of low order descriptors was emphasized defining a weighted distance: d( ˆUm i, ˆSni(ν)) = L−1 X k=0 1 k+ 1 ˆ Um ik− ˆSnik(ν) , with (mi, ni) ∈ p, (1) where ˆUm
ik and ˆSnik(ν) are the k-th FD of the mi-th STE contour and of the
ni-th LV MR-SAX contour, respectively. The DTW method aligns UUU and SSS(ν)
in time searching a p that minimizes the accumulated distance between ˆUˆUˆU and
ˆ
SˆSˆS(ν) along it:
p′= DT W ( ˆUˆUˆU , ˆSˆSˆS(ν)) = argmin
p I X i=1 d( ˆUm i, ˆSni(ν)), with (mi, ni) ∈ p, (2)
p′was computed using dynamical programming. In addition, the search of p′was
contrained using a mask. Fig. 2 shows the optimal paths p′ obtained at the last
iteration of the registration process for two patients. The color codes the distance between a pair of Fourier decompositions (Eq. (1)). Finally, the spatio-temporal
similarity metric between UUU and SSS(ν) was defined as:
E(ν) = I X i=1 d( ˆUm′ i, ˆ Sn′ i(ν)), with (m ′ i, n ′ i) ∈ p ′ , (3)
2.4 Optimization of US-plane parameters
An optimal US-plane (P (ν′
)) is extracted at the end of the optimization process.
P(ν) is defined by the parameters ν = [O, −→n] with O = [xO, yO, zO] its origin
and −→n = [x−→n , y−→n , z−→n ] its normal vector. Thus, the parameters that minimize
E(ν) are:
ν′= argmin
ν
E(ν), (4)
This leads to a rigid registration with an underlying non-rigid temporal
align-ment (p′
in Eq. (3)). Eq. (4) was minimized using a constrained gradient descent
procedure initialized by the spatial centroids of UUU and SSS(ν), the long axis of
the LV extracted from the direction matrix of MR-SAX image, the apex of LV
at n = 0 and an estimation of −→n. Note from Fig. 1 that the DTW is computed
at each iteration. The gradient descent parameters were constrained as follows:
a sphere of 20mm around the apex for the origin, a cone angle of 10◦around the
long axis (vertex at the apex), a cone angle of 10◦ around the initial −→
n (vertex
at the apex), and a ratio of 300:1 for the step size of O to the step size of −→n.
3
Results and Discussion
The proposed registration process was evaluated on data from four HCM tients. The diagnosis of HCM followed the recent guidelines in [2]. Besides, pa-tients have some degree of fibrosis in LV myocardium assessed from IR-MR.
US four-chambers-view (4CAVX) images were acquired at rest on a GE Vivid 7 station (GE Healthcare, Horten, Norway). The end-systole (ES) phase was determined using the ECG and the closure of the aortic valve. Then, the STE output contours were exported for the RR-interval (using the peak of R-wave). STE contours resolution varies from 50 to 63 points and from 56 to 80 frames.
Cine-MR sequences (SAX, 4CAVX and long-axis-view LAX) of the left ven-tricle were also acquired (ECG gated, 30 phases, gadolinium enhanced). ES phase was determined on MR-SAX images as well. Besides, jointly IR-MR im-ages were acquired at mid-diastole for the same views. They were used to assess the fibrosis. The resolution for MR-SAX is 256 × 256 × 12 pixels. Voxel spacing
is 1.25 × 1.25 mm2 for x and y, and from 8 mm to 10.01 mm along z.
Temporal alignment Fig. 2 shows the p′
computed from the distance matrix
between ˆUˆUˆU and ˆSˆSˆS(ν) at the last iteration of the optimization process. Both, the
misalignment of ESUS(TUS) and the misalignment of ESMR(TMR) were used as
performance indicators, with ES indicating the end-systole phase. TUS and TMR
are shown in Fig. 2(left). These misalignments were normalized as a percentage of their corresponding RR-interval (0% being the best value). Table 1 contains the performance for four values of L (number of FDs), and best per patient are bold. The mean and standard deviation are also included.
It is observed in Table 1 that the number of FDs has an influence on per-formance. The best alignment was obtained for L=60 which is lower than the
Table 1. Evaluation of DTW alignment using L ∈ {30, 50, 60, 80} (Pn◦X: a given
patient). TUSand TMRare the misalignments of ES for US and MR as the percentage
of their RR-interval, respectively. The mean values ( ¯TUS, ¯TMR) and standard deviations
(σTUS, σTMR) for each test are at the right.
L P1 P2 P3 P4 Mean Std. deviation TUS TMRTUS TMRTUSTMRTUSTMR T¯US T¯MRσTUS σTMR (%) (%) (%) (%) (%) (%) (%) (%) (%) (%) (%) (%) 30 12.5 16.7 11.1 26.7 5.5 10 4.3 10 8.4 15.9 4.1 7.9 50 16.1 13.3 3.7 10 0 0 8.7 16.7 7.1 10 7.0 7.2 60 10.7 13.3 0 0 3.6 6.7 5.8 13.3 5.0 8.3 4.5 6.4 80 5.4 10 7.4 20 1.8 3.3 7.2 16.7 5.5 12.5 2.6 7.4
maximum number of points. We took L=50 as the second performance because
it ranks second for ¯TMR. Given that STE contours do not have high frequency
geometrical components as MR contours (STE contours are already smooth), then these results show that contour sequences should be compared using their low frequency FDs. However, this does not apply for P1. In that case, MR-SAX images have non negligable movement artifacts that could bias the alignment. Finally, US sequences are better aligned than MR sequences. This suggest that
the search of p′ should be constrained according to the length of input sequences.
Spatio-temporal alignment Given the lack of gold standard, the aligment of
UUU and SSS(ν) was rated by one cardiologist at both the peak or R-wave and ESUS
phases. For this purpose, STE contours (color coded by segment) were superim-posed to the reformatted MR-SAX and MR-4CAVX. Fig. 3 exemplifies this on one patient. Each segment was rated as exploitable or non-exploitable (1 or 0). The addition of exploitable segments was used as performance indicator. Output ratings are in Table 2 for L ∈ {50, 60}. Best result was obtained for L=50.
(a) At peak of R-wave. (b) ESUS.
Fig. 3. P2: Images used for qualitative evaluation (L = 60). 3(a) images at the peak of R-wave, and 3(b) corresponding images at ESU S. Yellow: basal, cyan:
septal-mid, green: septal-apical, magenta: lateral-apical, blue: lateral-septal-mid, red: lateral-basal.
Apical segments accounted for all the non-exploitable segments in the spatio-temporal alignment evaluation in Table 2. This can be explained by the low
Table 2. Exploitable segments/total segments after the spatio-temporal registration of the four patients (P1 to P4). The score is the addition by row.
L P1 P2 P3 P4 Score
R ESUS R ESUS R ESUS R ESUS
50 5/6 6/6 6/6 6/6 4/6 4/6 5/6 6/6 42/48 60 5/6 6/6 5/6 6/6 4/6 4/6 5/6 6/6 41/48
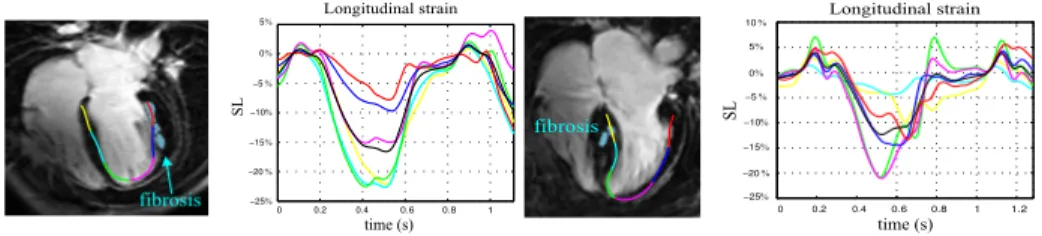
quality of apical segment representation in US images. This would also explain that the best performance was obtained for L = 50 which is not the best after temporal evaluation. Finally, Fig. 4 contains the superimposition of resulting registration at mid-diastole for IR-MR-4CAVX image and corresponding STE-4CAVX contour for P1 and P2. Longitudinal strains (SL) are also included. Fig. 4 highlights that the change in the magnitude of the regional SL minima could be related with the presense of fibrosis. These first results suggest a relationship between myocardial fibrosis and the modification of the strain curve.
5% 0% −5% −10% −15% −20% −25% 0.6 0.8 1 0 0.2 0.4 time (s) SL Longitudinal strain fibrosis Longitudinal strain 0.6 0.8 1 1.2 0 0.2 0.4 10% 5% 0% −5% −10% −15% −20% −25% SL time (s)
fibrosisfibrosisApex
Fig. 4. STE contour superimposed with IR-MR-4CAVX image and SL curves for P1 (left) and P2 (right). Black curve is the global SL. Areas with fibrosis are in cyan.
4
Conclusion
We proposed a method to register US and MR images aiming to fuse mechanical and tissue information from HCM patients. It is based on a dynamic approach which allows to have an improved metric compared to a static approach. Results show that the FD spatio-temporal alignment using the DTW allowed a satis-factory alignment of STE-4CAVX contours and MR-SAX images. Moreover, the results obtained by the proposed method allowed the cardiologist to link the longitudinal regional strain with the tissue characteristics assessed from IR-MR image. In addition, a possible correlation between myocardial fibrosis and the change of the strain curve was observed.
This study will be continued including more HCM patients with and with-out fibrosis to validate the strain/fibrosis correlation. This would improve the understanding of the strain curve from STE.
References
1. O. Bruder, A. Wagner, C.J. Jensen, S. Schneider, P. Ong, E-M. Kispert, K. Nassen-stein, T. Schlosser, G.V. Sabin, U. Sechtem, and H. Mahrholdt. Myocardial Scar Visualized by Cardiovascular Magnetic Resonance Imaging Predicts Major Adverse Events in Patients with Hypertrophic Cardiomyopathy. Journal of the American College of Cardiology, 56(11):875–887, September 2010.
2. B.J. Gersh, B.J. Maron, R.O. Bonow, J.A. Dearani, M.A. Fifer, M.S. Link, S.S. Naidu, R.A. Nishimura, S.R. Ommen, H. Rakowski, C.E. Seidman, J.A. Towbin, J.E. Udelson, and C.W. Yancy. 2011 ACCF/AHA Guideline for the Diagnosis and Treatment of Hypertrophic Cardiomyopathy A Report of the American College of Cardiology Foundation/American Heart Association Task Force on Practice Guidelines. Circulation, 124(24):e783–e831, December 2011.
3. N.L. Greenberg, M.S. Firstenberg, P.L. Castro, M. Main, A. Travaglini, J.A. Od-abashian, J.K. Drinko, L.L. Rodriguez, J.D. Thomas, and M.J. Garcia. Doppler-Derived Myocardial Systolic Strain Rate is a Strong Index of Left Ventricular Contractility. Circulation, 105(1):99–105, January 2002.
4. T. Heldt, E.B. Shim, R.D. Kamm, and R.G. Mark. Computational Modeling of Cardiovascular Response to Orthostatic Stress. Journal of Applied Physiology, 92(3):1239–1254, 2002.
5. Xishi Huang, J. Moore, G. Guiraudon, D.L. Jones, D. Bainbridge, Jing Ren, and T.M. Peters. Dynamic 2D ultrasound and 3D CT image registration of the beating heart. Medical Imaging, IEEE Transactions on, 28(8):1179–1189, 2009.
6. M. Leitman, P. Lysyansky, S. Sidenko, V. Shir, E. Peleg, M. Binenbaum, E. Kaluski, R. Krakover, and Z. Vered. Two-dimensional strain-a novel software for real-time quantitative echocardiographic assessment of myocardial function. Journal of the American Society of Echocardiography, 17(10):1021–1029, 2004. 7. B.J. Maron, J.M. Gardin, J.M. Flack, S.S. Gidding, T.T. Kurosaki, and D.E. Bild.
Prevalence of Hypertrophic Cardiomyopathy in a General Population of Young Adults Echocardiographic Analysis of 4111 Subjects in the CARDIA Study. Cir-culation, 92(4):785–789, August 1995.
8. M.S. Maron, E. Appelbaum, C.J. Harrigan, J. Buros, C.M. Gibson, C. Hanna, J.R. Lesser, J.E. Udelson, W.J. Manning, and B.J. Maron. Clinical Profile and Signif-icance of Delayed Enhancement in Hypertrophic Cardiomyopathy. Circulation: Heart Failure, 1(3):184–191, September 2008.
9. Z.B. Popovi´c, D.H. Kwon, M. Mishra, A. Buakhamsri, N.L. Greenberg, M. Thami-larasan, S.D. Flamm, J.D. Thomas, H.M. Lever, and M.Y. Desai. Association Between Regional Ventricular Function and Myocardial Fibrosis in Hypertrophic Cardiomyopathy Assessed by Speckle Tracking Echocardiography and Delayed Hy-perenhancement Magnetic Resonance Imaging. Journal of the American Society of Echocardiography, 21(12):1299–1305, 2008.
10. H. Sakoe and S. Chiba. Dynamic Programming Algorithm Optimization for Spoken Word Recognition. Acoustics, Speech and Signal Processing, IEEE Transactions on, 26(1):43–49, 1978.
11. F. Tavard, A. Simon, A.I. Hernandez, J. Betancur, E. Donal, and M. Garreau. Dynamic Registration of Cardiac US and CT Data Using Fourier Descriptors and Dynamic Time Warping. In IEEE IPTA Conference, 2012.
12. Nhon H. Trinh and Benjamin B. Kimia. Skeleton search: Category-specific object recognition and segmentation using a skeletal shape model. International Journal of Computer Vision, 94(2):215–240, 2011.