Publisher’s version / Version de l'éditeur:
Theoretical and Applied Genetics, 2016-06-30
READ THESE TERMS AND CONDITIONS CAREFULLY BEFORE USING THIS WEBSITE.
https://nrc-publications.canada.ca/eng/copyright
Vous avez des questions? Nous pouvons vous aider. Pour communiquer directement avec un auteur, consultez la
première page de la revue dans laquelle son article a été publié afin de trouver ses coordonnées. Si vous n’arrivez pas à les repérer, communiquez avec nous à PublicationsArchive-ArchivesPublications@nrc-cnrc.gc.ca.
Questions? Contact the NRC Publications Archive team at
PublicationsArchive-ArchivesPublications@nrc-cnrc.gc.ca. If you wish to email the authors directly, please see the first page of the publication for their contact information.
NRC Publications Archive
Archives des publications du CNRC
This publication could be one of several versions: author’s original, accepted manuscript or the publisher’s version. / La version de cette publication peut être l’une des suivantes : la version prépublication de l’auteur, la version acceptée du manuscrit ou la version de l’éditeur.
For the publisher’s version, please access the DOI link below./ Pour consulter la version de l’éditeur, utilisez le lien DOI ci-dessous.
https://doi.org/10.1007/s00122-016-2746-7
Access and use of this website and the material on it are subject to the Terms and Conditions set forth at
A high-density SNP genotyping array for Brassica napus and its
ancestral diploid species based on optimised selection of single-locus
markers in the allotetraploid genome
Clarke, Wayne E.; Higgins, Erin E.; Plieske, Joerg; Wieseke, Ralf;
Sidebottom, Christine; Khedikar, Yogendra; Batley, Jacqueline; Edwards,
Dave; Meng, Jinling; Li, Ruiyuan; Lawley, Cynthia Taylor; Pauquet, Jérôme;
Laga, Benjamin; Cheung, Wing; Iniguez-Luy, Federico; Dyrszka,
Emmanuelle; Rae, Stephen; Stich, Benjamin; Snowdon, Rod J.; Sharpe,
Andrew G.; Ganal, Martin W.; Parkin, Isobel A. P.
https://publications-cnrc.canada.ca/fra/droits
L’accès à ce site Web et l’utilisation de son contenu sont assujettis aux conditions présentées dans le site LISEZ CES CONDITIONS ATTENTIVEMENT AVANT D’UTILISER CE SITE WEB.
NRC Publications Record / Notice d'Archives des publications de CNRC:
https://nrc-publications.canada.ca/eng/view/object/?id=f3b77185-97a7-421b-baf4-0785102d5033 https://publications-cnrc.canada.ca/fra/voir/objet/?id=f3b77185-97a7-421b-baf4-0785102d5033
DOI 10.1007/s00122-016-2746-7
ORIGINAL ARTICLE
A high-density SNP genotyping array for Brassica napus
and its ancestral diploid species based on optimised selection
of single-locus markers in the allotetraploid genome
Wayne E. Clarke1 · Erin E. Higgins1 · Joerg Plieske2 · Ralf Wieseke2 · Christine Sidebottom3 · Yogendra Khedikar1 ·
Jacqueline Batley4 · Dave Edwards4 · Jinling Meng5 · Ruiyuan Li5 · Cynthia Taylor Lawley6 · Jérôme Pauquet7,13 · Benjamin Laga8 · Wing Cheung9 · Federico Iniguez-Luy10 · Emmanuelle Dyrszka11 · Stephen Rae8 ·
Benjamin Stich12 · Rod J. Snowdon14 · Andrew G. Sharpe3 · Martin W. Ganal2 · Isobel A. P. Parkin1
Received: 26 April 2016 / Accepted: 18 June 2016
© The Author(s) 2016. This article is published with open access at Springerlink.com
number of times across the highly replicated genome. As a result approximately 60 % of the SNP assays display genome-specificity, resolving as three clearly separated clusters (AA, AB, and BB) when tested with a diverse range of B. napus material. This genome specificity was supported by the analysis of the diploid ancestors of B.
napus, whereby 26,504 and 29,720 markers were scorable
in B. oleracea and B. rapa, respectively. Forty-four percent of the assayed loci on the array were genetically mapped in a single doubled-haploid B. napus population allow-ing alignment of their physical and genetic coordinates. Although strong conservation of the two positions was shown, at least 3 % of the loci were genetically mapped to a homoeologous position compared to their presumed physical position in the respective genome, underlying the importance of genetic corroboration of locus identity. In
Abstract
Key message The Brassica napus Illumina array
pro-vides genome-wide markers linked to the available genome sequence, a significant tool for genetic analyses of the allotetraploid B. napus and its progenitor diploid genomes.
Abstract A high-density single nucleotide polymorphism
(SNP) Illumina Infinium array, containing 52,157 mark-ers, was developed for the allotetraploid Brassica napus. A stringent selection process employing the short probe sequence for each SNP assay was used to limit the major-ity of the selected markers to those represented a minimum
Communicated by C. F. Quiros.
Electronic supplementary material The online version of this
article (doi:10.1007/s00122-016-2746-7) contains supplementary material, which is available to authorized users.
* Isobel A. P. Parkin isobel.parkin@agr.gc.ca
1
Agriculture and Agri-Food Canada, 107 Science Place, Saskatoon, SK S7N 0X2, Canada
2
TraitGenetics GmbH, Am Schwabeplan 1b, Stadt Seeland OT, 06466 Gatersleben, Germany
3 National Research Council Canada, 110 Gymnasium Place,
Saskatoon S7N 0W9, Canada
4
School of Plant Biology and The UWA Institute of Agriculture, The University of Western Australia, 35 Stirling Highway, Crawley, Perth 6009, Australia
5 National Key Laboratory of Crop Genetic Improvement,
Key Laboratory of Rapeseed Genetic Improvement, Ministry of Agriculture P. R. China, Huazhong Agricultural University, Wuhan 430070, China
6
Illumina, Inc., 9885 Towne Centre Drive, San Diego, CA 92121, USA
7 BIOGEMMA 6, chemin des Panedautes, 31700 Mondonville,
France
8
Bayer BioScience NV, 9052 Ghent, Belgium
9 DNA Landmarks Inc, 84 Rue Richelieu,
St-Jean-sur-Richelieu, QC J3B 6X3, Canada
10
Genomics and Bioinformatics Unit, Agri Aquaculture Nutritional Genomic Center (CGNA), Conicyt-Regional, Gore La Araucania, R10C1001, Temuco, Chile
11 Syngenta France SAS, 12 Chemin de l’hobit, B.P. 27,
31790 Saint-Sauveur, France
12
Max Planck Institute for Plant Breeding Research, Carl-von-Linné-Weg 10, 50829 Cologne, Germany
13 Present Address: SYNGENTA France SAS, 346, route des
Pasquiers, 84260 Sarrians, France
14 Department of Plant Breeding, IFZ Research Centre
for Biosystems, Land Use and Nutrition, Justus Liebig University, Giessen, Germany
addition, the alignments identified multiple rearrangements between the diploid and tetraploid Brassica genomes. Although mostly attributed to genome assembly errors, some are likely evidence of rearrangements that occurred since the hybridisation of the progenitor genomes in the
B. napus nucleus. Based on estimates for linkage
disequi-librium decay, the array is a valuable tool for genetic fine mapping and genome-wide association studies in B. napus and its progenitor genomes.
Introduction
Brassica napus is an economically important oilseed crop
that is primarily grown to extract the healthy edible oil from the seed, but it is now also grown as a renewable feedstock for biodiesel. In addition, there are vegetable types of the species that have been bred for both human and animal con-sumption. It is a temperate crop widely grown in both the Northern and Southern hemispheres due to available geno-typic variation for flowering time and response to photo-period. It is believed that B. napus emerged from a small number of hybridisation events between the diploid progen-itors Brassica oleracea (C genome) and Brassica rapa (A genome) (UN 1935) that probably occurred in the southern Mediterranean and possibly regions of Asia around 7000– 10,000 years ago (Chalhoub et al. 2014). The progenitors,
B. oleracea and B. rapa, are also important predominantly
vegetable crop species that each display a wide range of genetic and morphological diversity (Dixon 2006).
There are extensive worldwide breeding efforts in B.
napus and its diploid relatives in both the public and private
domains that contribute to developing higher value crops with improved yields (Iniguez-Luy and Federico 2011; Snowdon and Iniguez Luy 2012). Such breeding efforts are benefiting from access to a burgeoning collection of genetic and genomic resources for the Brassica species cul-minating in the recent release of the diploid and amphidip-loid genomes that complete one axis of U’s triangle and define the B. napus genome (Chalhoub et al. 2014; Parkin et al. 2014; Wang et al. 2011). The now available genome sequences can be exploited to identify candidate genes for traits of interest, but their primary utility in breeding is in the development of genetic markers for marker assisted selection and, more recently, genomic selection. Genomic selection or predictive breeding is showing potential for application in crop species, where traits can be controlled by multiple small-effect QTLs, as more sophisticated algo-rithms have been developed to overcome the statistical chal-lenges of working with disproportionately larger numbers of marker loci than samples tested (Jannink et al. 2010).
The availability of genome sequences and access to rela-tively economical next-generation sequencing technologies
has provided the impetus to identify extensive nucleotide var-iation among different plant species. The abundance of sin-gle nucleotide polymorphisms (SNPs) across plant genomes has made them highly desirable for marker development (Ganal et al. 2009, 2012). High-throughput (tens of thou-sands or higher) SNP screening can be achieved effectively by either genotyping-by-sequencing (GBS) or high-density SNP arrays. GBS requires no former knowledge of available SNPs within a species, but is heavily reliant on bioinformat-ics capacity, and although common SNP will be found across experiments, the SNP profile identified is dependent on the genotypes queried (Deschamps et al. 2012). In comparison, high-density SNP arrays provide a common platform that can be continuously used and replicated across multiple labs with minimal computational requirement (Ganal et al. 2012). However, such SNP genotyping arrays involve significant development costs to identify sufficient numbers of robust, informative loci that fulfill assay design criteria. Identify-ing high-quality SNP loci for array design requires sequence data from sufficient numbers of genotypes to be able to assess polymorphism levels and associated allele ratios across the diversity of a species to minimise ascertainment bias. In addition, genome duplication in polyploid genomes, such as B. napus, confounds the design of SNP assays, since nucleotide variation among closely related orthologous or paralogous sequences is often misinterpreted as allelic vari-ation (Parkin et al. 2010). Furthermore, since the SNPs are evaluated through hybridisation, multiple homologous and homoeologous loci may hybridise to a single SNP oligonu-cleotide probe leading to highly compressed and often irre-solvable SNP patterns.
The current manuscript describes the development of a high-density (>50,000) Illumina Infinium® SNP array designed for genotyping in B. napus, that can also be applied to the diploids, B. oleracea and B. rapa. Next-generation sequence data from both genomic and transcriptome sources were utilised to identify millions of preliminary SNP loci across the B. napus genome. Extensive filtering of these data led to the development of a highly effective tool for Brassica breeding with the majority of the SNP assays targeting sin-gle loci within the amphidiploid genome. The efficacy of the array was tested through the generation of cluster files, which define common allele clusters across a range of genotypes in all three species, and a high-density genetic map for B. napus.
Materials and methods
Reference mapping and variant calling
Pseudo-genome sequences of the diploid A and C genomes (283.8 and 488.6 Mb, respectively) were combined into a single reference sequence set for mapping. Sequence reads
from each genotype were aligned independently using the CLC Genomics Server v3.6. Default parameters for the mapping algorithm were used except for the mapping identity parameter which was increased to 98 % to facili-tate resolution of homoeologous sequence reads. Mapped reads were interrogated for sequence variation using the CLC Genomics Server v3.6 variant discovery algorithm. A minimum depth of coverage of 3× for 454 and 8× for Illu-mina data was required for SNP calling. Mapping data and variant calls were exported from CLC in the form of SAM alignment files and tab-delimited text files, respectively. Data from these files were combined using a custom Perl script to determine a missing, reference, or variant call in each genotype at each covered position of the genome.
SNP filtering
Combined SNP results were filtered using custom Perl scripts and eliminated based on the following criteria: (1) SNP positions without suitable flanking sequence (60 bp on at least one side of the SNP with no variation); (2) SNP positions with more than two variations within the sur-veyed genotypes; (3) SNP positions with high levels of heterozygous calls, biased allele ratio, or missing data; (4) Illumina Assay Design Tool (ADT) score less than 0.6; (5) SNP positions where the variation was the result of a transversion.
Probe matching and SNP selection
Probe sequences for all filtered SNPs were obtained from Illumina and then aligned to the reference sequences using the open source alignment tool BLAT with default param-eters (Kent 2002). These alignments were parsed using a custom Perl script to determine the number of times the probe sequence from a particular SNP matched to the ref-erence sequence set. A probe alignment was considered to be matched if 35 consecutive base pairs of the probe were fully aligned. SNPs were ranked based on the number of times their probe sequence matched the reference sequence set and SNPs with fewer probe matches preferentially selected.
Experimental SNP data collection
The cluster file for B. napus was generated at AAFC through analysis of 437 genotypes and at TraitGenetics through the analysis of 432 genotypes. The cluster files for B. oleracea and B. rapa were generated with 129 and 121 samples, respectively. In both laboratories, DNA was extracted from young leaf tissue of greenhouse grown plants using a cetyltrimethylammonium bromide (CTAB)-based method (Murray and Thompson 1980). DNA was
quantified and 200 ng were hybridised to the Brassica 60 K Infinium array as described in the manufacturer’s protocol (Illumina Inc., San Diego, CA). The arrays were scanned using an Illumina HiScan or BeadArray Reader, and SNP data were analysed using the Genotyping module of the GenomeStudio software package with the setting for the No Call threshold set to 0.05.
Generation of the genetic map
DNA from 124 lines of a doubled-haploid (DH) population (derived from a cross between DH12075 and PSA12 and named SG DH, Parkin et al, unpublished) was hybridised to the Brassica 60 K Infinium array, and allele calls were made using the newly generated cluster file. The genetic linkage map was generated using the MSTmap software package (Wu et al. 2008). The map order was checked manually to ensure the optimal placement of the SNP loci, and a bin map was generated. Final-map distances were calculated using the Kosambi mapping function and the Mapmaker v3 software (Lander et al. 1987).
Results
Array design
A set of 54,866 SNP assays, previously identified and tested on the Illumina platform, were provided from a num-ber of different sources (Bus et al. 2012; Dalton-Morgan et al. 2014) (Cheung, Dryszka, Laga, Pauquet, Rae, unpub-lished data). The remainder of the SNP assays that were used in the array design was processed using a single pipe-line (Supplementary Figure 1). Next-generation sequenc-ing data were collated from two previously published data sets described in Harper et al. (2012), which contributed RNASeq data from 42 different B. napus genotypes, and Clarke et al. (2013), which contributed Illumina and Roche 454 sequence capture data from nine B. napus genotypes. In addition, Roche 454 (1.16 Gb) data from genomic material and Illumina HiSeq (417.85 Gb) data from both genomic and transcriptome sources were generated for an additional 13 B. napus, four B. oleracea, and three B. rapa genotypes (Supplementary Table 1).
The array was designed prior to the release of the B.
napus genome sequence (Chalhoub et al. 2014). Thus,
high-quality sequence reads were reference mapped using CLC Genomics Server v3.6 to a pseudo B. napus genome derived from concatenating the genome sequences of
B. rapa (Wang et al. 2011) and B. oleracea (Parkin et al.
2014). Considering only uniquely matching reads, over 570 Gb of sequence data were aligned to the pseudo-genome providing an estimated 738× depth coverage,
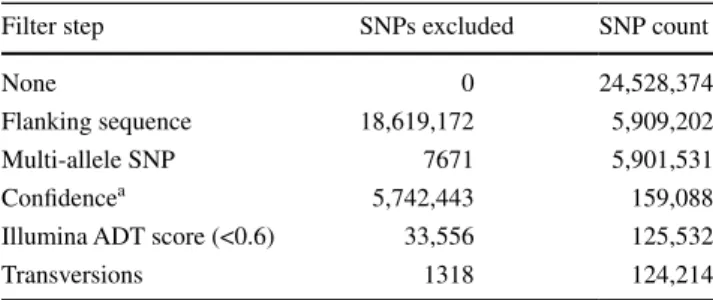
although it should be noted that the inclusion of transcrip-tome data can bias the overall distribution with over-rep-resentation of some genic regions. SNP calling was com-pleted using the SNP Discovery algorithm of the CLC Genomics Server, and all relevant data were exported for further filtering. Custom Perl scripts were used to gener-ate an output file that included the SNP id, reference id, and position, flanking sequence where available, the refer-ence allele, and for each individual surveyed, the SNP call, depth, and frequency data. These data were then filtered in three steps. First, SNPs were excluded if there was insuf-ficient SNP-free flanking sequence (60 bp on at least one side). This step removed the largest number of the identi-fied SNP loci (76 %) (Table 1). In the second step, SNPs were excluded if they were multi-allelic (more than two alleles), since these cannot be efficiently assayed using the Illumina platform. The final step identified high-confidence SNP loci, SNPs were excluded when the frequency of indi-viduals with missing data was greater than 70 %, the fre-quency of individuals that showed heterozygous calls was greater than 40 %, and finally, if the allele frequency was higher than 0.8 or lower than 0.2. Table 1 shows the attri-tion at each filtering step. A final set of 180,398 SNP loci consisting of filtered and previously tested SNPs were sub-mitted to the Illumina Assay Design Tool, which returned 161,917 SNPs with a minimum recommended score at or above 0.6.
The specificity of each Illumina SNP assay is reliant on a single 50 bp probe sequence flanking one side of the SNP, the length of which can lead to ambiguous match-ing across genomes with any level of redundancy. To fil-ter potential designs to reduce the impact of high copy probe sequences, the 50 bp probes for each possible assay design were matched using BLAT to the pseudo-genome. More than half (74 %) of the filtered SNP assays had probe sequences that mapped to multiple regions of the Brassica genome. The final SNP list submitted for Illumina bead design contained 15,141 previously tested SNP loci, 32,294 newly designed SNP loci that matched the pseudo-genome uniquely, and 11,029 SNP loci that matched twice. Once
synthesized, 52,157 SNP markers on the Brassica 60 K array passed bead representation and decoding quality met-rics, including 1213 A/T or C/G SNPs, which are repre-sented by Infinium I bead types that require two beads per assay.
Cluster file generation for reliable scoring of the SNP markers in Brassica napus and its diploid ancestors
The most efficient high-throughput application of an Illu-mina array can be achieved with the development of a robust cluster file that defines the expected intensity level of the three genotype classes (AA, AB, and BB) for each SNP locus. The cluster file is applied to intensity data to automatically call the genotypes for experimental samples, thus allowing easy comparison of data across labs (Fig. 1a). At AAFC Saskatoon, the first data set included 327 B.
napus genotypes of both annual and biennial types, from
diverse origins, ten F1 lines, and a subset of lines from two
DH mapping populations. Independently at TraitGenetics, a second data set was generated that consisted of 432 mostly winter-type B. napus genotypes, including 67 hybrids, 88 F2, and 20 resynthesized B. napus lines. The two data sets
were analysed independently and the resultant cluster files compared. After filtering out 173 SNP from the cluster file that displayed low intensity across the majority of the sam-ples, 51,984 SNP remained. Based on the genotypes tested at AAFC, 1678 loci were monomorphic and for the geno-types tested at TraitGenetics, 2444 markers were mono-morphic. Due to the strong sequence similarity between the A and C genomes of B. napus, it was anticipated that some of the SNP loci would display cluster patterns reflecting co-hybridisation of homoeologous loci. In such instances, when both homoeologous loci are polymorphic, the result-ant SNP patterns are not automatically resolvable, gener-ally these result in four-to-five clusters, and the Illumina software will identify exceptionally high numbers of het-erozygotes (Fig. 1b). However, when one of the homoeolo-gous loci is monomorphic, the genotype cluster intensities are shifted to one side of the theta space (actual genotype would be, for example, AAAA, AAAB, and AABB), lead-ing to false cluster assignment with the routine analysis tools (Fig. 1c); yet, the cluster definition of such an SNP
Table 1 SNPs and filtering steps used for array design
a SNP positions were filtered for high levels of heterozygous calls,
biased allele ratio, or missing data as described in the Results section
Filter step SNPs excluded SNP count
None 0 24,528,374
Flanking sequence 18,619,172 5,909,202
Multi-allele SNP 7671 5,901,531
Confidencea 5,742,443 159,088
Illumina ADT score (<0.6) 33,556 125,532
Transversions 1318 124,214
Fig. 1 GenomeStudio images showing representative SNP cluster
patterns across Brassica napus genotypes. One cluster representing one parental allele is coloured in red (AA), the second in blue (BB), and heterozygote genotypes in purple. a Shows a genome-specific SNP marker in B. napus, almost 60 % of the SNP loci show this clear separation of the expected three genotypes. b SNP locus likely resulting from hybridisation of two segregating homoeologous loci reveals five clusters and an excess of heterozygotes. c and d Show a SNP locus called automatically by the software and after manual adjustment of the cluster profile, respectively. e SNP locus where one parental allele shows no hybridisation (presence/absence marker)
locus can be optimised manually to reflect the correct geno-type positions, rendering it perfectly scorable (Fig. 1d). The two labs independently assayed for such loci, and manu-ally adjusted the cluster assignments where necessary. By assessing the number of polymorphic markers that showed a cluster pattern that was indicative of a single copy locus, with three possible allelic states (homozygous allele AA, heterozygous AB, and homozygous allele BB) distributed over the entire theta space (difference between mean AA θ and mean BB θ >0.6), between 34,248 (TraitGenetics) and 37,536 (AAFC Saskatoon) loci were determined to be effectively genome specific. For a small number of mark-ers, fluorescence was observed for only one allele, which could be informative in certain populations, but would be unable to detect heterozygous individuals (Fig. 1e). In total, 47,304 markers were defined as scorable and are retained in the current B. napus cluster file.
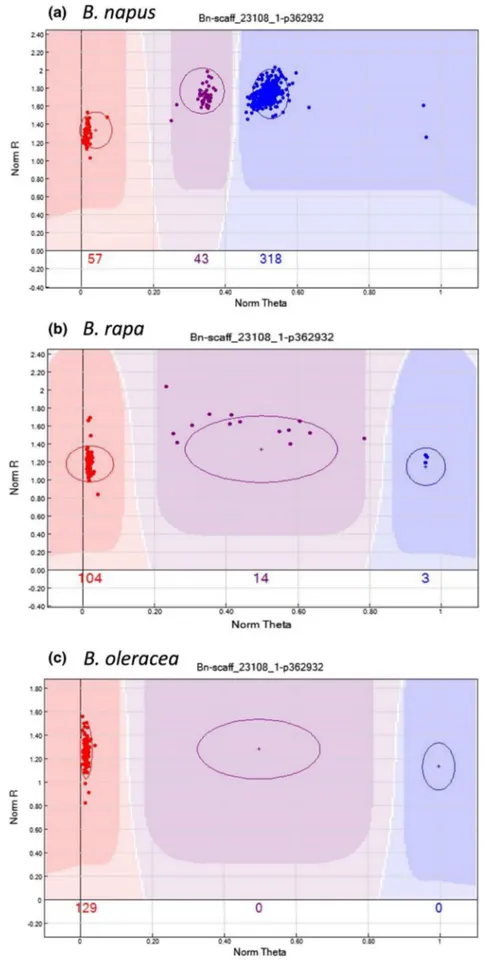
Diploid samples included in the initial analysis indicated that a subset of the loci could not be scored accurately in the diploids using the B. napus cluster file (Fig. 2a–c). To facilitate the use of the Brassica array for scoring in the dip-loid ancestors, 129 B. oleracea lines, hybrids and represent-ative segregating material, and 121 B. rapa lines, F1s and
representative segregating material were analysed with the array. Based on these results, cluster files for the two ances-tral species were generated, mainly based on modified clus-ter positions for those markers that were not genome spe-cific. The final cluster file for B. oleracea contained 26,504 scorable markers of which 21,113 were polymorphic in the investigated material, and the B. rapa cluster file contained 29,720 scorable markers of which 22,695 were polymorphic in the investigated material (Supplementary Table 2).
Physical and genetic positions of SNPs on Brassica genomes
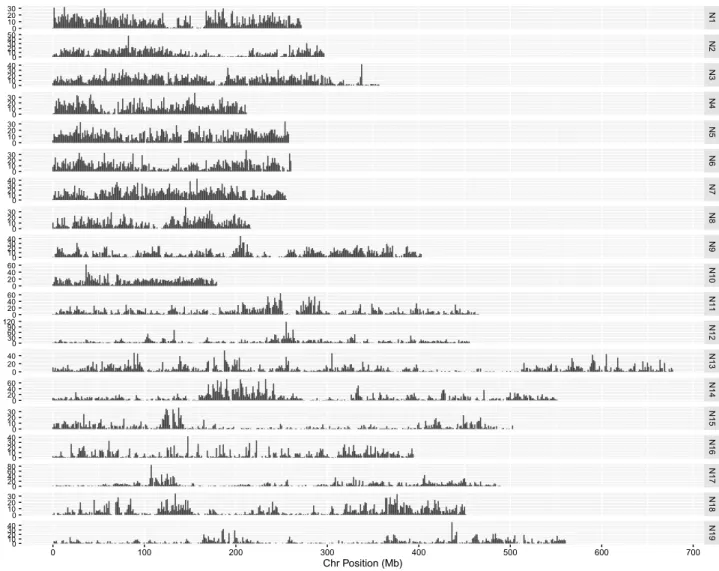
The physical positions of the assayed loci in the diploid A and C genomes were determined during the SNP calling process, based on unique read mapping to the reference sequence set, consisting of the A genome of B. rapa (Wang et al. 2011) and the C genome of B. oleracea (Parkin et al. 2014). The physical position was also determined in two recently completed B. napus genomes, one a winter type (Chalhoub et al. 2014) and the second a spring type (Parkin et al. unpublished), by aligning the DNA flanking each of the SNP loci to each genome using BLAT (Kent 2002). The best hit and associated percent identity of the match for each genome were then extracted from the BLAT results. Based on a percent identity of at least 85 %, 50,255 SNPs were positioned in the spring-type genome sequence and 49,794 were positioned in the winter-type genome sequence. Tak-ing both genome sequences together, a total of 51,172 SNPs could be matched to one or both B. napus genomes (Fig. 3).
It was recognized that the length of the query sequence could lead to ambiguities or erroneous matches due to the highly redundant nature of each genome. The latter would be particularly true for matches to the B. napus genome, where in addition to the strong homology between the two constituent genomes, there are also regions of effective identity resulting from homoeologous exchanges between the A and C genomes (Chalhoub et al. 2014). Based on the BLAT scores, 22,258 and 23,191 SNPs could be unambigu-ously positioned on the A and C genomes, respectively, while 2138 were placed on either the A or C with equal probability (Supplementary Table 3). In addition, 4570 SNPs could not be positioned on the pseudo-chromosomes as a result of either missing data in B. napus or the align-ment of the SNP sequence to an unanchored scaffold in one or both B. napus genomes. The SNP loci were largely found in non-coding regions, although 17,955 lay within annotated gene sequences, only 8681 of which were positioned within an exon (Supplementary Table 4).
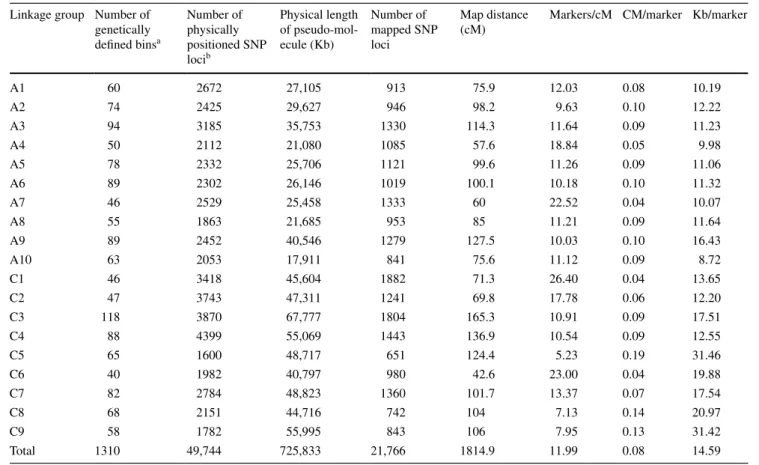
To genetically position 21,766 (46 %) of the SNP loci, the highly polymorphic SG DH population derived from a cross between a resynthesized B. napus and an estab-lished B. napus line was used (Supplementary Tables 5 and 6). Based on informative recombination events, these loci were placed in 1310 bins across the 19 linkage groups and covered a length of 1815 cM (Table 2). The loci were distributed with on average one marker every 0.15 cM or less (Table 2). There were a number of genetically defined bins with a higher than average density of markers, which tended to cluster together and were associated with regions of low recombination, predominantly found in the vicinity of the presumed centromeric regions (Fig. 3).
Only markers that were positioned both genetically and physically could be definitively positioned on the B.
napus genome. In general, there was good
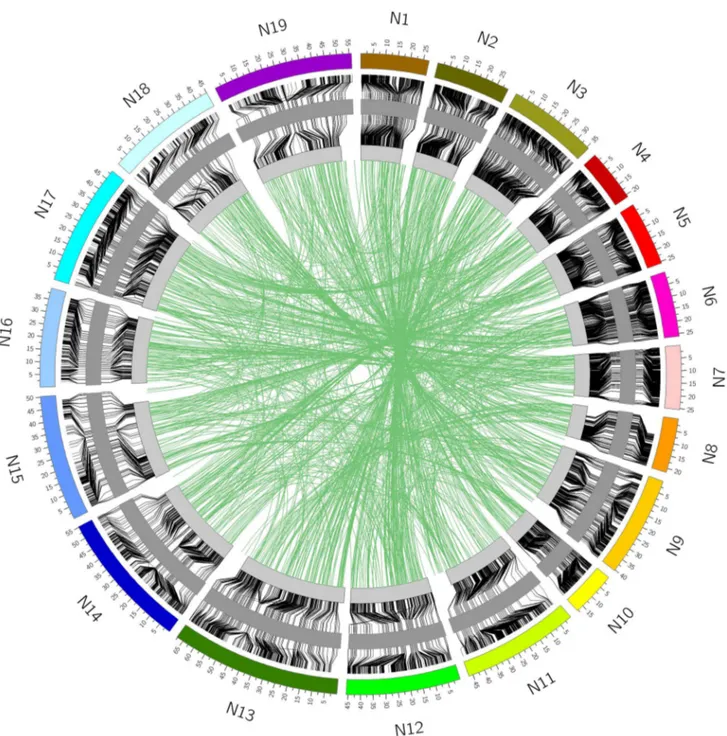
correspond-ence between the two, with 20,138 of the 21,766 (93 %) SNP loci genetically mapping to the position expected based on sequence alignment. In addition, 3 % of loci that were physically mapped to one position were geneti-cally mapped to the homoeologous region of the genome (Fig. 4). The remaining 4 % did not match either the expected physical position or the homoeologous position. Some of these loci were genetically mapped to unanchored
B. napus scaffolds, but others mapped to a different
posi-tion in B. napus than expected based on the diploid genome from which the SNP probe was designed, suggesting incon-sistencies with the original assemblies. This was particu-larly true for the B. rapa genome where genomic regions of varying sizes (0.1–1.1 Mb) were found to be anchored to the wrong chromosome relative to the two B. napus genome sequences (Supplementary Table 3). This is likely due to the relatively low marker density that was used to anchor the B. rapa genome assembly (Wang et al. 2011).
Fig. 2 GenomeStudio images
showing representative SNP cluster patterns in the different Brassica species for the marker Bn-scaff_23108_p362932. One parental allele is coloured in red (AA), the second in blue (BB), and heterozygotes in purple. The SNP marker is polymor-phic, but not genome-specific in B. napus, a resulting in con-densed clusters due to the detec-tion of the homoeologous locus on the other genome. In the diploid B. rapa, b this marker is polymorphic and shows widely distributed clusters (no second homoeologous locus detected, typical diploid pattern). In B. oleracea material, this marker is monomorphic
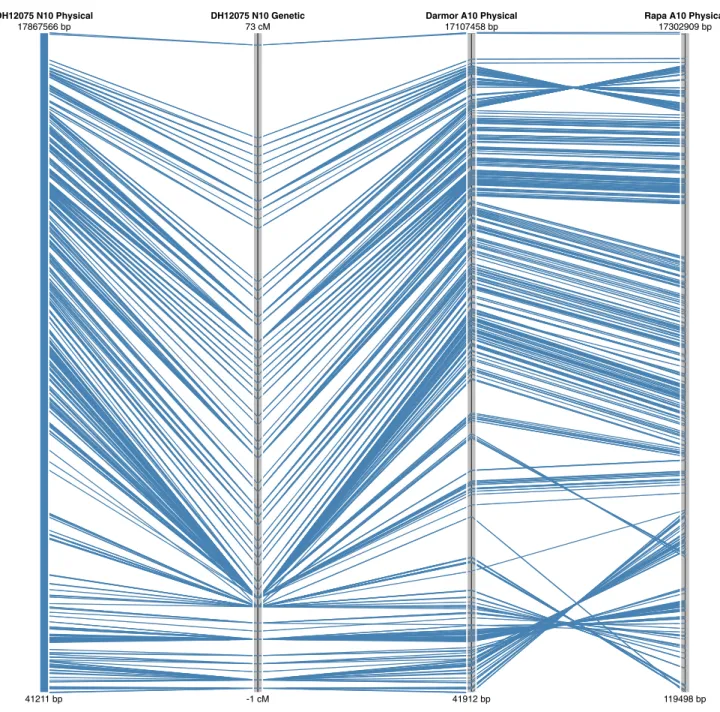
It is possible that some differences between the genomes could reflect true chromosomal rearrangements; indeed, the relatively large inversion found to differentiate both ends of A10 from N10, could be evidence of such an event, since it appears common to both B. napus genotypes (Fig. 5). How-ever, a similar but smaller inversion at the top of A7/N7 is specific to only the Darmor bzh B. napus genotype (Sup-plementary Table 3). The physical and genetic positions of the SNP loci have been imported into a web tool that visualizes these alignments (http://aafc-aac.usask.ca/Bn60). Particular regions of the genome can be selected to identify potentially useful SNP loci in any region of interest.
Discussion
The recent release of three Brassica crop genome sequences has provided opportunities for the development and
application of new breeding tools. The complexity of the B.
napus genome becomes evident when carrying out genetic
mapping even for relatively simple quality-based traits, where multiple loci control their expression. To dissect and follow genetically, complex traits within Brassica breeding programs robust sequence-based markers are required. The high-throughput genotyping array described here offers an excellent platform for facilitating such analyses and allows ready access to a set of well-characterised markers.
The SNP pipeline used to develop the majority (approxi-mately 74 %) of the assays on the Brassica array included a number of steps to limit the impact of genome duplica-tion and allopolyploidy on the resultant design. Reference mapping of short-read sequences to the constituent diploid genomes was optimised to prevent matching to homoeolo-gous regions, sequence variation was avoided in the imme-diate proximity of the target SNP, and regions where mul-tiple alleles were identified were excluded, all limiting the
0 10 20 30 0 10 20 30 40 50 0 10 20 30 40 0 10 20 30 0 10 20 30 0 10 20 30 0 10 20 30 40 0 10 20 30 0 10 20 30 40 0 20 40 60 0 20 40 60 0 30 60 90 120 0 20 40 0 20 40 60 0 10 20 30 0 10 20 30 40 0 20 40 60 80 0 10 20 30 0 10 20 30 40 N1 N2 N3 N4 N5 N6 N7 N8 N9 N10 N11 N12 N13 N14 N15 N16 N17 N18 N19 0 100 200 300 400 500 600 700 Chr Position (Mb) SNP Count
Fig. 3 Physical distribution of SNP loci across the B. napus genome. The SNP loci were aligned to the genome of spring-type DH12075 based
calling of paralogous SNPs. The final step of remapping the oligonucleotide probe for each SNP assay back to the reference genomes and selecting those with the lowest copy number further facilitated the design of the array, since 81 % of the SNPs that matched only once in the B. napus genome produced genome-specific three cluster patterns. Approximately 58 % of all assays produced clear genome-specific genotype calls for a wide range of B. napus geno-types, including F1 individuals. This is a marked improve-ment over similar arrays designed for hexaploid and tetraploid wheat where not more than 25.5 % of the SNP assays produced clear genome-specific cluster patterns (Wang et al. 2014). However, the stringency of the design pipeline limited the variation available to be employed for the array design, effectively reducing the number of ini-tial SNPs by 99 %. This high level of attrition could cause some marker selection bias. Thus, to achieve an optimal density of markers across the genome, pre-validated SNP assays, which matched two or more regions of the refer-ence genome, were also included.
Upon testing B. napus cultivars originating from multiple continents and covering the range of annual and biennial types, the SNP assays proved to be highly
polymorphic, with only 3.5 % monomorphic loci identi-fied indicating the value of the selected SNPs. This was also confirmed independently in a recently published work that used the array to assess diversity within a collection of predominantly Asian B. napus lines (Qian et al. 2014). The array was tested through the generation of a dense SNP map for B. napus with 21,766 (46 %) of the loci mapped in one DH population. Due to the design process, each of the SNP loci was physically anchored to a specific base-pair position in one or other of the diploid progenitor genomes (Supplementary Table 3). On extending this analyses to B.
napus, however, the alignment of only the isolated short
SNP regions to the genome sequence introduced a level of ambiguity, with some SNPs being equally likely to align, or in the case of the assays, hybridise to the A or C genome of
B. napus. In addition, due to the prevalent homoeologous
recombination events which have occurred during the evo-lution of B. napus (Chalhoub et al. 2014), it was expected that some SNPs may map to alternate orthologous positions in different B. napus genotypes. Comparing the genetic and physical position for each of the SNP loci, it was found that 3 % of the loci were genetically mapped to a homoeolo-gous region relative to their physically defined coordinates
Table 2 Distribution of genetically and physically positioned SNP loci in the B. napus genome
a
The genetic map position is based on mapping data from the SG DH population
b
The physical position is based on the original reference mapped position in the diploid genome sequences Linkage group Number of
genetically defined binsa Number of physically positioned SNP locib Physical length of pseudo-mol-ecule (Kb) Number of mapped SNP loci Map distance (cM)
Markers/cM CM/marker Kb/marker
A1 60 2672 27,105 913 75.9 12.03 0.08 10.19 A2 74 2425 29,627 946 98.2 9.63 0.10 12.22 A3 94 3185 35,753 1330 114.3 11.64 0.09 11.23 A4 50 2112 21,080 1085 57.6 18.84 0.05 9.98 A5 78 2332 25,706 1121 99.6 11.26 0.09 11.06 A6 89 2302 26,146 1019 100.1 10.18 0.10 11.32 A7 46 2529 25,458 1333 60 22.52 0.04 10.07 A8 55 1863 21,685 953 85 11.21 0.09 11.64 A9 89 2452 40,546 1279 127.5 10.03 0.10 16.43 A10 63 2053 17,911 841 75.6 11.12 0.09 8.72 C1 46 3418 45,604 1882 71.3 26.40 0.04 13.65 C2 47 3743 47,311 1241 69.8 17.78 0.06 12.20 C3 118 3870 67,777 1804 165.3 10.91 0.09 17.51 C4 88 4399 55,069 1443 136.9 10.54 0.09 12.55 C5 65 1600 48,717 651 124.4 5.23 0.19 31.46 C6 40 1982 40,797 980 42.6 23.00 0.04 19.88 C7 82 2784 48,823 1360 101.7 13.37 0.07 17.54 C8 68 2151 44,716 742 104 7.13 0.14 20.97 C9 58 1782 55,995 843 106 7.95 0.13 31.42 Total 1310 49,744 725,833 21,766 1814.9 11.99 0.08 14.59
(Fig. 4). Further studies with the array are likely to uncover additional ambiguities that should be considered when uti-lising the array for analyses, especially when the loci can-not be genetically anchored in the population or specific genotypes being queried.
Although not specifically designed for this purpose, assessment of the array using DNA from the diploid
genomes of B. oleracea and B. rapa demonstrated its value for genetic analysis of these two important vegetable crop species. Although, the genome specificity of many of the markers could be seen as a disadvantage, since those spe-cific for the other genome result in failed assays, there are still 26,504 and 29,720 clearly scorable markers for B.
oleracea and B. rapa, respectively. In addition, despite the
Fig. 4 Relationship between the physical and genetic positions
of the SNP loci in B. napus. The inner circle represents the genetic map which is flanked to the outside by the physical position in the spring-type DH12075 and to the inside by the physical position in the
winter-type Darmor bzh. The green lines connecting across the centre of the circle represent those loci that are genetically positioned to an alternate (mostly homoeologous) position compared to their physical coordinates in the genome sequence
analysed sample number being lower, 21,113 and 22,695 markers were shown to be polymorphic in B. oleracea and
B. rapa, respectively, demonstrating the utility of the array
for these two diploid species. Indeed, this was confirmed through the recent generation of a genetic map for B.
olera-cea using the array (Brown et al. 2014).
Although the array offers relatively good coverage of the B. napus genome with the SNP loci physically distrib-uted across each of the chromosomes at an approximate density of 1 marker every 15 Kb based on the diploid genome length, there was a significant sub-genome bias
observed with a higher density in the A compared to the C genome (one marker every 11 Kb cf. 19 Kb) (Table 2). The genetic map was based on a highly polymorphic cross allowing almost 50 % of the SNP loci to be positioned on the B. napus genome. The genetic map showed only small gaps with five ≥9 cM. However, when considering the physical distribution of the mapped loci, each chromosome apart from N3 and N5 had at least one interval greater than 500 Kb, these larger intervals were also biased to the C genome with 89 % (140/158) of such intervals being local-ized to the C genome. This could reflect differing levels
DH12075 N10 Physical DH12075 N10 Genetic Darmor A10 Physical Rapa A10 Physical
41211 bp 17867566 bp -1 cM 73 cM 41912 bp 17107458 bp 119498 bp 17302909 bp
Fig. 5 Alignment of the genetic map for linkage group N10 of B. napus with the genome sequence of the equivalent chromosome in the two
of genetic variation between the sub-genomes of B. napus, as observed by others (Delourme et al. 2013; Qian et al. 2014) or may suggest further optimisation of the array should focus on selection of C genome loci. Neverthe-less, any bias in distribution of loci should be considered in downstream applications using the array. Once aligned to B. napus, this distribution did not change markedly and no large physical gaps were observed based on the overall marker selection (Fig. 3). The saturated cover-age is partly a reflection of the genome organisation, with extensive blocks of repetitive elements largely limited to the pericentromeric regions. In addition, although 34.4 % (17,955) of the SNP loci fall within annotated genes, the array design did not focus on functional SNPs, which can bias the marker distribution. In maize, a similar high-den-sity array was developed that targeted genic regions and even bearing in mind the greater genome size, there were significant gaps in the physical SNP coverage on many chromosomes of at least 1 Mb per chromosome (Ganal et al. 2011). Alignment of the physical and genetic maps for B. napus showed good collinearity; however, a num-ber of rearrangements were noted on comparison with the diploid genomes. Although, some of these can be attrib-uted to artifacts of the genome assembly process in each species, the larger rearrangements that are common to the two B. napus genomes may indicate chromosomal changes that have occurred since the fusion of the two progenitor genomes in the B. napus nucleus (Fig. 5).
The Brassica 60 K Infinium array provides a robust and efficient tool for genetic studies in B. napus. Due to the natural and breeding bottlenecks created in modern
Bras-sica germplasm much emphasis is now placed on capturing the wider allelic diversity within the species gene pool (Bus et al. 2011). Genome-wide association studies (GWAS) in a number of other crop species have suggested the value of such analyses for exploiting untapped variation to identify causative loci for key economic traits (Cook et al. 2012; Zhao et al. 2011). An essential prerequisite for GWAS is the ability to query genome-wide polymorphisms that are spaced, such that the analyses are not limited by the observ-able linkage disequilibrium (LD) in the species of interest. More recent estimates for B. napus suggest LD breakdown across the genome, ranging from 0.3 to 1.7 cM (Delourme et al. 2013) and 0.25–2.5 Mb (Qian et al. 2014) with LD decaying more rapidly in the A genome. The distribution of SNP loci across the genome, which lie well within the cur-rent LD estimates, should facilitate the use of the array for GWAS or QTL mapping to identify genes underlying traits of interest. The demonstration of the utility of the array within B. napus as well as its diploid ancestors B. oleracea and B. rapa indicates that the developed array can be used in the entire crossing range of these three species, provid-ing a valuable tool for Brassica breedprovid-ing applications.
Author contribution statement WEC completed
bioin-formatics analyses to generate the array design. EEH, JP, and RW carried out experimental work to complete the cluster files. EEH created the genetic map. YK assisted with SNP data analyses. CS, RL, and FI-L generated data that were used in the SNP design. JB, DE, JM, JP, BL, WC, ED, SR, RJS and BS contributed SNP assays to the array design and were members of the consortium that agreed the array design. JB and JM also provided material for cluster file optimisation. CTL, AS, and MWG participated in study design, and helped edit the manuscript. All authors read and approved the manuscript. IAPP coordinated the design process, analysed data, and wrote the manuscript.
Acknowledgments The authors would like to acknowledge funding
support from the Brassica SNP Consortium (Agriculture and Agri-Food Matching Initiative Investment and industry partners). Research at TraitGenetics was supported in part by the Grant 0315639A from the Ministry of Education and Research (BMBF) and research in China was funded in part by National Basic Research and Develop-ment Program of China (2006CB101600).
Compliance with ethical standards
Conflict of interest The authors MWG, RW, and JP have competing
commercial interests as members of TraitGenetics GmbH which is a company that offers marker development and analysis (including this array) for commercial purposes. This does not alter the authors’ adher-ence to sharing data.
Open Access This article is distributed under the terms of the
Crea-tive Commons Attribution 4.0 International License ( http://crea-tivecommons.org/licenses/by/4.0/), which permits unrestricted use, distribution, and reproduction in any medium, provided you give appropriate credit to the original author(s) and the source, provide a link to the Creative Commons license, and indicate if changes were made.
References
Brown AF, Yousef GG, Chebrolu KK, Byrd RW, Everhart KW, Thomas A, Reid RW, Parkin IA, Sharpe AG, Oliver R, Guzman I, Jackson EW (2014) High-density single nucleotide polymor-phism (SNP) array mapping in Brassica oleracea: identification of QTL associated with carotenoid variation in broccoli florets. TAG Theor Appl Genet Theoretische und angewandte Genetik 127:2051–2064
Bus A, Korber N, Snowdon RJ, Stich B (2011) Patterns of molecu-lar variation in a species-wide germplasm set of Brassica napus. TAG Theor Appl Genet Theoretische und angewandte Genetik 123:1413–1423
Bus A, Hecht J, Huettel B, Reinhardt R, Stich B (2012) High-through-put polymorphism detection and genotyping in Brassica napus using next-generation RAD sequencing. BMC Genom 13:281 Chalhoub B, Denoeud F, Liu S, Parkin IAP, Tang H, Wang X, Chiquet
J, Belcram H, Tong C, Samans B, Correa M, Da Silva C, Just J, Falentin C, Koh CS, Le Clainche I, Bernard M, Bento P, Noel B, Labadie K, Alberti A, Charles M, Arnaud D, Guo H, Daviaud C, Alamery S, Jabbari K, Zhao M, Edger PP, Chelaifa H, Tack D,
Lassalle G, Mestiri I, Schnel N, Le Paslier MC, Fan G, Renault V, Bayer PE, Golicz AA, Manoli S, Lee TH, Thi VH, Chalabi S, Hu Q, Fan C, Tollenaere R, Lu Y, Battail C, Shen J, Sidebottom CH, Wang X, Canaguier A, Chauveau A, Berard A, Deniot G, Guan M, Liu Z, Sun F, Lim YP, Lyons E, Town CD, Bancroft I, Wang X, Meng J, Ma J, Pires JC, King GJ, Brunel D, Delourme R, Renard M, Aury JM, Adams KL, Batley J, Snowdon RJ, Tost J, Edwards D, Zhou Y, Hua W, Sharpe AG, Paterson AH, Guan C, Wincker P (2014) Plant genetics. Early allopolyploid evolu-tion in the post-Neolithic Brassica napus oilseed genome. Sci-ence 345:950–953
Clarke WE, Parkin IAP, Gajardo HA, Gerhardt DJ, Higgins E, Side-bottom C, Sharpe AG, Snowdon RJ, Federico ML, Iniguez-Luy FL (2013) Genomic DNA enrichment using sequence capture microarrays: a novel approach to discover sequence nucleotide polymorphisms (SNP) in Brassica napus L. PLoS One 8:e81992 Cook JP, McMullen MD, Holland JB, Tian F, Bradbury P, Ross-Ibarra
J, Buckler ES, Flint-Garcia SA (2012) Genetic architecture of maize kernel composition in the nested association mapping and inbred association panels. Plant Physiol 158:824–834
Dalton-Morgan J, Hayward A, Alamery S, Tollenaere R, Mason AS, Campbell E, Patel D, Lorenc MT, Yi B, Long Y, Meng J, Raman R, Raman H, Lawley C, Edwards D, Batley J (2014) A high-throughput SNP array in the amphidiploid species Brassica napus shows diversity in resistance genes. Funct Integr Genom-ics 14:643–655
Delourme R, Falentin C, Fomeju BF, Boillot M, Lassalle G, Andre I, Duarte J, Gauthier V, Lucante N, Marty A, Pauchon M, Pichon JP, Ribiere N, Trotoux G, Blanchard P, Riviere N, Martinant JP, Pauquet J (2013) High-density SNP-based genetic map develop-ment and linkage disequilibrium assessdevelop-ment in Brassica napus L. BMC Genom 14:120
Deschamps S, Llaca V, May GD (2012) Genotyping-by-sequencing in plants. Biology 1:460–483
Dixon GR (2006) Origins and diversity of Brassica and its relatives. Crop production science in horticulture 14. CABI, Wallingford, pp 1–33
Ganal MW, Altmann T, Roder MS (2009) SNP identification in crop plants. Curr Opin Plant Biol 12:211–217
Ganal MW, Durstewitz G, Polley A, Berard A, Buckler ES, Charcos-set A, Clarke JD, Graner EM, Hansen M, Joets J, Le Paslier MC, McMullen MD, Montalent P, Rose M, Schon CC, Sun Q, Walter H, Martin OC, Falque M (2011) A large maize (Zea mays L.) SNP genotyping array: development and germplasm genotyping, and genetic mapping to compare with the B73 reference genome. PLoS One 6:e28334
Ganal MW, Polley A, Graner EM, Plieske J, Wieseke R, Luerssen H, Durstewitz G (2012) Large SNP arrays for genotyping in crop plants. J Biosci 37:821–828
Harper AL, Trick M, Higgins J, Fraser F, Clissold L, Wells R, Hat-tori C, Werner P, Bancroft I (2012) Associative transcriptomics of traits in the polyploid crop species Brassica napus. Nat Bio-technol 30:798–802
Iniguez-Luy F, Federico M (2011) The Genetics of Brassica napus. In: Schmidt R, Bancroft I (eds) Genetics and genomics of the brassicaceae. Springer, New York, pp 291–322
Jannink J-L, Lorenz AJ, Iwata H (2010) Genomic selection in plant breeding: from theory to practice. Brief Funct Genom 9:166–177 Kent WJ (2002) BLAT—the BLAST-like alignment tool. Genome
Res 12:656–664
Lander ES, Green P, Abrahamson J, Barlow A, Daly MJ, Lincoln SE, Newberg LA (1987) MAPMAKER: an interactive computer
package for constructing primary genetic linkage maps of exper-imental and natural populations. Genomics 1:174–181
Murray MG, Thompson WF (1980) Rapid isolation of high molecular weight plant DNA. Nucl Acids Res 8:4321–4325
Parkin IA, Clarke WE, Sidebottom C, Zhang W, Robinson SJ, Links MG, Karcz S, Higgins EE, Fobert P, Sharpe AG (2010) Towards unambiguous transcript mapping in the allotetraploid Brassica napus. Genome 53:929–938
Parkin IAP, Koh C, Tang H, Robinson SJ, Kagale S, Clarke WE, Town CD, Nixon J, Krishnakumar V, Bidwell SL, Denoeud F, Belcram H, Links MG, Just J, Clarke C, Bender T, Huebert T, Mason AS, Pires JC, Barker G, Moore J, Walley PG, Manoli S, Batley J, Edwards D, Nelson MN, Wang X, Paterson AH, King G, Bancroft I, Chalhoub B, Sharpe AG (2014) Transcriptome and methylome profiling reveals relics of genome dominance in the mesopolyploid Brassica oleracea. Genome Biol 15:R77 Qian L, Qian W, Snowdon RJ (2014) Sub-genomic selection patterns
as a signature of breeding in the allopolyploid Brassica napus genome. BMC Genom 15:1170
Snowdon RJ, Iniguez Luy FL (2012) Potential to improve oilseed rape and canola breeding in the genomics era. Plant Breeding 131:351–360
UN (1935) Genome analysis in Brassica with special reference to the experimental formation of B. napus and peculiar mode of fertili-zation. Japan J Bot 7:389–452
Wang X, Wang H, Wang J, Sun R, Wu J, Liu S, Bai Y, Mun JH, Ban-croft I, Cheng F, Huang S, Li X, Hua W, Wang J, Wang X, Freel-ing M, Pires JC, Paterson AH, Chalhoub B, Wang B, Hayward A, Sharpe AG, Park BS, Weisshaar B, Liu B, Li B, Liu B, Tong C, Song C, Duran C, Peng C, Geng C, Koh C, Lin C, Edwards D, Mu D, Shen D, Soumpourou E, Li F, Fraser F, Conant G, Las-salle G, King GJ, Bonnema G, Tang H, Wang H, Belcram H, Zhou H, Hirakawa H, Abe H, Guo H, Wang H, Jin H, Parkin IA, Batley J, Kim JS, Just J, Li J, Xu J, Deng J, Kim JA, Li J, Yu J, Meng J, Wang J, Min J, Poulain J, Wang J, Hatakeyama K, Wu K, Wang L, Fang L, Trick M, Links MG, Zhao M, Jin M, Ram-chiary N, Drou N, Berkman PJ, Cai Q, Huang Q, Li R, Tabata S, Cheng S, Zhang S, Zhang S, Huang S, Sato S, Sun S, Kwon SJ, Choi SR, Lee TH, Fan W, Zhao X, Tan X, Xu X, Wang Y, Qiu Y, Yin Y, Li Y, Du Y, Liao Y, Lim Y, Narusaka Y, Wang Y, Wang Z, Li Z, Wang Z, Xiong Z, Zhang Z, Brassica rapa Genome Sequencing Project Consortium (2011) The genome of the mes-opolyploid crop species Brassica rapa. Nat Genet 43:1035–1039 Wang S, Wong D, Forrest K, Allen A, Chao S, Huang BE, Maccaferri
M, Salvi S, Milner SG, Cattivelli L, Mastrangelo AM, Whan A, Stephen S, Barker G, Wieseke R, Plieske J, International Wheat Genome Sequencing C, Lillemo M, Mather D, Appels R, Dolferus R, Brown-Guedira G, Korol A, Akhunova AR, Feuillet C, Salse J, Morgante M, Pozniak C, Luo M-C, Dvorak J, Morell M, Dubcov-sky J, Ganal M, Tuberosa R, Lawley C, Mikoulitch I, Cavanagh C, Edwards KJ, Hayden M, Akhunov E (2014) Characterization of polyploid wheat genomic diversity using a high-density 90 000 sin-gle nucleotide polymorphism array. Plant Biotechnol J 12:787–796 Wu Y, Bhat PR, Close TJ, Lonardi S (2008) Efficient and accurate
construction of genetic linkage maps from the minimum span-ning tree of a graph. PLoS Genet 4:e1000212
Zhao K, Tung CW, Eizenga GC, Wright MH, Ali ML, Price AH, Nor-ton GJ, Islam MR, Reynolds A, Mezey J, McClung AM, Bus-tamante CD, McCouch SR (2011) Genome-wide association mapping reveals a rich genetic architecture of complex traits in Oryza sativa. Nat Commun 2:467