HAL Id: hal-01758660
https://hal.archives-ouvertes.fr/hal-01758660v2
Submitted on 24 Apr 2018HAL is a multi-disciplinary open access archive for the deposit and dissemination of sci-entific research documents, whether they are pub-lished or not. The documents may come from teaching and research institutions in France or abroad, or from public or private research centers.
L’archive ouverte pluridisciplinaire HAL, est destinée au dépôt et à la diffusion de documents scientifiques de niveau recherche, publiés ou non, émanant des établissements d’enseignement et de recherche français ou étrangers, des laboratoires publics ou privés.
Broadband infrastructure deployment, digital
vulnerability, and local firm performance in developing
and transition countries
Joel Cariolle, Maëlan Le Goff, Olivier Santoni
To cite this version:
Joel Cariolle, Maëlan Le Goff, Olivier Santoni. Broadband infrastructure deployment, digital vulner-ability, and local firm performance in developing and transition countries. 2018. �hal-01758660v2�
fondation pour les études et recherches sur le développement international
LA FERDI EST UNE FOND
ATION REC ONNUE D ’UTILITÉ PUBLIQUE . ELLE ME T EN ŒUVRE A VEC L ’IDDRI L ’INITIA TIVE POUR LE DÉ VEL OPPEMENT E
T LA GOUVERNANCE MONDIALE (IDGM).
ELLE C
OORDONNE LE LABEX IDGM+ QUI L
’ASSOCIE A U CERDI E T À L ’IDDRI. CE TTE PUBLIC ATION A BÉNÉFICIÉ D ’UNE AIDE DE L ’É TA T FR ANC AIS GÉRÉE P AR L ’ANR A U TITRE DU PR OGR A MME «INVESTISSEMENT S D ’A VENIR» POR
TANT LA RÉFÉRENCE «ANR-10-LABX
-14-01».
* Revised version
March 2018
Broadband infrastructure
deployment, digital vulnerability,
and local firm performance in
developing and transition countries
Joël Cariolle, Maëlan Le Goff, and Olivier Santoni
Joël Cariolle, Research officer at FERDI.
E-mail : [email protected] (corresponding author) Maëlan Le Goff, Research officer at Banque de France. E-mail : [email protected]
Olivier Santoni is Geomatician at FERDI. E-mail : [email protected]
Abstract
This paper provides evidence on the impact of fast Internet on firm performance
in developing and transition economies. Over the last three decades, international
connectivity has been boosted by the laying of more than 300 submarine
telecommunications cables (SMC). Almost all coastal developing and transition
countries are plugged into the global Internet, so the remaining structural impediments
to the Internet economy’s growth are twofold: first, the digital isolation induced by the
distance of Internet users from key telecommunications infrastructures; and second,
the country’s exposure to SMC outages.
… /…
Keywords: NICT, submarine cables, infrastructures, telecommunications, firm performance JEL codes: F02, O11, O33, O18, L25, L96
Acknowledgements
We would like to thank Raphaël Paris (Laboratoire Magma Volcan – UCA, CNRS) for the insightful discussions we had on seismic risk
loca-Dev
elopment Po
lic
ie
s
Wo
rkin
195
g Paper
July 2017 *…/… We therefore adopt an instrumental variable (IV) approach reflecting these two sources of digital vulnerability. Exploiting the hierarchical structure of the World Bank Enterprise Survey dataset, multilevel IV estimations are conducted on a large sample of firms from more than 2,600 locations in some 60 developing and transition countries. They stress the large local impacts of an increase in the local incidence of email use by firms, induced by a lesser digital vulnerability, on a firm’s average annual sales and sales per worker, and, to a lesser extent, on temporary employment. Estimated relationships are robust across a range of alternative sampling and specifications.
1- Introduction
Over the last few decades, international connectivity underwent a dramatic improvement promoted by the laying of 321 fibre submarine cables (SMC) over 1990–2015. Today, more than 99% of the world’s telecommunications – Internet content, phone and video calls, classified diplomatic messages – passes through SMCs. And according to the OECD (Weller & Woodcock, 2013), in 2013, “20 households with average broadband usage generate as much traffic as the entire Internet carried in 1995”. SMC international networks now irrigate a USD 20.4 trillion industry and connect 3 billion Internet users across the world (Towela & Tesfaye, 2015).
Almost all coastal developing and transition countries are now plugged into the global Internet through SMCs. Fast-growing Asian and South American countries have been rapidly connected to Northern economies, and Africa’s digital isolation from the rest of the world has rapidly fallen since 2005. This rapid expansion of the international broadband infrastructure network and the following boom in Internet services raises strong expectations for many low-income countries’ economic catch-up, notably, through its potential for fostering innovation, productivity, trade, and job creation.
In the 2000s, a first strand of the literature started to study the macro-level effect of Internet penetration rates on international trade, in the wake of the “Internet bubble” and the financial collapse that followed. These studies generally find a positive effect of Internet access on trade in developing countries (Freund & Weinhold, 2002, 2004), especially on exports (Clarke & Wallsten, 2006) and, more specifically, service exports (Choi, 2010). Other macro-level studies have pointed out the contribution of Internet development to human capital and labour productivity (Cette et al., 2015). Notably, Choi and Yi (2009) assume that the Internet can facilitate knowledge spill-overs and may thus contribute to economic growth. Examining the impact of higher broadband penetration rates in 25 OECD countries, Czernich et al. (2011) get comparable results.
Recent studies have focused on the micro-level effect of Internet access and usage on firms’ outcomes. For example, Clarke (2008) finds that the use of the Internet by firms in Eastern Europe and Central Asia has a significant impact on their decision to export but no effect on their intensive margin. Clarke et al. (2015) show that improved Internet increases firms’ sales growth and labour productivity and that this effect is greater for small firms. In this line of research, Paunov and Rollo
(2015) find that, in 117 developing countries, the intensity of Internet use at the industry level has a significant and positive effect on labour productivity, especially in the most productive firms of the sample. In contrast to these studies, Chowdhury and Wolf (2003) find that ICT investment in three East African countries (Kenya, Tanzania, Uganda) has no direct significant effect on SME performance but a positive effect on general market expansion (measured by an index increasing with the output share sold far away from the local market). Although non-exhaustive, this short literature review points to a positive macro-level effect of Internet expansion on trade and growth in developing countries, supported at the micro-level by evidence on the growth in firms’ sales, exports, and productivity.
This paper tries to bring additional insights into this area of research by providing new evidence on the local impact of improved access to the Internet on three firm outcomes – their revenue, their labour productivity, and their number of temporary employees – in developing and transition countries. To estimate this impact, we propose a novel identification strategy emphasizing the weaknesses of the maritime and terrestrial broadband infrastructure network. In fact, the worldwide deployment of SMCs is boosting the economy in many developing countries; but in parallel, it has reinforced the digital isolation of Internet users in countries facing difficulties expanding and managing large terrestrial infrastructure networks and has increased countries’ exposure to SMC outages. These two dimensions of digital vulnerability – which could be defined as the risk for a country and its population to have their access to the global Internet hampered by failures in their telecommunications network – partly rely on exogenous factors, underlying the instrumental variable (IV) approach adopted in this paper.
How telecommunications “superhighways” impact the economy is not a new question (Röller & Wavermann, 2001). However, to our knowledge, few studies have examined the contribution of the recent deployment of broadband infrastructures to the growth process (Czernich et al., 2010), especially to development outcomes (Hjort & Poulsen, 2017; Tian, 2018). The empirical approach followed in these three papers highlights how terrestrial infrastructure network coverage, preceding the introduction of broadband technologies, is a good predictor of the current access to broadband Internet. Our identification strategy differs from this approach in that (i) comprehensive information on the terrestrial infrastructure network is missing for a large sample of developing and transition countries and (ii) the cross-sectional data from the World Bank Enterprise Surveys (WBES) used in this paper do not allow exploitation of the time dimension to identify exogenous internal variation in Internet access.
Instead, we construct a set of instrumental variables reflecting geographical and geological determinants of the SMC network’s vulnerability and explaining cross-country and cross-location variations in Internet penetration rates. On the one hand, we approximate digital isolation by the geographic distance of Internet users from infrastructure nodes (SMC landing stations or Internet exchange points), building on the general rule stating that the cost of Internet communications is equal to the speed of the Internet times the distance covered (Weller & Woodcock, 2013). In other words, the longer the Internet user’s distance to SMC landing stations, the stronger the need for
terrestrial infrastructure’s deployment and maintenance, the higher the cost passed on Internet communications, and the lower the Internet speed (Nyirenda & Tesfaye, 2015, Bates, 2014; Weller & Woodcock, 2013). On the other hand, in various regions, the maritime infrastructure is exposed to the risk of multiple cable outages caused by seismic events in their neighbourhoods (Carter et al., 2009; Widmer et al., 2010; Palmer-Felgate et al., 2013). The vulnerability of the broadband infrastructure to SMC outages is indeed becoming a major issue for many developed and developing countries, inducing direct and indirect economic costs that amount to tens or hundreds of millions of dollars. Therefore, our identification strategy sheds light on the contribution of these sources of digital vulnerability to Internet penetration rates among firms, putting in evidence of an understudied dimension of the recent high-capacity broadband infrastructure expansion.
Estimations are conducted using WBES data on firms’ characteristics, outcomes, and Internet usage aggregated at the location level. Data aggregation is motivated by two concerns. The first and most important concern is related to network externalities (Röller & Waverman, 2001) by which decisions of firms that are geographically close and carrying out similar activities are probably correlated with each other. Aggregating firm-level data at the location level therefore neutralizes possible endogeneity bias due to geographical network effects. The second concern is related to inference problems caused by the instrumentation of a dichotomous firm-level variable – the firm having used the Internet or not – in the first-stage equation, which lies between 0 and 1 once this variable is aggregated at the location level.
Based on a large sample of firms located in more than 2,600 cities/provinces in some 60 developing and transition countries, single-level and multilevel IV estimations stress that a lower digital vulnerability – induced by a lower digital isolation and a lower exposure to SMC outages – improves Internet penetration rates among firms and thereby boosts their revenue and labour productivity. Empirical evidence also points to a positive, softer, but less robust impact of Internet penetration rates on the number of full-time temporary employees.
Evidence is robust to the exclusion of exporters, big firms, foreign firms, and firms created after SMC arrival, and to the use of another proxy for firms’ access to Internet. Consistent with the view that the telecommunications infrastructure has important externalities (Röller & Waverman, 2001), this paper emphasizes the large effects of broadband Internet at the location level. This evidence also supports that the digital divide, i.e., disparities in the quality of Internet access across different cities or provinces, dampens the effect of improved Internet access on economic outcomes at the macro level. It therefore suggests that the impact of broadband arrival is heterogeneous within countries.
The next section explains how telecommunications infrastructure deployment and digital vulnerability are related and details the instrumental variable setup. The third section sets the empirical framework and the fourth section presents the main results. The fifth section addresses
potential endogeneity bias and checks whether estimated relationships are robust to the use of alternative sampling and specifications. The last section concludes.
Figure 1. International digital connectedness through fibre SMCs
1990 2000
2010 2015
Source: Authors. Data: Telegeography.
2- Telecommunications infrastructure deployment and digital vulnerabilities
In this section, we set up a conceptual framework explaining how the deployment of broadband submarine and terrestrial infrastructures has boosted the Internet economy but has in parallel exposed developing economies to new sources of vulnerabilities: on the one hand, the digital isolation induced by the terrestrial distance between Internet users and existing broadband infrastructures; on the other hand, the network exposure to submarine cable outages. Building on these elements, we define an instrumental variable approach based on geographical and geological determinants of digital vulnerability.
2.1. Telecommunications infrastructure deployment and the Internet access value chain
International connectivity is the first element of the Internet access value chain, presented in Figure 2. In the absence of SMC, a country has two solutions to get international Internet connection: (i)
buying expensive and limited Internet bandwidth from a SMC-connected neighbouring country or (ii) buying expensive, often slow and limited Internet bandwidth from telecommunications satellites.1
Figure 2. Internet access value chain and key telecommunications infrastructures
Source: Authors, adapted from Schumann and Kende (2013).
The laying of SMC infrastructures is therefore the first step towards access to the global Internet and a catalyst for subsequent investments in backbone, middle-mile, and last-mile terrestrial telecommunications infrastructures by making them more profitable (Schumann & Kende, 2013). The number of SMCs plugging countries into the global Internet is expected to boost the Internet economy by affecting the total bandwidth available to Internet users, the cost of Internet services, the competition environment, and a country’s Internet redundancy when cable outages occur (Weller & Woodcock, 2013; Schumann & Kende, 2013; Telegeography, 2016).
Once SMCs are plugged into the coast, Internet exchange points (IXPs) represent a key element of national and regional backbone telecommunications infrastructures and an important source of Internet bandwidth (Weller & Woodcock, 2013; OECD, 2014; Towela & Tesfaye, 2015). IXPs are national or regional Internet hubs where Internet protocol networks can exchange traffic with each other. IXPs allow latency to be reduced by favouring direct interconnections between countries and saving bandwidth for international communications by keeping local traffic locally. By doing this, IXPs also make it possible to carry Internet traffic at low cost, which reduces the cost of providing access to Internet. Therefore, IXPs increase Internet performance and cost-efficiency and are hence a central element of local and regional Internet ecosystems (Weller & Woodcock, 2013; OECD, 2014).
We highlight the contribution of SMCs and IXPs to the Internet economy in Graph 1. This graph shows a positive concave relationship between broadband infrastructures (alternatively measured
1 Although the provision of new broadband Internet services by satellite is growing but still expensive. International connectivity • SMC • Satellite • Regional IXPs National backbone • National IXPs / borders / SMC landing stations • High capacity inter‐city links Middle mile • Telephone exchanges/ central switching locations • mobile base stations • Lower capacity links Last mile • Cell sites/base station sites • Wireline Internet service
by the number of SMCs and the number of IXPs) and Internet penetration rates on the one hand (left-hand side graphs) and the telecommunications sector’s revenue on the other hand (right-hand side graphs). This graphical evidence suggests that SMC and IXP deployment is good news for the telecoms industry and the whole Internet economy. However, the dispersion of observations around the fitted correlation lines also suggests that this relationship relies on other characteristics of the telecommunications infrastructure.
Graph 1. Correlation between SMC/IXP deployment and the Internet economy, worldwide evidence in 2014
Notes: Data on infrastructure deployment are drawn from Telegeography, Packet Clearing House, and Peering DB databases. Data on Internet penetration and revenue are drawn from the International Telecommunication Union (2016). Sample: Share of population using Internet variable: 201 developed and developing countries. All telecommunications revenue variable: 122 developed and developing countries.
2.2. Digital vulnerabilities
We define digital vulnerability as the risk of a country and its population to see their access to the global Internet hampered by failures in their telecommunications network. These failures may result from the telecommunications infrastructure network’s incapacity to meet the population’s needs (in terms of geographical coverage and Internet bandwidth), the infrastructure’s gradual obsolescence, and its exposure to recurrent external shocks. These external shocks encompass telecoms infrastructure failures (network overload, server shutdown, SMC outages, IXP closure), power outages, political censorship, and computer attacks. Building on this definition, this paper emphasises the digital vulnerability resulting from telecommunications infrastructure failures: the digital isolation caused by missing or lacking terrestrial infrastructures and the country’s exposure to SMC outages.2
2.2.1. Digital isolation and the infrastructure gap
In 2016, most developing and transition countries were plugged into the global Internet through SMCs, so the reduction of digital isolation through terrestrial infrastructure deployment is one of the greatest challenges for developing countries’ Internet economies (Röller & Waverman, 2001). Low cross-border connectivity and missing national/regional terrestrial infrastructures are indeed the most important barriers to Internet access in low-income countries (Towela & Tesfaye, 2015; Bates, 2014). To stress the concern of digital isolation in the African context, Bates (2014, p. 2) stated that “fibre connectivity in cities that are far removed from submarine cable landing stations often costs five or six times as much as it does at the landing station”.
Moreover, even in countries where the terrestrial infrastructure is not missing, a general rule according to which the cost of Internet communication equals the speed times the distance covered (Weller & Woodcock, 2013) makes the Internet user’s average distance to the backbone infrastructure a critical determinant of digital isolation (figure 3). As a result, the longer the distance to backbone infrastructure nodes, the stronger the need for additional terrestrial infrastructure deployment and maintenance investments, the higher the cost passed on to Internet communications, the lower the Internet speed, and the greater the digital isolation.
Figure 3. Distance to key infrastructure nodes and Internet cost
Note: Adapted from Weller and Woodcock (2013). Source: Packet Clearing House.
2.2.2. The country’s exposure to SMC outages
A second digital vulnerability is the SMC network’s exposure to cable outages. Between 2008 and 2012, data collected by Palmer-Felgate et al. (2013) show that 471 cable repairs were undertaken worldwide, geographically spread as follow: 186 repairs in the ACMA area (Atlantic Ocean), 115 in the MECMA area (Mediterranean Sea), 93 in the YZ area (Pacific Ocean, Asia side), 68 in the SEAIOCMA (2010-2011, Southeast Asia and Indian Ocean) and nine in the NAZ area (Pacific Ocean, North America side).3 As an illustration of economies’ strong vulnerability to telecommunications
SMC breaks, the simultaneous cut undergone by the SEA-ME-WE 3, SEA-ME-WE 4, and FLAG cables on December 19, 2008, induced a 24-hour outage and a 10-day slowdown of Internet access, affecting millions of people in Europe, the Middle East, South Asia, and even East Africa and causing a dramatic loss of Internet capacity for 14 countries.4
In addition to firms’ direct costs of repairing damaged cables for telecoms operators, amounting to millions of dollars depending on cable repair frequency and length, there are indirect economic costs, rising to tens or hundreds of millions of dollars related to (Widmer et al., 2010; Clark, 2016)
‐ The reporting of repair costs on Internet tariffs and its consequences for Internet penetration;
‐ The rerouting of Internet traffic towards more expensive cable paths and its consequences on Internet capacity and tariffs;
‐ The disorganization of global manufacturing chains and Internet-related service provision (e.g., financial services).
Last but not least, these direct and indirect costs are amplified by delays in cable repairs. According to Palmer-Felgate et al. (2013), these delays vary significantly among maintenance areas and countries and are mainly caused by multiple outages caused by natural events such as earthquakes or typhoons, ships engaged in prior repairs (likely induced by multiple outages), repair permit acquisition delay, or operational issues (Borland, 2008).
2.3. Instrumental variable setup and descriptive evidence
This paper examines the causality of firms’ Internet access on their performance, using as instrumental variables geographical and geological determinants of digital isolation and exposure to SMC outages.
3 Repair agreement areas are displayed in Appendix D.4.
4 According to France Telecom’s press release dating from the 19th of December 2008 (“Three undersea cables cut: traffic greatly disturbed between Europe and Asia/Near East zone”), the following countries have suffered from dramatic Internet disruptions: Saudi Arabia: 55% out of service; Djibouti: 71% out of service; Egypt: 52% out of service; United Arab Emirates: 68% out of service; India: 82% out of service; Lebanon: 16% out of service; Malaysia: 42% out of service; Maldives: 100% out of service; Pakistan: 51% out of service; Qatar: 73% out of service; Syria: 36% out of service; Taiwan: 39% out of service; Yemen: 38% out of service; and Zambia: 62% out of service.
2.3.1. The need for telecommunications infrastructure deployment
As mentioned earlier, the Internet user’s distance to the telecoms infrastructure network is a critical determinant of digital isolation. This observation is not new, as Röller and Waverman (2001) have already emphasized that in larger countries, telecommunications infrastructure investment requirements are higher. Telecommunications infrastructure deployment in large, landlocked, or fragmented territories is therefore more challenging, which constrains states in the provision of cost-efficient Internet services (Weller & Woodcock, 2013). Unfortunately, information on terrestrial backbone infrastructure deployment is not available for all developing and transition countries.5
However, information on the location of SMC landing stations and IXPs is available for most developing and transition countries. Building on this information, we proxy digital isolation at the country and location levels by two variables (Appendix A provides details on variables calculation), respectively:
‐ the country’s structural need for infrastructure deployment, equal to the distance between the
country’s centroid and the closest SMC landing stations. This variable is intended to reflect geographical (and therefore exogenous) factors that will affect investments in infrastructure deployment and management required to bring the Internet in affordable conditions over the territory.
‐ the firm’s need for infrastructure deployment, equal to the firm’s distance from the closest
infrastructure node (IXP or SMC landing station). We consider the firm’s distance from infrastructure together with the country’s structural need for infrastructures.6
To illustrate the difference between the country’s structural need and firms’ need for infrastructures, Appendix D maps China’s centroid, Chinese firms’ location clusters, and China’s IXPs and SMC landing stations’ locations. Graph 2 below plots the 2014 and 2010 correlations between the structural need for telecoms infrastructures variable and the fibre Internet access variable: the share of the population using the Internet on the one hand, and the number of broadband satellite subscriptions on the other hand. Top graphs show a negative correlation between the centroids’ distances to SMC landing stations and Internet penetration rates, while bottom graphs highlight a positive correlation between the centroids’ distances to SMC and subscriptions to satellite broadband Internet, a more expensive alternative to fibre Internet access. This negative relationship between the centroid’s distance to SMC and fibre Internet access finds additional evidence using averaged data on firms’ Internet usage from the World Bank Enterprise Surveys (graph 3). Therefore, a greater structural need for infrastructure is at first sight negatively correlated with Internet access.
5 Open-source data on the backbone infrastructure in Africa are available at/and http://www.africabandwidthmaps.com (Hjort & Poulsen, 2017). We did not find this type of information for other developing and transition areas.
6 based on the observation that “the average distance between an exchange [point] and all of the members of the population it serves is a major measure of the efficiency, and thus the long-term success, of any exchange [point]” (Weller & Woodcock, 2013, p. 40).
Graph 4 plots the WBES sample countries’ averages of firms’ distances to infrastructure nodes against the percentage of the population using the Internet (top graph), the country’s share of firms using email during their operations (bottom left-hand side graph), or the country’s share of firms using websites for their operations (bottom right-hand side graph). All graphs display a negative correlation between the average firm’s infrastructure need and its inclination to use the Internet for its operations.
Graph 2. Correlation between countries’ centroids’ distances to SMC landing stations and Internet access, worldwide evidence in 2010 and 2014
Notes: High-income (dark-coloured) vs. middle- and low-income (light-coloured) countries. Top graphs: 192 countries (2014) and 188 countries (2010). Bottom graphs: 82 countries (2014), 66 countries (2010). The dashed fitted correlation line has been drawn to exclude outliers USA, Canada, and Russia. Data on Internet access proxies drawn from the International Telecommunication Union.
Graph 3. Correlation between countries’ centroids’ distances to SMC landing stations and firms’ Internet usage, evidence from the WBES
Notes: averaged data from 94,750 firms located in 101 developing and transition countries, represented in the left-hand side graph, and from 94,616 firms located in 101 developing and transition countries, in the right-hand side graph. Firms were surveyed between 2006 and 2014.
Graph 4. Country correlation between firms’ average distance to SMC/IXP and Internet use, evidence from ITU data and the WBES
Notes: Top graph uses data on the share of the population using the Internet in 106 developing and transition countries drawn from the International Telecommunication Union (ITU). Bottom graphs use averaged data from 96,840 firms (left) and 96,694 firms (right) from 106 developing and transition countries.
2.3.2. Infrastructures’ exposure to seaquake-induced cable outages
Cable outages result from multiple factors that can be grouped into five sources of external shocks (Carter et al., 2009; Clark, 2016):
‐ Maritime activities (fishing nets, anchors), the main source of all cable faults;
‐ Natural events, such as earthquakes and seaquakes, volcanic eruptions, rising sea levels, and turbidity currents, causing in 2006 around 30% of cable breaks occurring in deep-sea water (probably more today, given the dramatic densification of the undersea cable network), and the main source of multiple cable breaks;
‐ Shark bites and whale entanglements, although the new generation of cables is much less prone to these risks;
‐ Piracy and sabotage.
Among exogenous causes of cable outages, earthquakes and seaquakes are the best documented ones. Seismic activity indeed may cause cable breaks directly or indirectly by provoking turbidities, landslides, and tsunamis (Soh et al., 2004; Carter et al., 2009; Clark, 2016). It is also likely to lengthen the time needed to repair cables by inducing simultaneous multiple outages (Palmer-Felgate et al., 2013). Last, because of their impact on the telecommunications sector’s revenues, the risk of cable breaks induced by the recurrence of earthquakes and seaquakes is generally reported on telecommunications tariffs (Widmer et al., 2010).
Because seismic activity may cause damage to the whole economy and therefore not only the SMC network, our identification strategy focuses more specifically on seaquake occurrence. We exploit information on the location, timing, frequency, and intensity of seaquakes to build a variable of a
country’s exposure to seaquake-induced cable outages: the annual frequency of seaquakes that
occurred within a radius of 1000km from the SMC landing station. To respect identification restrictions, we only count seaquakes with intensity above 5 and exclude observations with seaquake intensity above 6.5 on the Richter scale: below 5, the seaquake might have little effect on the SMC infrastructure, while above 6.5, the seaquake may induce tsunamis that may damage entire coastal areas.7 Appendix D maps the digital vulnerability to seismic risk and the worldwide
occurrence of seaquakes around SMC landing stations between 1990 and 2016.
Graph 5 plots the 2014 and 2010 correlations between the annual frequency of seaquakes within 1000km of SMC landing stations (of countries that experienced at least one seaquake above 5 on the Richter scale) and fibre Internet access proxies – i.e., the share of the population using the Internet and the number (in logarithm) of broadband satellite subscriptions. Top graphs show a
7 The lower bound has been chosen according to the work of Soh et al. (2004), who find that cable breaks occurred in the eastern part of Taiwan following earthquakes ranging from 5.0 to 6.0 on the Richter scale. The upper bound is based on an interview with Dr Raphaël Paris, Research Officer in volcanology at CNRS and Laboratoire Magmas et Volcans (LMV) (Observatoire de Physique du Globe de Clermont-Ferrand, Clermont-Auvergne University), who pointed out that the risk of tsunami becomes significant with seismic activity above 6.5 on the Richter scale.
negative correlation between the countries’ annual frequencies of seaquakes and Internet penetration rates, while bottom graphs highlight a positive correlation between the countries’ annual frequencies of seaquakes and (more expensive) broadband Internet access through satellites. This evidence is corroborated by the graphical correlation between the countries’ exposure to seaquake-induced cable faults and country averages of firm Internet use, displayed in graph 6. Therefore, a greater country exposure to seaquake-induced SMC outages is at first sight negatively correlated with Internet access.
Graph 5. Graphical correlation between annual seaquake frequency and Internet outcomes, worldwide evidence, 2010 and 2014
Notes: High-income (dark-coloured) vs. middle- and low-income (light-coloured) countries that experienced at least one seaquake above 5 on the Richter scale. Top graphs: 101 countries (2014) and 98 countries (2010). Bottom graphs: 46 countries (2014) and 38 countries (2010). Data on Internet access proxies drawn from the International Telecommunication Union.
Graph 6. Graphical correlation between annual seaquake frequency and firm Internet use, evidence from the WBES
Notes: Graphs exclude countries that did not experience seaquakes above 5 on the Richter scale within 1000km of their SMC landing stations. Averaged data from 55,595 firms located in 41 developing and transition countries represented in the left-hand side graph, and from 55,502 firms located in 41 developing and transition countries in the right-hand side graph. Firms were surveyed between 2006 and 2014.
3- Empirical framework
Our empirical approach aims to identify the local impact of Internet use on three firm outcomes: the firm’s annual total sales, sales per worker, and number of temporary full-time employees. In this section, we describe the estimation strategy and the data.
3.1. Estimation strategy
3.1.1. Baseline estimation setup
Consider the following simple econometric model, which is the basis of pooled estimations conducted in this empirical analysis:
, , , , , , , , , , (1)
where subscripts, i, t, and j respectively refer to the firm, the survey year,8 and the country, and
where , , , , , , and , , are respectively variables of firm performance, firm Internet usage, and firm characteristics. Firm characteristics are the firm’s size, age, and property status; the
8 Because the survey data used in this paper are not suited for panel analysis, pooled estimations are conducted so that two interview rounds in the same country are considered as distinct units of analysis.
size of the city where the firm operates; the firm’s share of exports; the share of external funding; and the firm’s electricity constraint. , is a vector of key country-level controls: the population logarithm, the GDP per capita logarithm, a landlockedness dummy variable, democracy, and primary school enrolment. is a set of country-level broadband infrastructure control variables: the number of SMCs, the number of IXPs, and the number of years since the first SMC laying. , , is a random error term. We also include sector, region, and year-of-interview dummies ( , , ). Firm-level variables are matched with country-level variables by country j and year of interview t.
3.1.2. Data aggregation and instrumental variable estimation framework
In a second step, the core of our analysis being the contribution of exogenous sources of digital vulnerability to Internet use and firm performance, we run pooled IV estimations based on the instrument set described in section 2. However, IV estimations using firm-level data face two important concerns. The first concern is related to network externalities (Röller & Waverman, 2001) by which firm-level decisions (including decisions to use the Internet or not) may be affected locally by other firms’ decisions. In such context, orthogonality conditions may be violated, as our instruments for firms’ email use vary at the country level and the location level. The second concern is related to the application of a two-stage IV regression framework with a firm-level dichotomous endogenous variable, Internet use, which may cause inference problems.
To address these issues, we conduct IV estimations averaging firm data at the location level, i.e., city or province level, so that (i) decisions of firms that are geographically close and carrying out similar activities are taken together, (ii) the dummy variable becomes a continuous variable lying between 0 and 1, and (iii) we account for network effects of Internet use among firms sharing geographical and sectorial characteristics.
We therefore average firm-level data following this ascending hierarchy9: firm’s location (city or
province), sector of activity, year of survey round, and country. This hierarchy in the data is justified by existing agglomeration externalities for firms operating in the same industry (Head et al., 1995, Litan & Rivlin, 2001). Therefore, clusters of firms from the same location but operating in different sectors, from different countries, and interviewed at different times represent distinct units of observation. Respecting this hierarchy in the data aggregation process increases the sample size and variability, helps avoid losing information on firms’ characteristics and various statistical fallacies, and makes multi-level analysis possible (Hox, 2010; Stoker, 2010).
Aggregating the data at the location level, equation (1) becomes:
, , , , , , , , , , , , , , , , (2)
9 Based on the World Bank’s sample stratification criteria. Aggregating information on the characteristics, Internet usage, and performance of heterogeneous firms geographically close but operating in different sectors and surveyed in different years would therefore be fallacious (Head et al., 1995; Litan & Rivlin, 2001; Hox, 2010; Stoker, 2010).
In addition to equation (1), the instrumental variable approach consists of estimating an additional first-stage equation:
, , , , , , / , , , , , , , , , (3)
where additional subscripts l and s respectively refer to the firm’s location l and sector s of activity.
The , , , / , vector corresponds to instrumental variables described in section 2.3, and
, , , and , , , are respectively the error terms of the first-stage and second-stage equations.
Control variables are the same as those specified in equation (1). 2SLS and multilevel IV pooled estimations of equations (2) and (3) are conducted. In what follows, we detail the multilevel estimation framework.
3.1.3. Multilevel modelling
Multilevel research has shown that empirical analysis considering variables from different hierarchical levels as one single level leads to statistical and conceptual problems that could lead to the under-rejection of the null and to coefficient misinterpretation.10 Multilevel models take
advantage of the hierarchical structure of the data to address these issues. Notably, the eventuality of intra-class correlation at various levels of the data (country, sector, or location levels) casts doubt on the unbiasedness of single-level estimations (Moulton, 1990; Hox, 2010), especially if we are interested in the local effect of aggregated variables. We therefore control for intra-class correlation by estimating equations (2) and (3) through a multi-level estimation framework (Hox, 2010).
For the sake of comparison, equation (1) is first estimated with disaggregated data within the following four-level random-effect model:
, , , , Γ Γ , , , , , , , , , , , , , (1’)
where Γ includes an intercept ( ′ ), a country-level random-intercept component ( ′′ , ), a sector-level random-intercept component ( ′′′ , , ), and a location-level random-intercept component ( ′′′′ , , , ), so that Γ = ′ ′′ , + ′′′ , , + ′′′′ , , , . In addition to these random-intercept
parameters, the model also includes country-level ( ′ , ) and sector-level ( ′′ , , ) random components in the slope coefficient Γ of the Internet variable, that is, Γ = ′ ′′ , ′′ , , .11
The resulting “random-slope model” allows intercept and slope parameters to vary randomly across levels of the data and thereby to control for intra-class correlation between observation units at the country, sector, and location levels.
10 The statistical problem is that a standard statistical model applied to hierarchical data treats disaggregated values as independent information from higher-level subunits. The conceptual problem is related to (i) the ecological fallacy, i.e., when aggregated data are interpreted at the individual level; (ii) the atomistic fallacy, i.e., when conclusions at a higher level are based on inference made at a lower level; and (iii) the ‘Simpson paradox’, which stresses the risk of erroneous conclusions when data drawn from heterogeneous populations are collapsed and interpreted as if populations were homogeneous (Hox, 2010).
11 Only significant random components are kept in the model. We did not add the location level in the random slope coefficient for computational reasons.
Second, using data averaged at the location level c, we conduct two-step IV estimations of equations (2’) and (3’):
, , Δ Δ , , / , , , , (2’)
, , Α Α , , , , , , (3’)
with the following random components: Δ ′ ′′ , + ′′′ , , , Α ′ ′′ , + ′′′ , ,
Δ = ′ ′′ , , and ′ ′′ , . Since the standard errors of the second-stage equation (3’) may be biased by the fact that Internetc,j is an estimated regressor, we implement a 100-replications
non-parametric double-bootstrap of the first-stage and second-stage equations. 3.2. Data and measurement
Appendix A explains the data and variables’ definition, and Appendix B provides summary statistics of the variables listed below.
3.2.1. Dependent variables: Measuring firm’s performance
All firm-level variables used in our model are drawn from the World Bank Enterprise Survey (WBES) cross-sectional dataset.12 These data have been collected by the World Bank through random
surveys conducted in a large sample of countries in firms in the manufacturing and service sectors. These surveys consist of interviewing business owners or top managers of formalized firms about several topics linked to their businesses and to the major obstacles they face to develop their activity. To measure individual firm performance, we alternatively use the logarithm of firm’s total annual sales (converted into USD), total annual sales per full-time employee (converted into USD), and the number of temporary full-time employees. Graphs 7a and 7b plot the distribution of these variables. The average firm sales in the sample amount to 617,268 USD, the average sales per worker amount to 24,842 USD, and the average number of full-time temporary employees is equal to 2.6 workers.
Graph 7a. Distributions of firm performance, firm-level data
Data: World Bank Enterprise Surveys. Sales sample: 26,488 observations, 62 countries. Productivity sample: 26,422 observations, 62 countries. Employment sample: 29,766 observations, 66 countries.
Graph 7b. Distributions of firm performance, location-level data
Data: World Bank Enterprise Surveys. Sales sample: 2,637 observations, 62 countries. Productivity sample: 2,634 observations, 62 countries. Employment sample: 2,800 observations, 66 countries.
3.2.2. Variables of interest: Internet use
Our main variable of interest ( is a dummy variable equal to one if the firm declares having used emails to communicate with its clients and suppliers during the past year, drawn from the World Bank Enterprise Surveys. This variable is our main variable of interest because email is the most basic way to use Internet, correlated with both simple and more complex uses of the Internet. To test the robustness of our results, we use as a dependent variable a dummy equal to one if the firm declares having used a website to communicate with its clients and suppliers during the past year. This website-use variable is also of interest since it reflects a more specific and advanced use of the Internet by firms.
Graphs 8 and 9 below give some insights into firms’ reported experience of Internet usage. While more than 70% (40%) of firms have reported using email (a website) during their operations, data aggregation at the location level permits us to get a continuous Internet penetration variable (lying between 0 and 1) and to get more variability in the sample.
Graph 8. Global incidence of Internet use by firms (global and region averages)
Data: World Bank Enterprise Surveys. Sample: 29,766 observations, 66 countries. AFR: Sub-Saharan Africa; EAP: East-Asia and Pacific; ECA: Eastern Europe and Central Asia; LAC: Latin America and Caribbean; MNA: Middle East and North Africa; SAR: South Asia Region.
Graph 9. Local incidence of Internet use by firms (location-level penetration rates)
Data: World Bank Enterprise Surveys. Sample: 3,372 observations in 66 countries.
3.2.3. Broadband infrastructure and instrumental variables
As explained in subsection 2.3, we instrument a firm’s access to Internet using three instrumental variables: (i) the centroid’s distance to the closest SMC landing station (country-level instrument), a variable reflecting the structural need for telecoms infrastructures; (ii) the firm’s distance to the closest telecoms infrastructure node – either SMC landing station or IXP – a variable reflecting the firm’s need for infrastructures (location-level instrument); and (iii) the annual frequency of seaquakes (lying between 5 and 6.5 on the Richter scale) occurring within 1000km of SMC landing stations (country-level instrument), reflecting the country’s exposure to seaquake-induced cable outages.
To avoid omitted variable bias, we control for features of the telecommunications infrastructure network (BBIj) that are related to policy or to the maturity of the Internet economy. We therefore
include as control variables the number of SMCs and IXPs and the number of years since the first fibre
SMC’s arrival. The importance of controlling for these three dimensions of the telecommunications
infrastructure network to avoid omitted variable bias has been stressed in section 2. Moreover, beyond the contribution of SMCs and IXPs to Internet access, telecommunications infrastructure investment may lead to growth directly because their deployment stimulates economic activity, but also indirectly by creating new productive activities (Röller & Waverman, 2001).
4- Empirical results
We first proceed to a standard single-level empirical analysis of the contribution of the Internet to firm performance by conducting OLS and 2SLS-IV estimations of equations (1) and (2). Then, we adopt a multilevel framework to account for intra-class correlation and to control for unobserved specific random effects at various levels of the data.
4.1. Single-level empirical analysis
4.1.1. Pooled OLS estimates
Pooled single-level OLS estimates of equation (1) are reported in Table 1. They highlight that the use of email during firms’ operations is positively and consistently correlated with firms’ total sales and productivity but uncorrelated with temporary employment. BBI variables display low correlations with firm performance variables, especially when the data are averaged at the location level. Among these variables, the number of years since the first SMC’s laying is the only variable consistently correlated with firm performance: positively with firms’ total sales and productivity and negatively with temporary employment.
To ensure that the coefficient estimates of email use are not upward biased by unobserved country-level heterogeneity (Röller & Waverman, 2001; Wallsten, 2005), we report in Appendix C.2 (columns (1), (3), and (5)) estimates of benchmark OLS regressions replacing country-level variables with country dummies. The resulting estimates of email use coefficients are consistent and remain stable, suggesting that our model is correctly fitted.13 Their magnitude suggests that a 10%
increase in Internet penetration among firms leads to a 7% increase in their revenue and productivity.
These OLS estimates provide first insights into the relationship between Internet infrastructures, Internet use, and firm performance. Because these estimated relationships may suffer from omitted variable bias or reverse causality from firm’s outcomes to Internet use (Röller & Waverman, 2001; Czernich et al., 2011), we proceed to IV estimations in the next subsections.
13 However, coefficient estimates of the landlockedness and GDP per capita variables are respectively positive and negative, suggesting that the model could be misspecified. This coefficient turns negative in multilevel estimations conducted in the next sections (section 4.3, table 3), supporting that these unexpected correlations are driven by lower-level unobserved characteristics and justifying the use of a multilower-level framework.
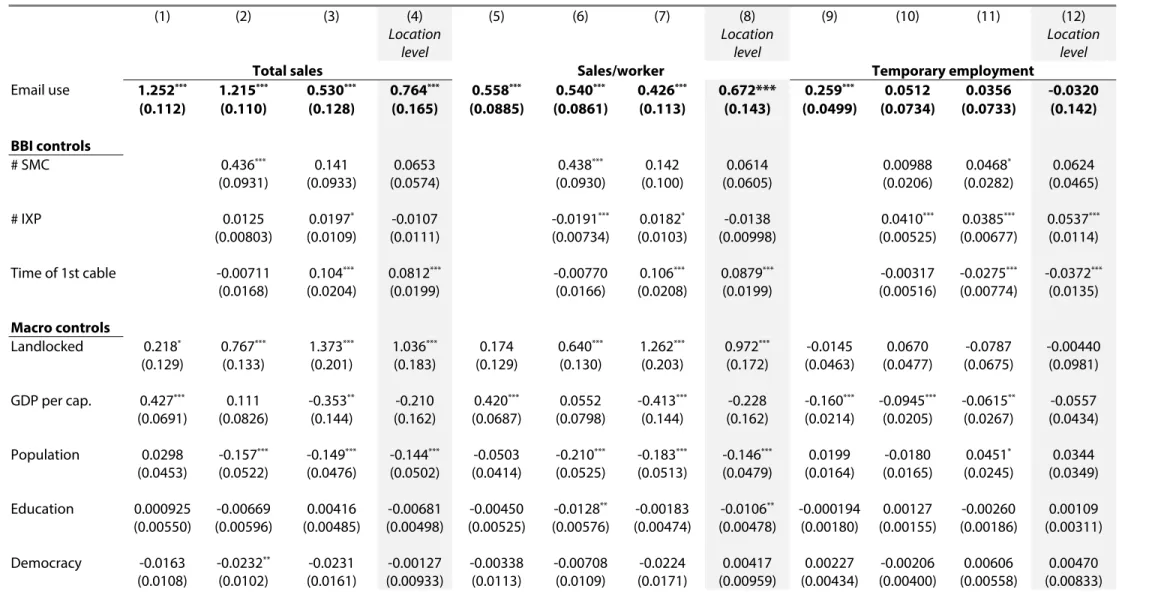
Table 1. Email use, broadband infrastructures, and firm performance: OLS single-level estimations (1) (2) (3) (4) (5) (6) (7) (8) (9) (10) (11) (12) Location level Location level Location level
Total sales Sales/worker Temporary employment
Email use 1.252*** 1.215*** 0.530*** 0.764*** 0.558*** 0.540*** 0.426*** 0.672*** 0.259*** 0.0512 0.0356 -0.0320 (0.112) (0.110) (0.128) (0.165) (0.0885) (0.0861) (0.113) (0.143) (0.0499) (0.0734) (0.0733) (0.142) BBI controls # SMC 0.436*** 0.141 0.0653 0.438*** 0.142 0.0614 0.00988 0.0468* 0.0624 (0.0931) (0.0933) (0.0574) (0.0930) (0.100) (0.0605) (0.0206) (0.0282) (0.0465) # IXP 0.0125 0.0197* -0.0107 -0.0191*** 0.0182* -0.0138 0.0410*** 0.0385*** 0.0537*** (0.00803) (0.0109) (0.0111) (0.00734) (0.0103) (0.00998) (0.00525) (0.00677) (0.0114) Time of 1st cable -0.00711 0.104*** 0.0812*** -0.00770 0.106*** 0.0879*** -0.00317 -0.0275*** -0.0372*** (0.0168) (0.0204) (0.0199) (0.0166) (0.0208) (0.0199) (0.00516) (0.00774) (0.0135) Macro controls Landlocked 0.218* 0.767*** 1.373*** 1.036*** 0.174 0.640*** 1.262*** 0.972*** -0.0145 0.0670 -0.0787 -0.00440 (0.129) (0.133) (0.201) (0.183) (0.129) (0.130) (0.203) (0.172) (0.0463) (0.0477) (0.0675) (0.0981) GDP per cap. 0.427*** 0.111 -0.353** -0.210 0.420*** 0.0552 -0.413*** -0.228 -0.160*** -0.0945*** -0.0615** -0.0557 (0.0691) (0.0826) (0.144) (0.162) (0.0687) (0.0798) (0.144) (0.162) (0.0214) (0.0205) (0.0267) (0.0434) Population 0.0298 -0.157*** -0.149*** -0.144*** -0.0503 -0.210*** -0.183*** -0.146*** 0.0199 -0.0180 0.0451* 0.0344 (0.0453) (0.0522) (0.0476) (0.0502) (0.0414) (0.0525) (0.0513) (0.0479) (0.0164) (0.0165) (0.0245) (0.0349) Education 0.000925 -0.00669 0.00416 -0.00681 -0.00450 -0.0128** -0.00183 -0.0106** -0.000194 0.00127 -0.00260 0.00109 (0.00550) (0.00596) (0.00485) (0.00498) (0.00525) (0.00576) (0.00474) (0.00478) (0.00180) (0.00155) (0.00186) (0.00311) Democracy -0.0163 -0.0232** -0.0231 -0.00127 -0.00338 -0.00708 -0.0224 0.00417 0.00227 -0.00206 0.00606 0.00470 (0.0108) (0.0102) (0.0161) (0.00933) (0.0113) (0.0109) (0.0171) (0.00959) (0.00434) (0.00400) (0.00558) (0.00833)
Micro controls State-owned -0.242 -0.252 -0.292* -0.262 0.412** -0.0317 (0.215) (0.286) (0.158) (0.247) (0.166) (0.215) Foreign 0.409*** -0.0527 0.396*** 0.197 0.0235 0.0405 (0.108) (0.343) (0.145) (0.231) (0.124) (0.275) Age 0.103* 0.0830 0.0259 -0.00744 -0.0302 -0.0506 (0.0592) (0.122) (0.0598) (0.0974) (0.0271) (0.0973) City size -0.0536 -0.142*** -0.0404 -0.119*** -0.0112 -0.0395 (0.0420) (0.0456) (0.0416) (0.0432) (0.0195) (0.0368) Large size 2.909*** 3.258*** -0.0122 0.100 1.052*** 0.682*** (0.0980) (0.241) (0.0958) (0.202) (0.0917) (0.217) Medium size 1.320*** 1.616*** -0.0274 0.116 0.433*** -0.0874 (0.0809) (0.209) (0.0766) (0.174) (0.0456) (0.140) External 0.00937*** 0.00704* 0.00837*** 0.00986*** 0.00238** 0.00295 funding (0.00323) (0.00391) (0.00306) (0.00250) (0.00115) (0.00294) Electricity 0.00464 -0.000809 -0.0146 0.00877 0.0221 0.0255 obstacle (0.0239) (0.0760) (0.0253) (0.0647) (0.0154) (0.0483) % of exports 0.00231* -0.00200 0.000589 -0.00482 -0.000273 0.00313 (0.00123) (0.00287) (0.00119) (0.00297) (0.00101) (0.00395)
Dummies Region, year of interview, sector, firm size Region, year of interview, sector, firm size Region, year of interview, sector, firm size
N 59,418 59,184 33,394 3,372 59,230 59,000 33,315 3,369 68,924 68,619 38,304 3,560
Countries 86 84 67 67 86 84 67 67 90 88 71 71
R2 0.202 0.225 0.451 0.645 0.172 0.209 0.211 0.395 0.083 0.092 0.184 0.309
Note: * significant at 10%, ** significant at 5%, *** significant at 1%. Standard errors are presented in parentheses. Standard errors are robust to heteroscedasticity, are clustered by country-year-sector-city in OLS estimations using firm-level data, and are clustered by country-year-sector in OLS estimations using location-level data.
4.1.2. 2SLS-IV estimations
Results of 2SLS-IV estimations are presented in Table 2. First-stage estimates show that the stronger the firm’s need for infrastructure, i.e., the further the firm from the cable landing point, the weaker the likelihood of the firm’s using the Internet and the lower its performance. We also find a negative and significant effect of the structural need for infrastructure, i.e., the centroid’s distance to an SMC landing point, on email use. Last, the exposure to seaquake-induced cable faults, proxied by the frequency of seaquakes within a 1000km radius, has, as expected, a negative and significant effect on email use.
Second-stage estimates support a stronger positive and 1%-significant effect of email use on annual sales, productivity, and temporary employment. According to our estimates, a 10% increase in email use among the population of firms raises more than proportionally the average logarithm of firms’ annual sales by 24%, and by 22% the average logarithm of sales per full-time employee (corresponding approximately to a one–standard-deviation increase in these outcomes). Identification tests suggest that the instrument set is valid in the sales and productivity equations. Regarding the employment equation, the Hansen test rejects the hypothesis of residual orthogonality at a 10% confidence level, which casts doubt on the reliability of the estimated coefficient.
To ensure that a general “growth effect” of infrastructures driven by unobserved country-specific factors does not bias coefficients upward (Röller & Waverman, 2001), we conducted benchmark IV estimations using the firm distance to infrastructure as the only instrument and replacing country-level variables with country dummies. Estimates, reported in Appendix C.2 (columns (1), (2), and (3)), confirm the significant effect of email use on a firm’s revenue and productivity, despite a single-instrument set’s being somewhat weaker.
Table 2. Email use, digital vulnerabilities, and firm performance – IV estimations
(1) (3) (6)
Total sales Sales/worker Temporary
employment 2nd stage estimates
Email use 2.394** 2.258** 1.746**
(0.964) (0.917) (0.878)
BBI, macro, and micro controls Yes Yes Yes
1st stage estimates Instruments:
Firm distance to SMC/IXP -0.015** -0.015** -0.012**
(0.005) (0.005) (0.005)
Centroid distance to SMC -0.060*** -0.060*** -0.043**
(0.019) (0.019) (0.017)
Seaquake freq., 1000km rad. -0.003* -0.003** -0.003
(0.0018) (0.0018) (0.0022)
BBI, macro, and micro controls Yes Yes Yes
Dummies Region, year of interview, sector, firm size
N 2633 2633 2797
Countries 62 62 66
Hansen test (p. value) 0.75 0.34 0.10
Weak ident. test (F-stat) 11.54*** 11.50*** 7.16***
Under-ident. test (LM-stat) 27.38*** 27.32*** 18.73***
Note: * significant at 10%, ** significant at 5%, *** significant at 1%. Control estimates not reported. Standard errors are presented in parentheses. Standard errors are robust to heteroscedasticity and are clustered by country-year-sector. Firm-level variables are averaged at the country-year-sector-location level. Standard errors are robust to heteroscedasticity and are clustered by country-year-sector.
Until now, the hierarchical structure of the data and the eventuality of intra-class correlation in various layers of the data have been not accounted for in OLS and 2SLS estimations. In the next subsection, we estimate equations (1), (2), and (3) by implementing the multi-level empirical analysis explained in subsection 3.1.3.
4.2. Multilevel analysis
4.2.1. Multilevel estimations of equation (1)
Table 3 reports four-level and three-level estimations of equation (1’) – performed on firm-level and location-level data, respectively – and three-level IV estimations of equations (1’) and (2’) – performed on location-level data. According to the four- and three-level estimates of equation (1’), a 10% increase in email use is significantly associated with an 8% increase in firms’ sales, a 7% increase in labour productivity, and a 2–3% increase in the number of temporary employees. First, the comparison between the coefficient estimates of equation (1) in table 1 and those in table 3 (columns (1), (2), (4), (5), (7), and (8)) stresses that the relationship between Internet use and firm
performance seems to be understated in single-level estimations. Second, the comparison of estimates in table 3 with coefficient estimates of the country-dummy three-level model reported in Appendix C.2 (columns (2), (4), and (5)) highlights the convergence of estimated coefficients across different multi-level models. This comparison permits us to confirm that estimated coefficients are not biased upward because of a “growth effect” of telecoms infrastructure (Röller & Waverman, 2001). Multi-level estimates of equation (1) in appendix C.2 (column (6)) also confirm the positive, consistent, and significant correlation between Internet use and the firm’s number of temporary employees, as reported in table 3.
4.2.2. Three-level IV estimations
Next, we run nonparametric double-bootstrapped three-level IV estimations of equations (2’) and (3’) and report second-stage estimates in table 3 (columns (3), (6), and (9). First-stage three-level (single-bootstrapped) estimates are reported in Appendix C.1 and stress the significant negative contribution of the country’s exposure to seaquake-induced SMC outages to Internet access and the negative contribution of the firm’s distance to infrastructure nodes, but the nuanced contribution of the centroid’s distance to SMCs.14
Second-stage estimates show that a 10% increase in the incidence of email use among firms increases by 26% their revenues, by 21% their productivity, and by 6% temporary employment. These estimated impacts of email use on firms’ sales and productivity, reported in columns (3) and (6), are therefore very close to those provided by the single-level IV-2SLS estimator in table 2. Both 2SLS and three-level IV estimates therefore stress that the relationship between email use and firm performance resulting from equation (1)’s estimations tends to be strongly understated.
Interestingly, the estimated impact of email use on temporary employment in column (9) is less than half of that provided by the IV-2SLS estimator. Therefore, this evidence, combined with the previous evidence of a significant positive correlation between email use and employment found in multi-level estimations of equation (1), suggests that the rejection of the orthogonality conditions in IV-2SLS estimations of the employment equation in table 2 (column (3)) might be explained by the presence of intra-class correlation at the country and/or sector levels.
14 Hox (2010) recommends at least 1000 bootstrap samples for sufficient accuracy. However, due to computational constraints, we limit the double-bootstrap samples to 100 replications and find that non-bootstrapped IV estimations were actually understating the standard error’s size. This suggests that rejections of the null should not be affected by a smaller replication sample.
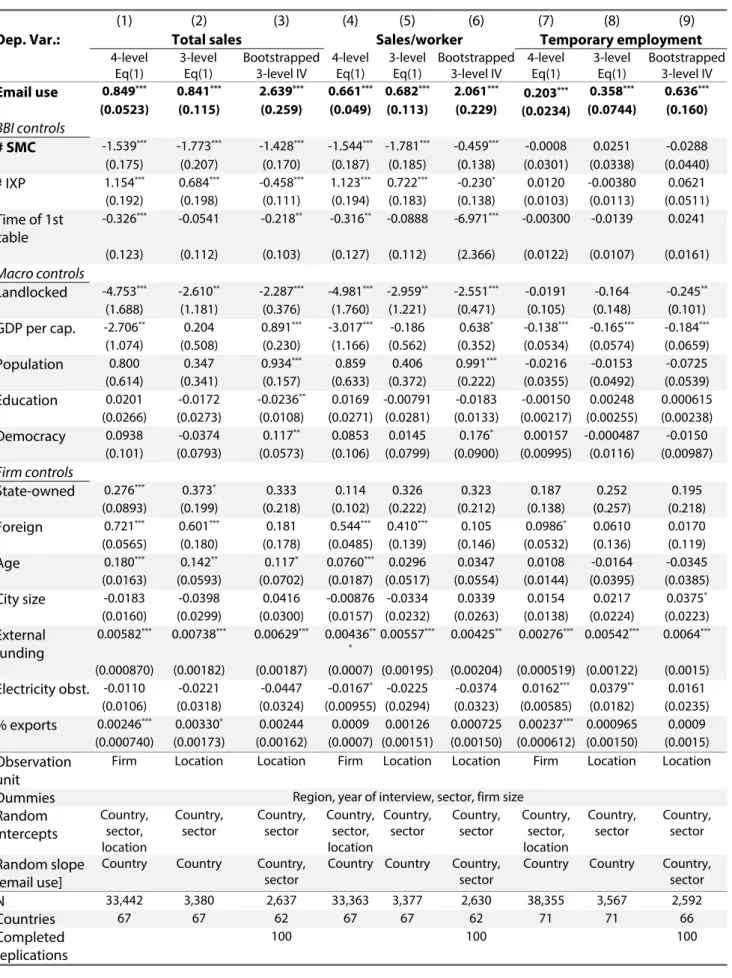
Table 3. Multi-level estimations
(1) (2) (3) (4) (5) (6) (7) (8) (9)
Dep. Var.: Total sales Sales/worker Temporary employment
4-level Eq(1) 3-level Eq(1) Bootstrapped 3-level IV 4-level Eq(1) 3-level Eq(1) Bootstrapped 3-level IV 4-level Eq(1) 3-level Eq(1) Bootstrapped 3-level IV Email use 0.849*** 0.841*** 2.639*** 0.661*** 0.682*** 2.061*** 0.203*** 0.358*** 0.636*** (0.0523) (0.115) (0.259) (0.049) (0.113) (0.229) (0.0234) (0.0744) (0.160) BBI controls # SMC -1.539*** -1.773*** -1.428*** -1.544*** -1.781*** -0.459*** -0.0008 0.0251 -0.0288 (0.175) (0.207) (0.170) (0.187) (0.185) (0.138) (0.0301) (0.0338) (0.0440) # IXP 1.154*** 0.684*** -0.458*** 1.123*** 0.722*** -0.230* 0.0120 -0.00380 0.0621 (0.192) (0.198) (0.111) (0.194) (0.183) (0.138) (0.0103) (0.0113) (0.0511) Time of 1st cable -0.326*** -0.0541 -0.218** -0.316** -0.0888 -6.971*** -0.00300 -0.0139 0.0241 (0.123) (0.112) (0.103) (0.127) (0.112) (2.366) (0.0122) (0.0107) (0.0161) Macro controls Landlocked -4.753*** -2.610** -2.287*** -4.981*** -2.959** -2.551*** -0.0191 -0.164 -0.245** (1.688) (1.181) (0.376) (1.760) (1.221) (0.471) (0.105) (0.148) (0.101) GDP per cap. -2.706** 0.204 0.891*** -3.017*** -0.186 0.638* -0.138*** -0.165*** -0.184*** (1.074) (0.508) (0.230) (1.166) (0.562) (0.352) (0.0534) (0.0574) (0.0659) Population 0.800 0.347 0.934*** 0.859 0.406 0.991*** -0.0216 -0.0153 -0.0725 (0.614) (0.341) (0.157) (0.633) (0.372) (0.222) (0.0355) (0.0492) (0.0539) Education 0.0201 -0.0172 -0.0236** 0.0169 -0.00791 -0.0183 -0.00150 0.00248 0.000615 (0.0266) (0.0273) (0.0108) (0.0271) (0.0281) (0.0133) (0.00217) (0.00255) (0.00238) Democracy 0.0938 -0.0374 0.117** 0.0853 0.0145 0.176* 0.00157 -0.000487 -0.0150 (0.101) (0.0793) (0.0573) (0.106) (0.0799) (0.0900) (0.00995) (0.0116) (0.00987) Firm controls State-owned 0.276*** 0.373* 0.333 0.114 0.326 0.323 0.187 0.252 0.195 (0.0893) (0.199) (0.218) (0.102) (0.222) (0.212) (0.138) (0.257) (0.218) Foreign 0.721*** 0.601*** 0.181 0.544*** 0.410*** 0.105 0.0986* 0.0610 0.0170 (0.0565) (0.180) (0.178) (0.0485) (0.139) (0.146) (0.0532) (0.136) (0.119) Age 0.180*** 0.142** 0.117* 0.0760*** 0.0296 0.0347 0.0108 -0.0164 -0.0345 (0.0163) (0.0593) (0.0702) (0.0187) (0.0517) (0.0554) (0.0144) (0.0395) (0.0385) City size -0.0183 -0.0398 0.0416 -0.00876 -0.0334 0.0339 0.0154 0.0217 0.0375* (0.0160) (0.0299) (0.0300) (0.0157) (0.0232) (0.0263) (0.0138) (0.0224) (0.0223) External funding 0.00582*** 0.00738*** 0.00629*** 0.00436** * 0.00557*** 0.00425** 0.00276*** 0.00542*** 0.0064*** (0.000870) (0.00182) (0.00187) (0.0007) (0.00195) (0.00204) (0.000519) (0.00122) (0.0015) Electricity obst. -0.0110 -0.0221 -0.0447 -0.0167* -0.0225 -0.0374 0.0162*** 0.0379** 0.0161 (0.0106) (0.0318) (0.0324) (0.00955) (0.0294) (0.0323) (0.00585) (0.0182) (0.0235) % exports 0.00246*** 0.00330* 0.00244 0.0009 0.00126 0.000725 0.00237*** 0.000965 0.0009 (0.000740) (0.00173) (0.00162) (0.0007) (0.00151) (0.00150) (0.000612) (0.00150) (0.0015) Observation unit
Firm Location Location Firm Location Location Firm Location Location
Dummies Region, year of interview, sector, firm size
Random intercepts Country, sector, location Country, sector Country, sector Country, sector, location Country, sector Country, sector Country, sector, location Country, sector Country, sector Random slope [email use]
Country Country Country, sector
Country Country Country, sector
Country Country Country, sector N 33,442 3,380 2,637 33,363 3,377 2,630 38,355 3,567 2,592 Countries 67 67 62 67 67 62 71 71 66 Completed replications 100 100 100
Note: * significant at 10%, ** significant at 5%, *** significant at 1%. Standard errors are presented in parentheses and are robust to heteroscedasticity. Only significant random components have been kept in multi-level estimations. Three-level IV estimates result from a 100 replications double-bootstrap.
Last, to ensure that the three-level IV estimates are not biased upward because of country-specific effects, we again conduct three-level benchmark IV estimations using the firms’ distance to infrastructure as the only instrument and replacing country-level variables with country dummies. The estimates, reported in Appendix C.3, show a twice as significant effect of email use on a firm’s revenue and productivity but no significant effect on temporary employment.
In this section, we addressed potential endogeneity bias through an IV approach highlighting the role of structural determinants of digital vulnerability through a multi-level modelling of the data and by comparing estimates with those resulting from country-dummy variable estimations reported in appendix C. IV estimations shed light on large, positive, local effects of an increased access to the Internet on firm performance. Notably, sales and productivity equations’ estimates appear consistent across different models, which is less the case of the relationship between email use and temporary employment. In the next section, we proceed to additional robustness tests.
5- Robustness analysis
5.1. Sample restrictions and the reverse causality concern
As first robustness checks, we first ensure that IV estimates do not suffer from endogeneity bias induced by firm location decisions, which could be influenced by the presence of infrastructures.15
To address an eventual location selectivity bias, we follow a similar approach to Dollar et al. (2006) and exclude from the sample large firms, exporters, and foreign firms, whose location decisions could be related to the presence of SMC landing stations or IXPs. In fact, various surveys point out that large or foreign firms are more geographically mobile, while smaller or domestic firms’ location choices are mostly influenced by the location of their founders’ social capital (Zaheer et al., 2009). Moreover, we also exclude exporters to make sure that estimated effects of firms’ distances to SMC landing points do not reflect the effect of distance to ports (where SMCs can be laid) on their performance.
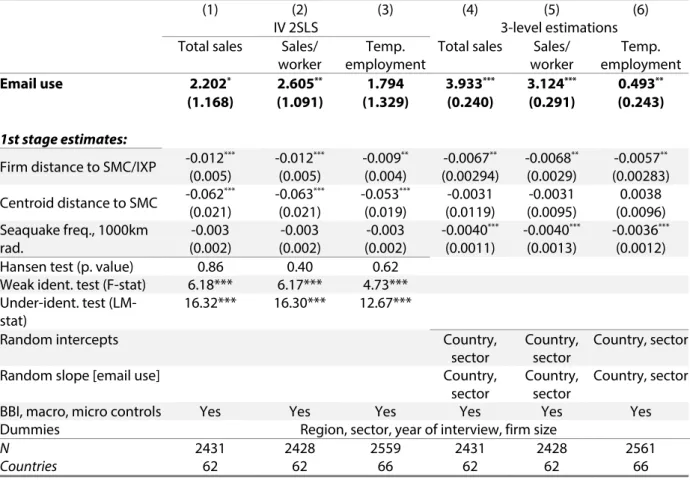
We start by conducting IV estimations on a sample of small and medium enterprises (SMEs) and report estimates in table 4. First-stage estimations support that despite this first sampling restriction, our instrument set is valid in sales, labour productivity, and employment equations (columns (1) to (3)). However, three-level IV estimates of the sales and productivity equations are found to be more than 1.5 times higher than IV-2SLS estimates in columns (1) to (3) and higher than previous IV estimates. They point to a larger local impact of Internet use on smaller firms’ outcomes: a 10% increase in the local incidence of email use by firms raises their average sales by 38% and their average labour productivity by 31%, corresponding respectively to a 2.2 and a 1.6 standard deviation increase in these outcomes. The magnitude of these effects is confirmed by three-level IV estimations conducted on a sample this time restricted to domestic and non-exporter
15 This concern for the job equation is lowered by the recent research of Clarke et al. (2016), who stress that the presence of infrastructure is not robustly related to job growth.