Dependence of typing speed and accuracy on device type and familiarity
by Kim E. Veldee Submitted to the MASSACHUSETTS INSTITUTE OF TECHNOLOGY
jJUL
16 2019
LIBRARIES
ARCHIVES
Department of Mechanical EngineeringIn Partial Fulfillment of the Requirements for the Degree of Bachelor of Science in Mechanical Engineering
at the
Massachusetts Institute of Technology June 2019
0 2019 Massachusetts Institute of Technology. All rights reserved.
Signature of Author:
Certified by:
Signature redacted
Department of Mechanical Engineering June 2019
Signature redacted
Signature redacted
Barbara Hughey Senior Lecturer Thesis Supervisor Accepted by: Maria Yang Professor of Mechanical EngineeringDependence of typing speed and accuracy on device type and familiarity
by
Kim E. Veldee
Submitted to the Department of Mechanical Engineering On June 2019 in Partial Fulfillment of the
Requirements for the Degree of
Bachelor of Science in Mechanical Engineering
Abstract
Typing has become increasingly present in modem lives through its uses in laptops, phones, tablets, and other consumer electronics. Current computers encourage high typing speeds by implementing mistake corrections such as "backspace" or "delete" keys, functions that were previously done by cross-outs or complete rewrites of the entire page. These mistake correction options have minimized the consequences for typing errors and have caused typists to place less importance on typing accuracy. As more models of electronic devices are placed on the market, users build familiarity with and skills for their specific device model.
Twelve participants were asked to complete a series of thirty-two typing tests on various laptop keyboards and mobile phones. Measurements were taken of typing speed and accuracy on familiar and unfamiliar keyboards for both laptops and phone keyboards, and specific mistake types were counted and recorded. The effects of Autocorrection were observed through the transcription of multiple passages with and without Autocorrection enabled. The results were compared between device types (phone vs. laptop keyboards), level of familiarity (personal vs. unfamiliar keyboards), presence of Autocorrection, participant sex, and undergraduate major. Participant sex and undergraduate major did not significantly affect typing speeds on phones or laptop keyboards. Participants typed approximately 20% faster on laptop keyboards than on phone keyboards. Participants decreased in speed when typing on unfamiliar phone and laptop keyboards (approximately 46% slower on phones and 2.7% to 5.5% slower on laptops) and typed about 10% slower when prohibited from utilizing the "backspace" or "delete" keys. Misspellings were consistently the most frequent mistake type and account for approximately 50% of mistakes, along with bad ordering on laptops (approximately 30%) and incorrectly-located spaces on phones (approximately 20%). Participants who regularly enable Autocorrect typed about 20% slower on phones when Autocorrection was disabled.
Thesis supervisor: Barbara Hughey Title: Senior Lecturer
TABLE OF CONTENTS
A b stract ... 3
T able of C ontents ... 4
L ist o f F igu res ... 6
L ist o f T ab les ... 8
1 . Introdu ction ... .... 9
2. B ackground Inform ation ... 9
2.1 Computer Keyboard History ... 9
2.2 A Brief Description of Modem Typing ... 10
2.3 R elevant Prior R esearch ... 11
2.3.1 On the Relationship of Sex with Typing Speed and Accuracy ... 11
2.3.2 On the Experiential Differences between Hard and Soft Keyboards .... 11
2.3.3 On the Effect of Keyboard Size on Typing Speed ... 12
2.4 Laptop Keyboard Specifics ... 12
2.4.1 D ell K eyboard ... 13
2.4.2 Apple's Scissor Mechanism Keyboard ... 14
2.4.3 Apple's Butterfly Mechanism Keyboard ... 14
2.4.4 AmazonBasics Keyboard ... 16
2.5 Phone Keyboard Specifics ... 17
3 . M eth o d s ... 19
3.1 Subject D em ographics ... 19
3.1.1 Subject Technology Demographics ... 19
3.2 T esting Procedure ... 20
3.2.1 Speed, Accuracy, and Mistake Type by Testing Condition on Personal L ap top ... 2 2 3.2.2 Speed by Familiarity of Laptop ... 22
3.2.3 Speed, Accuracy, and Mistake Type by Device Type ... 23
3 .3 D ata A n aly sis ... 4 R esults and D iscussion ... 4 .1 L aptop T rial R esults ...
4.1.1 General Results on Laptop Keyboard Familiarity ... 4.1.2 Effects of Device Familiarity on Laptop Typing Speed ... 4.1.3 Effects of Testing Condition on Laptop Typing Speed ... 4.1.4 Effects of Sex on Laptop Typing Speed ...
4.1.5 Effects of Undergraduate Major on Laptop Typing Speed ... 4.1.6 Frequency of Mistake Type on Laptop Keyboards ... 4.1.7 Effects of Testing Condition on Laptop Typing Accuracy and Specific
M istak e T yp e ... 4.2 Phone T rial R esults ...
4.2.1 General Results on Phone Keyboards Familiarity ... 4.2.2 Effects of Autocorrection on Phone Typing Speed and Accuracy ... 4.2.3 Effects of Sex on Phone Typing Speed ... 4.2.4 Effects of Undergraduate Major on phone Typing Speed ...
4.2.5 Frequency of Mistake Type on Phone Keyboards ... 4.2.6 Critical Evaluation of Misspellings on Phone Keyboards ... 4.3 Laptop vs. Phone Comparison Results ...
4.3.1 Comparing Typing Speeds on Laptop and Phone Keyboards ...
5 C o n clu sio n s ...
6 A p p en d ices ...
Appendix A: Survey on participant demographic background and typing experience.. Appendix B: Passages for comparing by laptop keyboard familiarity ... Appendix C: Passages for comparing across phone familiarity and Autocorrection ... Appendix D: Complete list of misspelling letter pairings when typing on phone ...
LIST OF FIGURES
Figure 2.1 Example of the internal mechanism of scissor switch keyboard ... 13
Figure 2.2 Traditional scissor mechanism for MacBook Pro ... 14
Figure 2.3 Section view of originally patented butterfly keyboard ... 14
Figure 2.4 Section view of modified butterfly keyboard with membrane ... 15
Figure 2.5 AmazonBasics wired keyboard ... 16
Figure 2.6 Silicone dome switches to raise depressed keys in AmazonBasics keyboard .... 16
Figure 2.7 Visualizations of the iPhone keyboard and Droid Razr M keyboard ... 18
Figure 4.1 Familiar laptop typing speed to unfamiliar laptop typing speed, colored by participant ... .... 27
Figure 4.2 Percent increase in typing speeds between typing on familiar and unfamiliar laptop keyboards, colored by participant ... 28
Figure 4.3 Histogram of the percent differences in typing speeds on laptop keyboards 30 Figure 4.4 Percent increase in typing speeds between typing on familiar and unfamiliar laptop keyboards, averaged and colored by participant ... 31
Figure 4.5 Familiar typing speed to unfamiliar laptop typing speed, colored by keyboard m o d e l ... 3 2 Figure 4.6 Percent increase in typing speeds between typing on familiar and unfamiliar laptop keyboards, colored by keyboard model ... 33
Figure 4.7 Percentage of slower, unchanged, and faster typists by laptop keyboard type .... 34
Figure 4.8 Average percent increase in speed by laptop keyboard type, compared to average percent change ... 35
Figure 4.9 Comparing typing speeds between testing conditions, colored by participant ... 3 6 Figure 4.10 Percent increase in laptop typing speeds between conditions ... 37
Figure 4.11 Three instances of comfortable typing speed per participant, organized and colored by sex ... . 38
Figure 4.12 Three instances of comfortable typing speed per participant, organized and colored by undergraduate m ajor ... 39
Figure 4.13 Figure 4.14 Figure 4.15 Figure 4.16 Figure 4.17 Figure 4.18 Figure 4.19 Figure 4.20 Figure 4.21 Figure 4.22 Figure 4.23 Figure 4.24 Figure 4.25 Figure Figure Figure Figure Figure 4.26 4.27 4.28 4.29 4.30 Figure 4.31
Average laptop typing speed by department ... Capitalization, bad ordering, doublet, neglect, misspelling, and punctuation mistake frequencies by participant ... Average frequency by laptop typing mistake ... Frequency of doublet by mistake type and individual participant ... Comparing typing accuracy between comfortable typing and fast typing, colored by participant ... Frequency of specific mistake type by testing condition ... Correlation of familiar phone typing speed to unfamiliar phone typing speed, colored by participant ... Percent change in phone typing speeds between typing on familiar and unfamiliar phone keyboards, colored by participant ... Histogram of the percent differences in typing speeds on phone keyboards. Correlation of typing speed with Autocorrection enabled to typing speed with Autocorrection disabled, colored by participant ... Percent change in typing speeds between typing with Autocorrect enabled and disabled, colored by participant ... Four instances of comfortable phone typing speed per participant, organized and colored by sex ... Four instances of comfortable phone typing speed per participant, organized and colored by undergraduate major ... Space, misspelling, punctuation, and other mistake types ... Average frequency by phone typing mistake ... Frequency of miss-hit directions in relation to the intended key ... Keyboard layout with letters coded by responsible hand ... Correlation of laptop typing speed to phone typing speed, colored by
p articip an t ... Percent change in typing speeds between typing on laptops and phones, averaged and colored by participant ...
39 41 42 43 44 45 47 48 49 50 51 52 53 54 55 57 58 59 60
LIST OF TABLES
Table 2.1 Technical details by laptop keyboard type ... 12
Table 2.2 Technical details by iPhone generation ... 17
Table 2.3 Technical details by phone type ... 17
Table 3.1 Participant A ge and Sex ... 19
Table 3.2 Participant Count by MIT Undergraduate Department ... 19
Table 3.3 Participant Count by Laptop and Phone Model ... 20
Table 3.4 Data collection for observing speeds between Autocorrect and familiarity levels 22 Table 3.5 Data collection table for testing laptop keyboard familiarity effects ... 23
Table 3.6 Data collection table for personal laptop imposed condition test ... 24
Table 3.7 Data collection table for observing mistake types on personal phone ... 25
Table 3.8 Data collection table for recording specific letter mistypes on personal phone ... 25
Table 4.1 Comparison of laptop speeds between familiar and unfamiliar laptop keyboard. 29 Table 4.2 Most frequent misspelling letter pairs when typing on mobile phone ... 56
1. Introduction
Technology has become deeply ingrained in the modem lifestyle. Of the total U.S. population in
2018, 9 5% own cell phones and 73% own computers, both of which indicate a high level of dependency of individuals on their electronics ("Demographics of Mobile Device Ownership and Adoption in the United States", 2018). It is natural that increased familiarity and skill would come along with such high levels of dependency. When the typewriter was introduced, the jumbled QWERTY layout slowed typists down and mistakes had to be fixed either with
cross-throughs, white-out, or complete rewrites. Today, as individuals type more and more frequently, the QWERTY orientation has become the learned standard that allows individuals to type at ever-increasing speeds and fix mistakes with a few extra key clicks.
The ability to fix one's mistakes while typing has led to a widespread dependency on technological crutches such as "Backspace", "Delete", and "Autocorrection" functions. Mistake-erasing functions, such as "Backspace" and "Delete", have increased inattention while typing by decreasing the consequences of mistakes and allowing them to be easily remedied. Typing aids, such as "Autocorrection", have been recently discussed as decreasing the spelling capabilities of adult individuals, causing them to be unable to spell trickier common words such as "necessary" and "embarrassed" ("Poor Spelling of 'Auto-Correct Generation' Revealed", 2012).
Typing has morphed from its original function of formalizing formally handwritten passages to a multifunctional technological tool that is utilized for numerous daily tasks. To determine how modem users interact with keyboards, participants were asked to do thirty-two individual typing tests using devices that varied in device type and familiarity. The participants were requested to complete tests on their personal phones and personal laptops, as well as corresponding unfamiliar devices. The tests were used to measure typing speeds, accuracy percentages, and specific mistake types to be compared across participant characteristics, device type, and device familiarity.
2. Background
2.1 Computer Keyboard History
The history of typing keyboards stretches back to the invention of the typewriter in 1868. E. Remington and Sons invented the Sholes & Glidden Type-Writer which allowed users to write at a pace that far exceeded that of handwriting. The typewriter was a completely mechanical system primarily made up of levers and springs. When a key was depressed, the lever lifted the desired piece of block of metal with a raised piece of type on it. A ribbon of inked cloth was lifted immediately before the type contacted the paper, causing the type to make a printed impression upon impact. As the lever was retracted to its resting position, the carriage shifted the paper over to ready it for the next letter.
Initially, typing keyboards were designed to be in alphabetical order. This organization was chosen to help the user find the desired key quickly and logically, allowing them to type at the quickest possible rate. From this point forward, multiple theories arose and attempted to explain the change to the QWERTY keyboard layout. The commonly believed theory is that the
QWERTY layout, named by listing the sequence that tracks along the top row of the keyboard, maximized distance between common letter pairings such as 'an', 'he', and 'pr'. The theory argues that this layout was implemented to avoid mechanical jamming that would occur if nearby letters were pressed quickly after each other (Stamp, 2013).
However, recent research has argued against the popular mechanical jamming theory by first pointing out that, if the mechanical jamming theory was intended to decrease typing time, then
'e' and 'r' would be set far apart as 'er' is the fourth most popular letter pairing in the English language (Stamp, 2013). Koichi Yasuoka and Motoko Yasuoka, researchers from Japan's Kyoto University, argued that the typewriter keyboard design was inspired by the Hughes-Phelps Printing Telegraph and that the QWERTY layout was implemented to assist Sholes & Glidden's initial customer demographic: Morse receivers. (Yasuoka, Koichi, and Motoko Yasuoka, 2011) As technology advanced, typewriters morphed into the computers that are used today. The mechanical levers and stamps have been replaced with digital keys yet the QWERTY letter organization remains intact. Jimmy Stamp from Smithsonian.com explains why the layout has persisted, saying "Form follows function and the keyboard trains the typist" (Stamp, 2013). Individuals who have been trained on one keyboard are unlikely to retrain to use an unfamiliar and uncommon keyboard layout. Therefore, QWERTY is solidified as the standard keyboard layout.
2.2 A Brief Description of Modern Typing
Nowadays, typing is commonly used on personal mobile phones and laptops, the two devices that investigated in this study. Users may type on phones to complete tasks such as sending an instant message, sending emails, looking up content on a search engine, or posting on social media. When typing on a phone, individuals can choose to designate various methods for typing. The most commonly used method resembles computer typing technique where the user hunts and pecks for keys, and on phones this is most commonly done using the typist's thumbs. Other common methods for typing on a mobile phone include voice texting (where the user verbalizes the message content and the phone transcribes the message) and Swype (where the user completes one continuous swipe approximately across all letters of the word to be typed and the phone predicts the word that the user was intending to type).
Like phone users, laptop users may type on their devices to instant message, email, look up content on a search engine, or post on social media. Laptops are also commonly used in school and workplaces where, for example, a student is expected to type assignments or reports on their computer. Individuals who are interested in computer programming may type hundreds of lines of computer code per project.
2.3 Relevant Prior Research
2.3.1 On the Relationship of Sex with Typing Speed and Accuracy
There are physiological differences between males and females. Among these differences is finger thickness, where male fingers are found to be approximately 20% larger in thickness than female fingers. Male fingers are also found to be approximately 10% longer for men than for women (Attwood, 2004).
Dennis J. LaBonty investigated the relationship of finger size to computer keyboard typing speed and accuracy and published his work in 1981. LaBonty's experiment found that there are no relationships between finger length or finger width and typing speed or accuracy for either males or females. LaBonty also found no correlation between male and female typing speeds (LaBonty
1981).
2.3.2 On the Experiential Differences between Hard and Soft Keyboards
Keyboards that consist of physical moving keys imbedded in a keyboard chassis are considered hard keyboards. Soft keyboards replace hard keyboards by displaying a digital keyboard on a screen or flat surface. Hard keyboards are often found on desktop or laptop keyboards, and soft keyboards are often found on phones, iPads, or tablets.
Seckin Celik investigated the factors which influence key entry speed on hard and soft keyboards and mapped those factors to their impacts on the typing experience. He emphasized two main factors that are critical to typists' success when typing on hard keyboards: tactile feedback on finger position and auditory feedback when a key is pressed (Celik, 2013). These two factors are absent when typing on soft keyboards unless the typist actively enabled keyboard clicks in their phone settings, which none of the participants in the following experiment did. Celik found that typists typed more quickly on hard keyboards than on soft keyboards. He also found that position information (raised bumps indicating the finger position to the typist) had a main effect on task completion time and total glance time on the areas of interest and was more impactful when audio feedback (clicking when a key was pressed) was implemented. These added characteristics to soft keyboards allowed them to mimic hard keyboards and illustrated the impact of soft keyboard on typing speed and experience.
Stephen Brewster et. al further investigated the impact of tactile feedback on typing speed, where twelve participants were given ten minutes to transcribe as many lines of provided poems as possible, with and without tactile feedback enabled. Their number of lines entered, total errors, and numbers of errors uncorrected were recorded. It was found that by enabling tactile feedback more lines were typed, less errors were performed, and more errors were corrected. The study suggests "that the tactile feedback generally increased their awareness of mis-hit keys so that they could go back and correct them" (Brewster, 2007).
The combination of these two citations proves that typists are generally quicker on hard keyboards than on soft keyboards and, to increase typing speed on soft keyboards, characteristics of hard keyboards such as auditory feedback and tactile response indicate finger position should be implemented.
-- I
2.3.3 On the Effect of Keyboard Size on Typing Speed
Andrew Sears et. all investigated the effects of touchscreen keyboard size on typing speed by exposing participants to four keyboard sizes ranging from 6.8 cm to 24.6 cm wide. Both novice and experienced users typed faster on the larger keyboard than on the smaller one, with typing speeds on the larger keyboard being approximately 20 W.P.M. and 32 W.P.N. and on the smaller keyboard being approximately 10 W.P.M. and 21 W.P.M. for novices and experts respectively. The drawn conclusions show that typing speeds decrease when keyboard sizes decrease (Sears,
1993).
2.4 Laptop Keyboard Specifics
The keyboards used in the present study were Dell keyboards, MacBook Pro keyboards, and AmazonBasics keyboards. Two models of MacBook Pro keyboards, the scissor and butterfly mechanisms, are described in the subsequent sections. The measured technical details for the four keyboard types are compared in Table 2.1.
Table 2.1: Technical details by laptop keyboard type Keyboard
dimensions Key dimensions
Distance Height Height between
Keyboard type Width' Depth Width Depth (up)2 (down) keys
Dell: 273 90 15 14.5 1 0 3.5 scissor mech. MacBook Pro: 273 95 16 15 1.2 0 3.75 scissor mech. MacBook Pro: 275 95 17 16.5 0.4 0 2.3 butteffly mech. 2 9 1 1 0 0 AmazonBasics 282 98 14.5 14.5 2.8 0 4.5
All dimensions in mm. Typical data shown. ' Keys beyond the shift key were disregarded during
measurements. 2 Measured from surface of keyboard.
The AmazonBasics keyboard, use in this study as the unfamiliar keyboard in laptop keyboard testing, differs from the other three keyboard types in its larger keyboard footprint, smaller individual key dimensions, and higher key height. The Dell models are considered to be most similar to the AmazonBasics keyboard as they use plastic for both the keyboard chassis and individual keys, whereas both MacBook Pro models use an aluminum chassis and plastic keys
(Dell, "Innovative Material Choices") ("MacBook Environmental Report", 2009]. Dell models
and the AmazonBasics keyboard are also close in individual key width and height (approximately 14.5 mm).
The MacBook Pro scissor mechanism keyboards are considered next most similar to the AmazonBasics because, when compared to the butterfly mechanisms, the scissor mechanisms have higher key heights and larger key distances between individual keys. These characteristics
are shared with the AmazonBasics keyboard. The MacBook Pro butterfly mechanism keyboards are considered the least similar to the AmazonBasics because it significantly differs in individual key width, depth, as height, as well as distance between keys.
In the trials to follow, MacBook Pro and Dell users will be identified independently to observe how design similarities between keyboards affect changes in typing speed and accuracy when typing on an unfamiliar keyboard.
2.4.1 Dell Keyboard
A scissor switch mechanism sits under each square key in a Dell keyboard, with multiple scissors
sitting under larger rectangular keys such as the spacebar and shift key. The linkages guide the key straight down onto a silicone or rubber dome to signal to the computer that a key has been pressed, then the linkage reverses direction to reset the key to its upright position. Scissor switch mechanisms are common in other laptop models as well, such as older generations of Apple keyboards (Berger, 2016).
2.4.2 Apple's Scissor Mechanism Keyboard
The scissor switch mechanism described in Section 2.4.1 is also used in older models of MacBook Pro laptops (prior to 2016 models). The mechanism is shown in Figure 2.2. Unfortunately, Apple's scissor mechanism allowed for kepcaps to tilt if the typist hit the key off-center, which often resulted in nearby keys also being depressed. The scissor mechanism was also prone to sticky or dead keys due to detritus accumulation below the keycap. Apple recently replaced the scissor switch mechanism with a new butterfly mechanism that better stabilized the key cap and increase typist precision (D'Onfro, 2015).
Figure 2.2: Traditional scissor mechanism for MacBook Pro 2.4.3 Apple's Butterfly Mechanism Keyboard
The butterfly keyboard was designed by Apple in order to offer more stable keys with a lower profile, designed to offer a more comfortable tying experience. Key height was decreased in order to reduce the accumulation of dust and detritus in the area under the keys. Previous keyboard designs sported a scissor-link lifting method (discussed in Section 2.4.2) and were prone to key failures due to dust and particle infiltration under the key, resulting in an increased
required stroke force and more frequent unresponsive keys.
Apple filed for a patent on the butterfly keyboard design in September of 2014. The patent was filed under the label "Low-travel key mechanisms using butterfly hinges" and was granted under the patent number US 9502193B2 (Niu, 2016). The design featured a butterfly hinge hidden under each key that had a depression stroke between 0.1 mm and 2 mm. The cross-sectional view of the butterfly keyboard as submitted in the patent application is shown in Figure 2.3.
2022a 200 2
CI K
20K0
Figure 2.3: Section view of originally patented butterfly keyboard. The butterfly hinge (2050) is fastened
under the middle of the letter key and rotates to lower the keycap (2014) to depress the middle button. The key's low profile and hard-to-access sliding pin (2057) work to prevent dust and detritus from jamming the keys.
Apple's mid-2018 update of the butterfly keyboard included a membrane placed between the individual letter and the structure's resting surface. The membrane's advertised intention was to further prevent detritus ingress and soften the contact noise of individual letters. Users have also mentioned that the membrane provides extra bounce to the keys and assists the depressed key in returning to its upright and resting position. Apple filed for a patent in 2016 under the label "Ingress prevention for keyboard", which is currently under review. The cross-sectional view of the butterfly keyboard with protective membrane as submitted in the patent application is shown in Figure 2.4.
103 21
319 215 13210
3I:A 16
/~1--14 2 11
Figure 2.4: Section view of modified butterfly keyboard with membrane. The membrane (213) is fastened
between the structure's resting surface and the keyboard layout web (104) that defines all key positions. The membrane prevents particles from blocking the butterfly hinge's path of motion and jamming the key. Unfortunately for Apple, the butterfly keyboard has introduced new methods of key failure. Three lawsuits have been pursued because of the keyboards' tendencies to type doublets (repeated letters for a single key depression) and provide depression resistance. Instead of the keys refusing to lower as a result of invasive particles under the key, Apple's butterfly keyboard keys jam mechanically when the pin refuses to slide through the slot (2057 in Figure 2.4).
Many owners of MacBook Pros with the butterfly keyboard have been vocal about their negative experience in switching to the new keyboard type, expressing frustrations about the dead keys, sticky keys, and unintended doublets (Clover, 2019) (Lloyd, 2019). Home remedies to the dead keys and doublet-typing include blowing on the keys with compressed air ("How to Clean the
Keyboard of Your MacBook or MacBook Pro"), wedging a piece of double-sided tape under the
letter cap (Yoo, 2016), and sliding a toothpick around each key to clear its edges ("How To Fix
Sticky Keyboard Keys on a MacBook"). In an attempt to win back its disgruntled consumers,
Apple launched a keyboard service program to replace keys or keyboards for MacBooks and MacBook Pros from years 2015-2017 ("Keyboard Service Program for MacBook and MacBook
2.4.4 AmazonBasics Keyboard
The AmazonBasics wired keyboard is available for purchase from Amazon.com. The keyboard is depicted in Figure 2.5.
Figure 2.5: AmazonBasics wired keyboard
Both the keys and the chassis are made of black plastic, and the chassis encases both a silicone layer and electronics. After a key is pressed, it is lifted back to its upright position by raised bumps in the silicone layer that are referred to as dome switches ("What Is a Dome-Switch
Keyboard?", 2017) The matrix of dome switches are shown in Figure 2.6.
j4~
Figure 2.6: Silicone dome switches to raise depressed keys in AmazonBasics keyboard ICA
2.5 Phone Keyboard Specifics
The phone models used in these experiments were iPhone and Droid Razr M. The dimensions for the various iPhone models are shown in Table 2.2.
Table 2.2: Technical details by iPhone generation Phone dimensions Screen dimensions
iPhone model Width Height Width Height
iPhone SE 58.6 123.8 49.9 88.5 iPhone 6S 67.1 138.3 58.5 104.1 iPhone 7 67.1 138.3 58.5 104.1 iPhone8 67.3 138.4 58.5 104.1 iPhone 8+ 78.1 158.4 68.5 121.8 iPhone X 70.9 143.6 61.8 133.7 iPhone XR 75.7 150.9 65.0 140.7 All dimensions in mm.
Table 2.2 shows the ranges in phone and keyboard dimensions for all iPhone generations that were used during these tests. All dimensions have increased throughout iPhone generations. The iPhone 7 was used as a representative of the iPhone models when comparing to the Droid Razr
M, given that the iPhone 7's dimensions are in the middle of each dimension range across iPhone
generations, The measured technical details for the iPhone 7 and Droid Razr M are compared in Table 2.3.
Table 2.3: Technical details by phone type
Phone dimensions Keyboard dimensions Key dimensions
Keyboard Distance
type Width Height Width Height between keys Width Height
iPhone 7 67 138 58 32.4 1 5 6.6
Droid Razr M 65.5 123 53 30 1 4.8 6
All dimensions in mm.
Table 2.3 shows that the Droid Razr M is smaller in all dimensions except for the distance between keys (where both keyboards had a distance of 1 mm between keys). In fact, the Droid Razr M is only larger than one iPhone generation that was used in testing: the iPhone SE. All other iPhone models are larger than the Droid Razr M in phone height and width. Comparing the keyboard sizes between the iPhone 7 and Droid Razr M show that the iPhone has a larger
keyboard by 5 mm in width and 7.6 mm in height, and the footprint of each key is larger on the iPhone 7.
Beyond the differences in dimensions of the keys, keyboard, and phone itself, the two keyboards have some characteristics in common. In addition to the same QWERTY key layout, both keyboards have the shift key to the left of the 'z' key and the 'backspace' key to the right of the
'i' key. The key to shift to the numbers and punctuation keys lies in the bottom left corner of each keyboard.
However, another notable layout difference lies on the bottom line of each keyboard. The Droid Razr M keyboard offers quick selection of the period key, which sits between the spacebar and the 'Go' button. This is not offered on the iPhone and therefore may be unfamiliar for users who are accustomed to typing on an iPhone. Another difference is to the left of the space bar where the Droid Razr M keyboard places the forward slash instead of the emoji keyboard.
a) b)
q w e r t y u
i
o p q w e r t y u i o p a s d f g hj
k I a s d f g h j k Iz x c v
b n
m z x c v b n m 40123 Q y space tum ?123 Go
3. Methods
Twelve participants were recruited to perform typing trials on hard and soft keyboards. Each 2-hour trial session measured how typing speed, accuracy, and specific mistake type varied across device familiarity (comparing typing on the participant's personal keyboard to typing on an unfamiliar keyboard for both laptops and phones), device type (comparing typing on a laptop keyboard to typing on a phone keyboard), participant sex, and undergraduate major.
3.1 Subject Demographics
Twelve undergraduate students at MIT with f ages of 18 to 23 were recruited for this study. Seven of the twelve (58.3% of participants) identified as female. The age and sex distributions of participants are shown in Table 3.1. The undergraduate department count for the participants are shown in Table 3.2.
Table 3.1: Participant Age and Sex
Participant Count
Age Male Female
18 0 1 19 0 1 20 2 1 21 0 2 22 3 1 23 0 1
Table 3.2: Participant Count by MIT
Undergraduate Department
Department Participant
Count
Biology 1
Computer Science and Engineering 4 Electrical Engineering and 1 Computer Science
Environmental Engineering 1 Mechanical Engineering 4 Spanish
3.1.1 Subject Technology Demographics
All subjects personal laptops were either either MacBook Pros or Dell models. MacBook Pro
models were grouped into those prior to 2016 and those after 2016, because of the significant change in keyboard design that Apple launched in 2016, as mentioned in Section 2.4 of the Background. The distribution of laptop models are found in Table 3.3. All subjects used an iPhone, with models listed in Table 3.3.
Table 3.3: Participant Count by Laptop and Phone Model
Laptop Model Participant Count iPhone Model Participant Count
MacBook Pro Models prior to 2016 3 iPhone SE 1
Models 2016 and later 5 iPhone 6S 1
Dell Latitude 1 iPhone 7 2
Inspiron 1 iPhone 8 and 8+ 3
XPS 2 iPhone X and XR 5
3.2 Testing Procedure
Trials were conducted on the campus of the Massachusetts Institute of Technology in classrooms, public study rooms, libraries, and dorm rooms. The trial participant brought with them their personal laptop and personal mobile phone, both fully charged. They were then provided with an unfamiliar keyboard, an AmazonBasics Wired Keyboard, which was chosen because it varied in key height and material from the personal laptop keyboards for all subjects. Before each participant's testing session, the participant completed an informational survey to provide more details on the individual's background in technology use, as well as basic demographic information. The informational survey template is found in Appendix A.
Each participant's full testing session lasted approximately two hours long. During these trials, the participant was asked to complete a series of typing tests. The text of the passages used for the tests are in Appendix B. Before each newly introduced typing test, the participant was encouraged to complete practice runs until they felt comfortable with the typing test. Each testing session followed this schedule:
Test 1: Personal vs. unfamiliar phone keyboards: Passage transcription 1 of 3
1. Transcribe Phone Passage 1 with personal phone, Autocorrect enabled
2. Transcribe Phone Passage 2 with personal phone, Autocorrect disabled
3. Transcribe Phone Passage 3 with unfamiliar phone, Autocorrect enabled
4. Transcribe Phone Passage 4 with personal phone, Autocorrect enabled
Test 2: Personal vs. unfamiliar laptop keyboards: Passage transcription 1 of 2
5. Transcribe Laptop Passage 1 with personal keyboard
6. Transcribe Laptop Passage 2 with unfamiliar keyboard 7. Transcribe Laptop Passage 3 with personal keyboard 8. Transcribe Laptop Passage 4 with unfamiliar keyboard
Test 3: Personal laptop typing tests for speed, accuracy, and specific mistake types: 9. Complete typing test on keyhero.com at comfortable speed, maintaining accuracy 10. Complete typing test on keyhero.com to achieve highest typing speed possible 11. Complete typing test on keyhero.com without utilizing the backspace key 12-17: Repeat Steps 9-11 two more times for a total of three trials at each condition.
Test 4: Personal vs. unfamiliar phone keyboards: Passage transcription 2 of 3 18. Transcribe Phone Passage 1 with personal phone, Autocorrect disabled 19. Transcribe Phone Passage 2 with unfamiliar phone, Autocorrect enabled
20. Transcribe Phone Passage 3 with personal phone, Autocorrect enabled
21. Transcribe Phone Passage 4 with personal phone, Autocorrect disabled Test 5: Personal phone typing test for speed and specific mistake type:
22. Complete typing test on TapTyping application at comfortable speed 23-24: Repeat Step 22 two more times for a total of three trials
Test 6: Personal vs. unfamiliar laptop keyboards: Passage transcription 2 of 2 25. Transcribe Laptop Passage 1 with unfamiliar keyboard
26. Transcribe Laptop Passage 2 with personal keyboard 27. Transcribe Laptop Passage 3 with unfamiliar keyboard 28. Transcribe Laptop Passage 4 with personal keyboard
Test 7: Personal vs. unfamiliar phone keyboards: Passage transcription 3 of 3 29. Transcribe Phone Passage 1 with unfamiliar phone, Autocorrect enabled 30. Transcribe Phone Passage 2 with personal phone, Autocorrect enabled 31. Transcribe Phone Passage 3 with personal phone, Autocorrect disabled 32. Transcribe Phone Passage 4 with unfamiliar phone, Autocorrect enabled
The experimental protocol was designed to minimize the effects of device and passage familiarity on the results. Gaining familiarity with the unfamiliar devices was prevented by scheduling as much time as possible between the repeated use of that unfamiliar device. Gaining familiarity with unfamiliar devices was also prevented by alternating conditions between familiar and unfamiliar devices, as done in the phone trials (Tests 1, 4, and 7) and laptop trials (Tests 2 and 6). For example, Tests 1, 4, and 7 all used the unfamiliar phone (Droid Razr M). These tests were strategically placed in the beginning, middle, and end of the testing period to ensure that there was a significant break before the participant once again typed on the unfamiliar keyboard and that the participant would type on their personal phone at least twice more before returning to the unfamiliar phone. This strategy was repeated for the laptop keyboard trials (Tests 2 and 6). Similarly to how device familiarity was prevented, passage familiarity was prevented by scheduling as much time as possible between repeated transcriptions of a single passage. This ensured that the participant did not have the chance to begin memorizing the passage, which would influence the participant's typing speed. The group of participants tested in this study is neither a complete nor truly random selection of test subjects at MIT or elsewhere. While every effort was made to reduce the effect of confounding factors, other factors such as inattention, testing fatigue, nerves, lack of sleep, and other personal external distractions may have affected individuals' typing speeds during trials. This study methodology could be extended and expanded to more subjects in order to allow for the results to be extended to the general population.
The following sections will describe the procedure for each test in more detail. They are organized by test type because the tests outlined above (Tests 1-7) include multiple trials of a single test. Section 3.2.1 describes the procedure for Tests 1, 4, and 7. Section 3.2.2 describes the
procedure for Tests 2 and 6. Section 3.2.3 describes the procedure for Test 3. Section 3.2.4 describes the procedure for Test 5.
3.2.1 Speed by Familiarity of Phone and Presence of Autocorrection
Tests 1, 4, and 7 provided the participant with four passages of 55, 55, 58, and 57 words in length. Participants transcribed each passage with 1) personal mobile phone with their usual level of Autocorrect, 2) their personal mobile phone with Autocorrect turned off, and 3) an unfamiliar phone (Droid Razr M, 2012 release date) with Autocorrect enabled. The passages are included in Appendix C. The time taken for the participant to perfectly transcribe the passage was recorded. The four passages were transcribed by the participant three times under three different conditions
(personal phone with Autocorrect, personal phone without Autocorrect, and unfamiliar phone with Autocorrect), each time changing the testing condition in order to mitigate the impact of passage familiarity on speed (see Section 3.2 for the testing timeline). The three trials were
spaced out over the length of the two hour testing period to further decrease the impact of passage familiarity. An example table to record data for this test is provided in Table 3.4.
Table 3.4: Data collection for observing speeds between Autocorrect and familiarity levels Personal vs. Unfamiliar phone keyboard
Passage I Passage 2 Passage 3 Passage 4
Word count: 55. Word count: 55. Word count: 58. Word count: 5 7.
Personal w/ Auto. first Personal w/o Auto first Unfamiliar first Personal w/ Autofirst Autocorrect Personal Unfamiliar Personal Unfamiliar Personal Unfamiliar Personal Unfamiliar Disabled 10.11.12.8
Enabled 104.01 128.63 96.07 120.84 103.72 125.3 108.6 130.03
"Personal" indicates the participant's personal mobile phone. "Unfamiliar" indicates the Droid Razr M, a phone that the participant is unfamiliar with in regards to typing.
3.2.2 Speed by Familiarity of Laptop
Tests 2 and 6 provided the participant with four passages varying from 58, 58, 59, and 60 words in length. The passages are provided in Appendix B. The participant was asked to type each passage on both their personal laptop keyboard and on the provided AmazonBasics keyboard, and the time to perfectly transcribe each passage was recorded in seconds. The passages were repeated between both keyboard types to keep the word count and level of word complexity constant between trials. Two passages were written first on the participant's personal keyboard then the unfamiliar keyboard, and the other two passages were written first on the unfamiliar keyboard then the participant's personal keyboard. The table utilized for data collection is shown in Table 3.5 and has been filled with another participant's trial results. To mitigate the impact of passage familiarity on the typing speed, other test types were included before the participant was asked to transcribe the same passage again.
Table 3.5: Data collection table for testing laptop keyboard familiarity effects
Personal vs. Unfamiliar laptop keyboard
Passage 1 Passage 2 Passage 3 Passage 4
Word count: 58. Word count: 58. Word count: 60. Word count: 59. Personal first.' Unfamiliar first Personal first Unfamiliar first Personal Unfamiliar Personal Unfamiliar Personal Unfamiliar Personal Unfamiliar Time (seconds) 65.1 68.43 65.96 70.77 63.42 61.87 97.77 80.13
1 This cell provides specifics on the passage that is being transcribed during this trial. The first line provides the word count of the passage and the second line indicates which keyboard would be used during the participant's first transcription of that passage.
3.2.3 Speed, Accuracy, and Mistake Type by Testing Condition on Personal Laptop
Test 3 was completed on each participant's personal laptop. During this test, the participant was asked to complete a 2- to 7-line typing test on keyhero.com. After the participant transcribed the passage, the typing test displayed the participant's average words per minute as well as the typing accuracy and type of errors performed during the test, which were colored for visual aid. The types of errors are as follows:
Bad case (pink): Indicates that the letter was mistakenly capitalized when expected
lowercase, or the opposite. For example, typing "the" instead of "The" at the start of a sentence.
Bad ordering (puiple): Indicates that a letter was typed out of order. For example, typing
"thoery" instead of "theory".
Doublet ( ): Indicates that a letter was mistakenly typed twice. For example, typing
"heree" instead of "here".
Neglect (red): Indicates that a mistake was not corrected by the typist. For example,
leaving a misspelling in the passage and continuing on without ever fixing it.
Misspelling (wranie): Indicates that the participant added the incorrect letter. For
example, typing "ribben" instead of "ribbon".
Punctuation (mrange): Indicates that the participant neglected to add or incorrectly added
punctuation. For example, typing "first and" instead of "first, and".
Participants were asked to complete twelve conditioned typing tests on keyhero.com using their personal laptop. The conditions were as follows:
Condition 1: Comfortable speed, maintaining accuracy. The instructions to the subject
were to type as if they were typing a document, where accuracy should be maintained, errors should be fixed, and typing tempo should remain natural to the participant.
Condition 2: Highest possible word count. The individual was asked to type as fast as
possible, neglecting accuracy or errors. The words per minute penalty naturally applied
by keyhero.com for inaccuracy was added to the average speed for the trial to guarantee
Condition 3: No backspace. This condition imposed that the "Backspace" or "Delete"
key on the laptop's keyboard could not be used. Participants were notified that, if the "Backspace" or "Delete" key was pressed, the trial would be restarted.
Conditions were rotated in turn from Condition 1 to Condition 2 to Condition 3, then the set of three conditioned trials were repeated twice more for a total of nine trials. The results were reported in an table that tracked the average speed for the entire trial, as well as the count for each individual mistake type. The table utilized for data collection is shown in Table 3.6 and has been filled with one participant's trial results.
Table 3.6: Data collection table for personal laptop imposed condition test
Personal laptop
Comfortable speed, As fast as possible, No backspace allowed maintaining accuracy get high word count
Trial1213 A Trial Trial Trial Trial Trial Trial
1 2 3 A 1 2 3 Avg. 1 2 3 A
Average speed (W.P.M.2) 51.35158.01 163.17 57.51 53.28 63.16 65.90 60.78 53.58 54.73 55.81 54.71
Mistakes
Advertised accuracy 69.42 65.93 60.77 65.37 44.31 50.33 53.88 49.51 73.68 46.78 75.78 65.41
Capitalization (pink) 2 0 0 0.67 0 1 0 0.33 0 0 0 0
Bad ordering (purple) 2 0 1 1 0 0 0 0 0 0 0 0
Doublet( e ) 0 0 0 0 0 0 0 0 0 0 0 0
Neglect (red) 3 5 8 5.33 11 7 2 6.67 3 9 3 4.67
Misspell (oiang) 9 5 4 6 2 3 2 2.33 0 0 0 0
Punctuation (oranigec) 0 0 0 0 0 0 1 0.33 0 0 0 0
1 Average of the three trials, rounded to the nearest hundredth. 2 words per minute 3.2.4 Speed, Accuracy, and Mistake Type by Device Type
For Test 5, the participant downloaded the mobile phone typing test application TapTyping and used the "Speed Test" function, which provides the participant with a short passage to transcribe of approximately 30 words in length. Once the passage had been transcribed by the participant, the application displayed the participant's typing speed in words per minute, percent accuracy, time to complete the trial, and "Instant Replay" function. The speed (in words per minute) and time to complete the trial were recorded, as well as the specific error types found through watching the Instant Replay. The specific error types are as follows:
Space: Participant either added an incorrectly-placed space between words or neglected
to input a required space. For example, typing "to theleft" instead of "to the left".
Spelling: Participant added the incorrect letter. For example, typing "ribben" instead of
"ribbon".
Punctuation: Participant neglected to add or incorrectly added punctuation. For example,
typing "first and" instead of "first, and".
Other: Any extraneous error was categorized as "Other" and described in this label.
The table utilized for data collection is shown in Table 3.7 and has been filled with another participant's trial results.
Table 3.7: Data collection table for observing mistake types on personal phone Personal phone
Comfortable speed, maintaining accuracy Trial 1 Trial 2 Trial 3 Average
Time (seconds) 55 54 48 52.33 Average speed (WPM) 26 25 32 27.67 Mistakes Space 0 1 0 0.33 Spelling 5 0 0 1.67 Punctuation 0 0 0 0 Autocorrected word 0 0 0 0 Other 0 0 0 0
Three trials were conducted using TapTyping, a mobile phone application, and the occurrence count for each specific mistake type were recorded in the according cell. Average values have are rounded to the nearest hundredth.
In addition to the error category, the specific keys that produced the error were collected. A table of the intended key, hit key, and frequency was populated to observe which keys are more frequently mistyped. The table that was filled during these trials, along with the table shown in Table 3.7, in shown in Table 3.8 with an example data set.
Table 3.8: Data collection table for recording specific letter mistypes on personal phone Troublesome Keys
Intended Hit Frequency
i 0 1
e c 1
u i 2
The rows of this table were filled in with the mistypes executed by the participant when typing on the TapTyping application. The "Intended" column records the key that the TapTyping passage expected the participant to hit, which is the next letter in the word or phrase that the participant is typing. The "Hit" column records the key that the participant hit, when the key differed from the intended key. The "Frequency" column tracks the number of times that a specific pair of "Intended" and "Hit" keys occurred for that participant throughout the three trials. The table was shortened or extended to fit the number of mistypes unique to that
3.3 Data Analysis
Once the data were acquired, statistical analysis was conducted between trials and subgroups to determine trends and evaluate statistical significance. Statistical significance was evaluated with a confidence level of 95% (p-value < 0.05). Each participant's difference in typing speeds was normalized by their original speed in order to equalize the weight of each difference in the larger analysis. Trends were investigated between independent variables such as Autocorrection level, sex, and device type by separating the data by variable and investigating the statistical significance of change between variables. Statistical significance was determined through paired and unpaired t-tests between participant typing speeds, accuracies, and mistake types.
4 Results and Discussion
Each participant's trial results were recorded and analyzed to observe dependences of typing speed and accuracy on device familiarity, device type, and correction style used. The results have been separated into the following sections: Laptop Trial Results, Phone Trial Results, and Laptop vs. Phone Comparison Results.
4.1 Laptop Trial Results
Laptop trials were conducted through the transcription of four passages on both familiar and unfamiliar keyboards (as described in Section 3.2.2) and completion of 3 typing tests on keyhero.com, each repeated under three conditions: comfortable speed while maintaining accuracy, attempting to achieve the highest possible word count, and prohibiting the use of backspace. The results from passage transcriptions concluded that each participant tended to either decrease in typing speed or maintain a consistent typing speed when typing on an unfamiliar laptop. When the results from all participants were grouped together, the typing speed on the unfamiliar laptop was statistically significantly slower than on the familiar laptop, with speed ratio of (96 2)%.
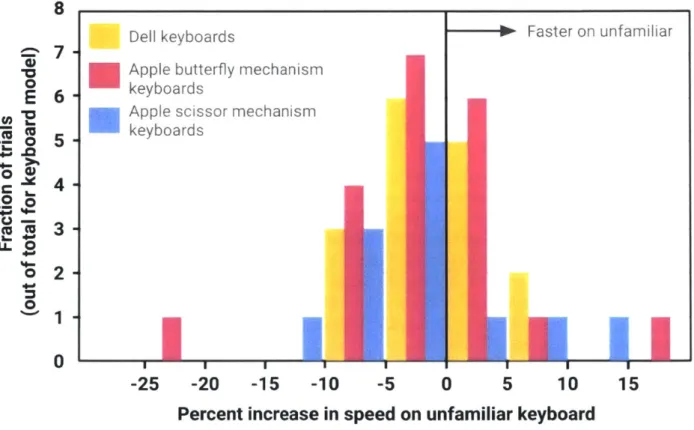
The results were then grouped to compare between participants' familiar laptop models, where the results show that typing on an unfamiliar keyboard that is less similar to a participant's personal keyboard will cause the participant to decrease in typing speed more significantly than a participant who is accustomed to typing one similar to the unfamiliar keyboard ((94.5 + 3.5)%
for less similar laptops and (97.3 2.4)% for most similar laptops). Attempting to type at a faster speed did not affect the typing speed but increased the frequency of neglect errors by a factor of 20, and prohibiting the use of backspace caused participants to type 10% slower than their comfortable speeds on average but decreased the frequency of certain errors such as capitalization, bad ordering, misspelling, and punctuation. Misspellings and bad ordering are consistently the most frequent error types while typing on a laptop and account for approximately 80% of errors. The following sections describe these results in more detail.
4.1.1 General Results on Laptop Keyboard Familiarity
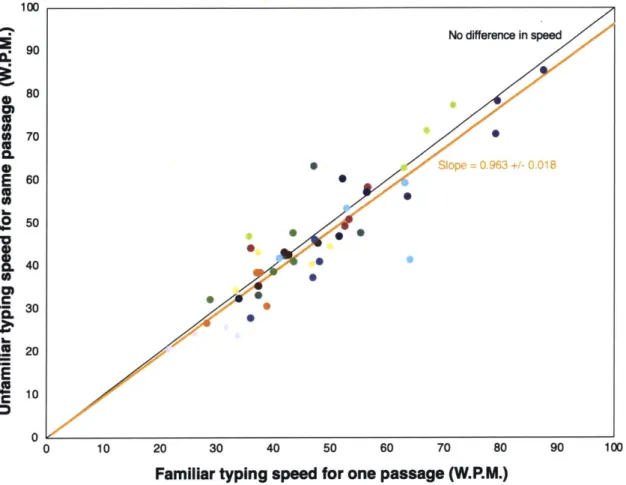
The laptop passage transcription times between personal and unfamiliar laptop keyboards were compared to observe the effects of device familiarity on typing speed, using the results from the tests described in Test 2 of Section 3.2 .The transcription times were compared between the two keyboards for each participant to see how their typing speed changed. Figure 4.1 shows
participants' unfamiliar laptop typing speeds as a function of familiar laptop typing speeds, averaged for each participant and each passage. The four points for each participant are color-coded by participant. CL 0, E 0 0 0 C 100 90 80 70 60 50 40 30 20 10 0 0 10 20 30 40 50 60 70 80 90 100
Familiar typing speed for one passage (W.P.M.)
Figure 4.1: Familiar laptop typing speed to unfamiliar laptop typing speed. Each point is one trial for one
passage by a single participant, color-coded by participant. Points below the line indicate that the participant's typing speed was faster on the familiar laptop keyboard. It is apparent that more of the points fall below the line, with 30 of the 48 transcribed passages (62.5%) resulting in slower typing speeds on the unfamiliar keyboard than on the familiar keyboard. The orange line shows the data's trend, following y =
(0.963 0.018)x. All participants in aggregate typed more slowly on the unfamiliar laptop with speed 94% -98% that of their speed on their own laptop.
There was a slight tendency for participants to type slower on the unfamiliar keyboard, with 30 of the 48 transcribed passages (62.5%) having slower typing speeds on the unfamiliar keyboard than on the familiar keyboard, as indicated by points lying below the y = x line (in black).
A proportional fit of the data yields the line y = (0.96 0.02)x (shown in orange in Figure 4.1), where the uncertainty is specified with 95% confidence. Because the line's slope does not include 1.0 in the confidence interval, the difference between the fit line and the line y = x (no speed difference) is statistically significant. Therefore, data from all individuals tested indicates that they typed more slowly on the unfamiliar laptop with speed (96 2)% that of their speed on their own laptop. Individuals who type at a higher speed on their familiar laptop keyboard will have a larger absolute decrease in their typing speed (in W.P.M.).
No difference in speed
Slope 0.963 +/- 0.018
S*
S-The data were then normalized by the participant's typing speed on their familiar keyboard to observe the percent difference in typing speed for each passage and individual, as displayed in Figure 4.2. The color coding in figures 4.1 and 4.2 are the same for each participant.
Faster on unfamiliar
VA
30 ~20. E C C 0 C10
-2-20. * -30. -40.
I I
I=I
I
14
Figure 4.2: Percent increase in typing speeds between typing on familiar and unfamiliar laptop keyboards,
colored by participant. The four bars for each participant display the four passage results. Bars below the zero line indicate a negative percent change, or decrease in typing speed, where the participant typed slower on the unfamiliar keyboard than on the familiar keyboard.
Figure 4.2 shows that a majority of the percent increases are negative (31 out of the 48, or 65% of trials), indicating that participants are more likely to decrease in speed when typing on an unfamiliar laptop keyboard. By categorizing percent changes of >10% as "large changes", the data show that large changes are seen in nearly half of the trials that decreased in speed and one third of the trials that increased in speed. Most of the positive speed increases are very slight increases below 5%, whereas negative speed increases are more frequently between -5% and
-15%. This indicates that the more frequent and significant changes in speed are speed decreases,
and trials that increased in speed most frequently saw either large (>10%) or small (<5%) percent changes in speed.
The percent changes in speed shown in Figure 4.2 were then categorized into three categories: slower (indicating that the individual's typing speed on an unfamiliar keyboard was <97.5% of the familiar typing speed), unchanged (unfamiliar typing speed was within 2.5% of the familiar typing speed), and faster (indicating that the individual's typing speed on an unfamiliar keyboard
40
I
Slower on unfamiliar
I..'
was > 102.5% of the familiar typing speed. The number of trials labeled as slower, unchanged, or faster along with average speeds for each category are shown in Table 4.1.
Table 4.1: Comparison of laptop speeds between familiar and unfamiliar laptop keyboards Number of trials Average speed Speed category Numerical condition for category qualifying in category (% of familiar speed)
Slower V.f.n < 97.5%Vm 19 92.5 2.0%
Unchanged 97.5%Vfr < Vaaf.< 102.5%Vf. 20 99.51 0.56%
Faster Vunfam> 102.5%Vfm 9 107.3 2.6%
Approximately 80% of trials fell into the slower or unchanged speed categories, indicating that only 1 in 5 trials were typed faster on an unfamiliar keyboard. The average speeds while typing on an unfamiliar laptop, shown as a percentage of the participant's familiar speed for that passage, validate that the speeds for the unchanged trials are indeed unchanged (as the uncertainty for the average speed overlaps 100%, which represents no speed change). The slower and unchanged average speeds are about evenly distanced from 100%, with slower being 7.5% below 100% and faster being 7.3% above 100%.
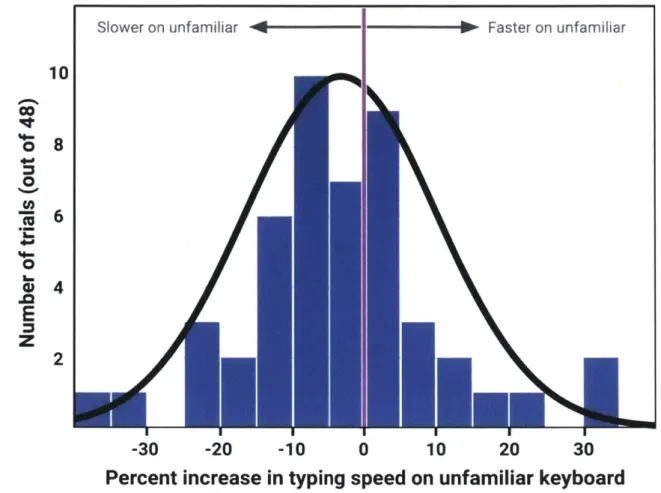
In order to more readily observe the distribution of percent differences for all trials, the data were arranged in a histogram and are shown in Figure 4.3.
Slower on unfamiliar 4 Faster on unfamiliar 101 8 6 4 2
El
U--30 I I I I I 1 -20 -10 0 10 20 30
Percent increase in typing speed on unfamiliar keyboard
Figure 4.3: Histogram of the percent differences in typing speeds on laptop keyboards. Zero along the
x-axis (magenta line) indicates that there was no difference in typing speed between familiar and unfamiliar keyboards. Mean value of the normal distribution is (-3.3 1.9)% and the standard deviation is (13.4
1.4)%.
Figure 4.3 visually demonstrates the aforementioned tendency for typing speed to decrease when typing on an unfamiliar laptop keyboard. Fitting an normal distribution to Figure 4.3 results in a mean value of -3.3% and a standard deviation of 13.4%. The normal distribution's shift to the left reiterates that speed decreases are most frequent when using the unfamiliar AmazonBasics keyboard.
The percent changes shown in Figure 4.2 were then analyzed by participant. Figure 4.4 shows the average percent change for each participant, as well as the 95% confidence interval for each participant's set of four passages.
CO 0 0 0 .0
E
z
30
'0
J20
C
0
Figure 4.4: Percent increase in typing speeds on unfamiliar laptop colored by participant.
from familiar laptop speed, averaged and
As seen in Figure 4.4, only three of the twelve participants saw statistically significant changes in typing speed, all of whom displayed decreased in typing speed on the unfamiliar laptop to speeds ranging from 84% to 93% of the familiar laptop speeds. The other nine participants, though having nonzero average percent changes in typing speed, had 95% confidence intervals that overlapped with zero. The inclusion of zero in the 95% confidence ranges disallows conclusions from being easily drawn regarding how laptop keyboard familiarity impacts typing speed individually for each participant, although as shown in Fig 4.1, when all participants were considered together, there was a statistically significant decrease in typing speed on the unfamiliar keyboard.
Faster on unfamiliar
Slower on unfamiliar