Vous avez des questions? Nous pouvons vous aider. Pour communiquer directement avec un auteur, consultez la
première page de la revue dans laquelle son article a été publié afin de trouver ses coordonnées. Si vous n’arrivez
Questions? Contact the NRC Publications Archive team at
PublicationsArchive-ArchivesPublications@nrc-cnrc.gc.ca. If you wish to email the authors directly, please see the first page of the publication for their contact information.
https://publications-cnrc.canada.ca/fra/droits
L’accès à ce site Web et l’utilisation de son contenu sont assujettis aux conditions présentées dans le site
LISEZ CES CONDITIONS ATTENTIVEMENT AVANT D’UTILISER CE SITE WEB.
READ THESE TERMS AND CONDITIONS CAREFULLY BEFORE USING THIS WEBSITE.
https://nrc-publications.canada.ca/eng/copyright
NRC Publications Archive Record / Notice des Archives des publications du CNRC :
https://nrc-publications.canada.ca/eng/view/object/?id=12322e8f-d674-44d1-a34a-2a16b36b2e20 https://publications-cnrc.canada.ca/fra/voir/objet/?id=12322e8f-d674-44d1-a34a-2a16b36b2e20
NRC Publications Archive
Archives des publications du CNRC
This publication could be one of several versions: author’s original, accepted manuscript or the publisher’s version. / La version de cette publication peut être l’une des suivantes : la version prépublication de l’auteur, la version acceptée du manuscrit ou la version de l’éditeur.
Access and use of this website and the material on it are subject to the Terms and Conditions set forth at
Lifeboat evacuation performance in a range of environmental
conditions
LIFEBOAT EVACUATION PERFORMANCE IN A RANGE OF ENVIRONMENTAL CONDITIONS
A. Simões Ré
Institute for Marine Dynamics National Research Council
Canada
B. Veitch
Ocean Engineering Research Centre Memorial University of Newfoundland
Canada
AUTHOR BIOGRAPHICAL NOTES
António Simões Ré is a Research Officer at the Institute for Marine Dynamics (IMD), National Research Council Canada, where, amongst other things, he has done numerous research projects on lifeboats, life rafts, and an assortment of life saving appliances.
Brian Veitch teaches Ocean and Naval Architectural Engineering at Memorial University of Newfoundland where he holds the Terra Nova Project Junior Chair in Ocean Environmental Risk Engineering.
ABSTRACT
The move away from prescriptive safety regulations and toward performance based standards requires that measures, or benchmarks, of performance be established and that the requisite tools for the standards' ongoing improvement and implementation be developed. This paper is concerned with the evaluation of lifeboat evacuation performance as a function of environmental conditions. Scale model experiments were done of lifeboat evacuation from a floating petroleum installation. This is the first phase of an experimental program that aims to provide objective, reliable data to designers, regulators, and other decision-makers, and to demonstrate the utility of model testing as a performance evaluation tool. The experiments are described and some test results are presented and discussed.
1 INTRODUCTION
A series of large scale model experiments of lifeboat evacuation from a floating platform were done at the National Research Council of Canada’s Institute for Marine Dynamics (NRC/IMD). The main objective of the experiments was to measure evacuation performance as a function of environmental conditions. Risk assessment is a design imperative and a regulatory requirement in many jurisdictions, but published quantitative data on lifeboat evacuation are sparse (e.g. Spouge 1999), which hampers the design process. The discussion here is in the context of offshore petroleum installation safety, although the results are relevant to ship safety. Previous work on evacuation system evaluation using model tests has been reported by Rutgersson and Tsychkova (1999) for ships, for example, and by Campbell
et al. (1983) and Simões Ré (1996) for offshore structures.
Our interest here is in evacuation by lifeboats during emergencies, which must necessarily be done in prevailing weather conditions. Current regulations do not require operators, or duty holders, to demonstrate the capability of evacuation system performance as a function of weather conditions. Apart from their relevance to an overall safety assessment then, the test results quantify performance specifically in those conditions in
which evacuation systems are actually needed (e.g. MacFarlane 1994). Model experiments allow us to investigate evacuation performance and generate statistically reliable data that would otherwise be prohibitively dangerous to collect, if done with full scale manned equipment under controlled conditions, or relatively uncertain, due to the low frequency of occurrence of actual installation evacuations, which are not controlled in the experimental sense (see e.g. Royal Society 1992, pp.19-20).
Evacuation is one part of the Escape-Evacuation-Rescue (EER) process, where escape
refers to escape from the danger on the installation to an evacuation point, evacuation means a planned escape from the installation via lifeboats (or helicopters), and rescue means reaching a level of safety comparable to that obtained before the emergency situation, which should include the availability of medical assistance. The experimental work reported here deals only with the evacuation phase of EER, although the importance of the other phases is recognised.
There are limits to what can be accomplished in model tests. Our experiments model the launch and are particularly concerned with performance during launching and clearing. Launch failures due to equipment failure, such as accidental release or inability to release, are not modelled.
This is an important point. Equipment failure is an important part of a risk assessment. However, the reliability of the mechanical systems is a function of things like maintenance, which we cannot reproduce at model scale. Therefore, model launch failures attributed to launch equipment failure are not included in the results as this class of failure is not necessarily statistically representative of full scale.
2 MODEL TESTS 2.1 Test Design
The main objective of the model test work was to quantify the performance capability of a given evacuation system as a function of environmental conditions. A floating production, storage, and off-loading vessel (FPSO) was used as the platform. The FPSO was tested in its
ballast, intact condition. No damage cases were investigated. The FPSO was arranged such
that it had a 20° heading to the waves and a 57° heading to the wind. The lifeboat was
deployed to the windward side.
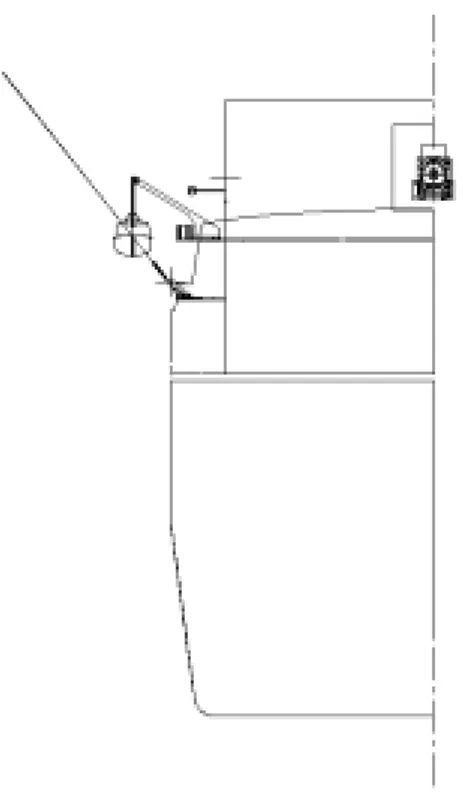
The evacuation system used for this set of experiments was the twin fall davit system. The system was of the straight fall double wire category with the totally enclosed motor propelled survival craft (TEMPSC) stowed and launched parallel to the hull. The basic test setup is shown in Figure 1. The deployment clearance of the lifeboat from the FPSO was 1.5 times the breadth of the lifeboat; the launch height was 26.95m (full scale) above the still
water surface. All tests were done with the TEMPSC in its 100% load condition. The model
TEMPSC was launched at random positions with respect to incident waves, and propulsion power was available when the boat hit the water. An addition of a flexible boom was made to the launch system and a smaller set of comparative experiments was performed. The modified test setup is shown in Figure 2.
The environmental conditions were combinations of wind and waves, which were varied systematically from 1m to 11m (full scale) in wave height, and 7m⋅s-1 to 19m⋅s-1 wind speed. Only steady mean wind speeds were used. Regular waves were used, with periods ranging from 5.5s to 15s. A small set of experiments was run with long crested irregular waves ranging in significant wave height from 3.5 to 10.9 meters and with peak periods between 10.6 and 14.8 seconds.
Figure 1: Basic test configuration.
Figure 2: Modified test configuration.
As the concern here was with the lowering, splash-down, and sail-away phases of evacuation, measures were established to quantify the system's performance during
each phase. During lowering, the TEMPSC's
motions (e.g. pendulum and torsional oscillations) and positions were measured, and collisions with the installation noted. At
splash-down, the position of the TEMPSC
relative to its target drop point and its position on the incident wave were measured, as was its initial set back during the passage of the first wave encountered.
The performance measure during sail-away
was the time required to clear the installation. These measures, a few of which are illustrated in Figure 3, correspond to some of the performance objectives specified recently by Kingswood (2000). For each test configuration, about 20 nominally identical tests were run.
2.2 Test Facilities
The experiments were done in the Ocean Engineering Basin (OEB) at the Institute for Marine
Dynamics. The OEB has a nominal working area of 65m×26m with a maximum working
depth of 3.2m. The basin is fitted with 168 individual hydraulically activated wave maker segments around its perimeter. Wave direction can be varied from 0° to 90° in the basin. Passive absorbers are fitted to the walls opposite the wave boards. Wind is simulated using a horizontal array of 12 analog-controlled fans mounted on support frames.
Figure 3: Measures of performance.
2.3 Floating Platform Model: FPSO
Physical models of the FPSO and TEMPSC were designed and manufactured at a scale of
27.65. The FPSO hull was an accurate geometric representation of a generic FPSO design.
The model mooring was located below the FPSO bottom and was designed to have the
modeled stiffness characteristics of full scale mooring lines. Conventional methods were
used to determine the models' mass and hydrostatic properties. The TEMPSC was launched
from the starboard (windward) side.
An irregular array of reflective spheres mounted on a vertical support at the bow of the
FPSO model was used by the Qualisys Optical Tracking System (QOTS) to track the
six-degrees of freedom motions of the model with respect to an inertial coordinate system. An anemometer was mounted just aft of the davit arms to provide wind speed information in the
area of the TEMPSC location. Four video cameras were used to observe the TEMPSC from
start of descent to splash-down and sail-away. 2.4 Lifeboat Model: TEMPSC
The model lifeboat was representative of a typical 80-person TEMPSC. The model was fitted
release block to accommodate the attachment of a tagline ring used with the flexible boom. The TEMPSC model was fabricated from carbon fiber reinforced plastic. The model hull
was fitted with a working rudder, rudder servo, 18mm three bladed propeller, shaft, DC
motor, motor controller, receiver unit, rechargeable battery pack, accelerometer, and simulated hydrostatic interlock release unit. The hydrostatic release unit was modeled by inserting four brass pins (bow, stern, port and starboard at midships) at an equivalent full
scale height above base line of approximately 0.5m. In order for the TEMPSC blocks to be
given the open command, an electronic circuit had to sense that at least three of the pins were
submerged. The circuit also activated a light positioned on the TEMPSC canopy that served
as a visual trigger for the operator to open the block. This arrangement ensured that no accidental opening of the blocks was possible and modeled an “On-Load” system with hydrostatic interlock. The accelerometer was mounted on the keel and oriented such that it recorded lateral accelerations.
The canopy half was fitted with a servomotor that activated the forward and aft davit falls release mechanism. The same servomotor was also used to activate the hook safety of the flexible boom system. Reflective tape was attached to the canopy at several locations for use with the QOTS. Prior to the launching tests, model TEMPSC speed trials were conducted in the towing tank in calm water with the model in its test configuration. An average speed of 5.94 knots (full scale) was achieved, which is slightly below the target of 6 knots that is required by the IMO (1997).
The TEMPSC was stowed parallel to the hull of the FPSO. The davit arms swung out to
place the TEMPSC centre line approximately 1.5 TEMPSC beams from the deck edge. The
davit system's main components were the winch drum for the cable storage, the winch brake for controlling the speed of descent, the release mechanism that disengages the falls, and the cables themselves. The rate of descent and release mechanism were adequately modeled, but cable properties such as diameter, breaking strength, and stiffness were not modeled. Release of the forward and aft cables was simultaneous: no problems were encountered with the system. The same system was used to activate the hook safety of the flexible boom configuration.
The boom configuration consisted of a flexible boom held by a saddle support and a set
of hinges attached to a base plate. The base plate was mounted approximately 2.5 TEMPSC
height below the embarkation deck, ⅛×TEMPSC length forward of the forward davit arm,
and ½×TEMPSC beam from the bulwarks. The hinges had a horizontal axis, allowing the
boom to move in a vertical plane with a swing of about 75°. The boom length (≈24 m) was
about the same as the vertical distance from the TEMPSC launching position to the calm
water surface for the FPSO at the ballast draft. The boom support was provided by an
electronic spring controlled by a feedback loop of ram extension versus load. The boom was parked at an angle of 40° with respect to the baseline. A fixed length of line, or tagline, was attached at one end to the tip of the boom and at the other end to a metal ring. The ring fitted
over the boom hook attached at the bow of the TEMPSC forward of the davit release block.
The length of the tagline was set at about the same length as the boom itself.
3 RESULTS AND DISCUSSION
Space limitations preclude presenting a complete description of the results (see Simões Ré et
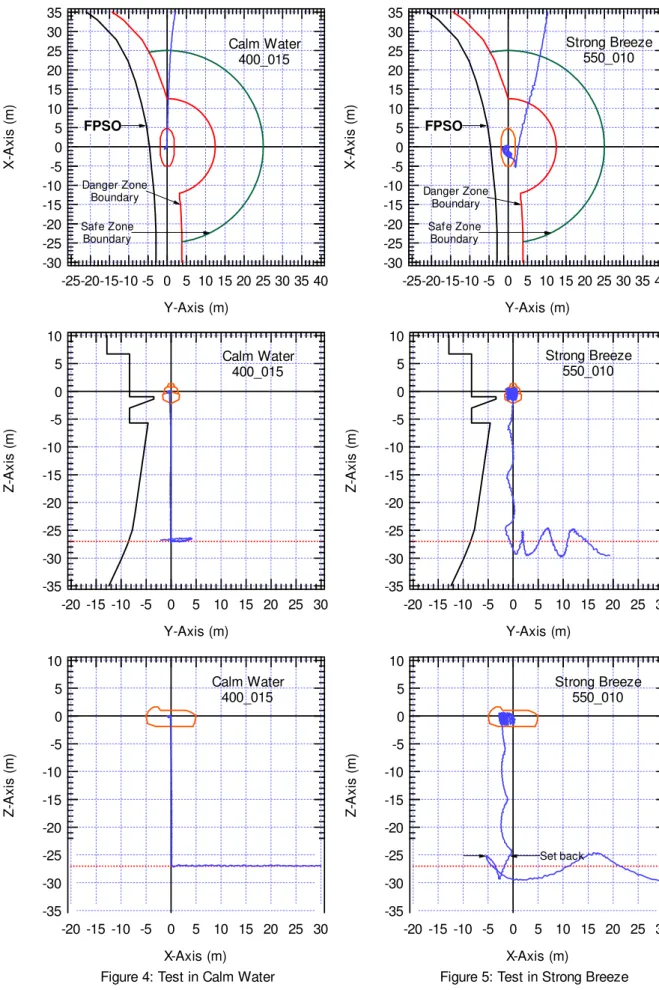
al. 2000). Instead, examples of some of the tests are shown to give a qualitative impression of what was measured and how evacuation performance was affected by weather conditions and launch configurations. Figures 4 and 5 illustrate the lowering, splash-down, and sail-away phases of two tests, the first in calm water and the second in a strong breeze. For each
test, three plots are shown. The top plot shows a plan view, the middle plot is a view along
the centreline of the TEMPSC, and the bottom shows an outboard profile. In each view the
path of the TEMPSC is shown as an uneven line.
In the plan view, the outline of the TEMPSC is shown in its deployed position prior to lowering, which is used as a reference position. A pair of axes is centred at its midpoint. The waterline of the FPSO hull is also shown. Outboard of the FPSO the water surface is divided into 3 regions: a danger zone, an intermediate zone, and a safe zone. The danger zone is the
area bounded by a 12.5m radius from the TEMPSC's reference position and extending 6.6m
outboard from the FPSO's waterline. The region outside a 25m radius is the safe zone, and
the circular band between the danger and safe zones is the intermediate zone.
For the calm water case shown in Figure 4, the path of the TEMPSC is simple: it goes
straight down during lowering, as indicated in the two lower plots; upon splash-down into the danger zone it sails straight ahead through the intermediate zone to safety, as illustrated in the plan view.
For the strong breeze case, the effects of the vessel motions on the TEMPSC's path during lowering are indicated in the two lower plots of Figure 5. Splash-down was on a passing wave's down-slope during this evacuation and the measurements in the bottom plot show that
no forward progress was made until the TEMPSC crested the next wave and motored
down-slope. In fact, the TEMPSC moved backwards, or was set back, as it motored through the
trough and up-slope the first wave. Of the 17 tests completed in these conditions, nine splash-downs occurred in a trough or down-slope, four on a crest, and four up-slope. Set back was observed in almost all cases, except during a few of the crest landings. The greatest set backs were observed in trough splash-downs. These types of measurements were recorded for each of the 157 tests.
Examples of path measurements during TEMPSC lowering in its basic launch
configuration in four different weather conditions are shown in Figures 6 to 9. Set back occurs in all of these examples. Platform motions do not appear significant in moderate and fresh breeze conditions, where the mean wave height and mean wind speed were 0.9m and 5.7m⋅s-1 and 2.3m and 7.4m⋅s-1, respectively, in the examples shown. Platform motions have a noticeable effect in the strong breeze case (4.1m and 9.9m⋅s-1) and dominate the launch in the moderate gale, where the mean wave height and mean wind speed were 5.8m and 11.4m⋅s-1. In fact, the effects of platform motions in the more extreme weather conditions make it difficult at this stage to separate launch performance from platform characteristics.
Figure 10 captures the overall effects of weather conditions on the control of the
TEMPSC path during evacuation. The figure shows envelopes that encompass the paths taken
by the TEMPSC in each set of tests, where a set is comprised of a specific configuration
(either davit or davit with boom) and weather conditions. The paths in two views are shown: the plan view showing sail-away on top, and the outboard profile showing lowering, set back, and sail-away on bottom.
The first six pairs of envelopes correspond to the basic davit launch configuration and the last three are for the boom-assisted configuration. From left to right these encompass 21, 20, 19, 17, 14, 14, 18, 19, and 20 tests respectively. The most obvious trend is that control deteriorates with weather. This can be attributed to the weather alone in the sail-away phase, and to the combined effects of weather and platform motions in the lowering phase.
35 30 25 20 15 10 5 0 -5 -10 -15 -20 -25 -30 X-A x is ( m ) 40 35 30 25 20 15 10 5 0 -5 -10 -15 -20 -25 Y-Axis (m) FPSO Danger Zone Boundary Safe Zone Boundary Calm Water 400_015 -35 -30 -25 -20 -15 -10 -5 0 5 10 Z-A x is ( m ) 30 25 20 15 10 5 0 -5 -10 -15 -20 Y-Axis (m) Calm Water 400_015 -35 -30 -25 -20 -15 -10 -5 0 5 10 Z-A x is ( m ) 30 25 20 15 10 5 0 -5 -10 -15 -20 X-Axis (m) Calm Water 400_015 35 30 25 20 15 10 5 0 -5 -10 -15 -20 -25 -30 X-A x is ( m ) 40 35 30 25 20 15 10 5 0 -5 -10 -15 -20 -25 Y-Axis (m) FPSO Danger Zone Boundary Safe Zone Boundary Strong Breeze 550_010 -35 -30 -25 -20 -15 -10 -5 0 5 10 Z-A x is ( m ) 30 25 20 15 10 5 0 -5 -10 -15 -20 Y-Axis (m) Strong Breeze 550_010 -35 -30 -25 -20 -15 -10 -5 0 5 10 Z-A x is ( m ) 30 25 20 15 10 5 0 -5 -10 -15 -20 X-Axis (m) Strong Breeze 550_010 Set back
Figure 4: Test in Calm Water Figure 5: Test in Strong Breeze
-35 -30 -25 -20 -15 -10 -5 0 5 10 Z-Axis (m) 30 25 20 15 10 5 0 -5 -10 -15 -20 X-Axis (m) Moderate Breeze 500_007 Set Back
Figure 6: Test in moderate breeze.
-35 -30 -25 -20 -15 -10 -5 0 5 10 Z-Ax is ( m ) 30 25 20 15 10 5 0 -5 -10 -15 -20 X-Axis (m) Fresh Breeze 525_002 Set Back
Figure 7: Test in fresh breeze.
-35 -30 -25 -20 -15 -10 -5 0 5 10 Z-Axis (m ) 30 25 20 15 10 5 0 -5 -10 -15 -20 X-Axis (m) Strong Breeze 550_008 Set Back
Figure 8: Test in strong breeze.
-35 -30 -25 -20 -15 -10 -5 0 5 10 Z-Axis (m ) 30 25 20 15 10 5 0 -5 -10 -15 -20 X-Axis (m) Moderate Gale 600_022 Set Back
Figure 9: Test in moderate gale.
Figure 10: Path envelopes in plan (top) and outboard profile views (bottom).
Calm Water Moderate Breeze Fresh Breeze Strong Breeze Moderate Gale Calm Water Fresh Gale Fresh Breeze Fresh Gale x y x z
Basic Configuration Modified Configuration
Scale 0m 20m 40m
Figure 10 also allows for a general comparison of the basic davit configuration and boom assisted launches, with reference to the calm water, fresh breeze, and fresh gale tests. In calm water both configurations are equal, although the boom promotes sail-away from the FPSO at an angle of about 30° to 40°, rather than the straight ahead path taken after splash-down in the basic configuration. The same comments apply to the fresh breeze scenario, although in this case, the unassisted launch heads into the oncoming waves, which are 20° off the bow. In the fresh gale, the boom again promotes a more direct departure from the splash-down site. Further, the set back in rough weather appears to be reduced by the boom and the departure is more controlled. The benefits derived from a boom can likely be improved for a given launch scenario by tuning its length and stiffness, and its position and orientation relative to the TEMPSC. Changes in the launch scenario, such as ballast changes, or damage cases, might render the configuration less effective.
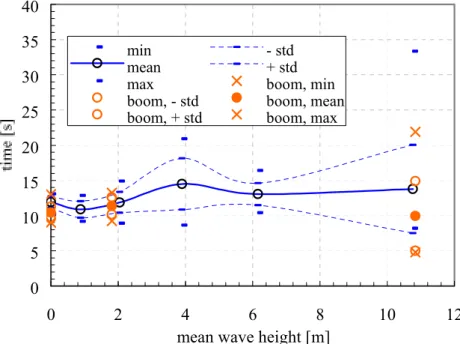
The effect of the boom can also be seen in Figure 11, in which the time taken for the
TEMPSC to reach safety after splash-down is shown as a function of wave height. Both the basic and boom configurations are presented; for the three common weather conditions, the
TEMPSC clears the platform quicker when the boom is used. Figure 11 also indicates that weather had little discernible effect on evacuation performance as measured by this particular criterion, that is, the time taken to sail to safety. This was an unexpected, but repeatable result. 0 5 10 15 20 25 30 35 40 0 2 4 6 8 10 12
mean wave height [m]
min - std
mean + std
max boom, min
boom, - std boom, mean
boom, + std boom, max
Figure 11: Time from splash-down to safety versus wave height.
4 CONCLUSIONS
Model scale testing is an effective technique for evaluating lifeboat evacuation performance. In the series of tests described here, the effects of weather conditions were investigated in terms of several measures, such as time to sail to safety, set back at splash-down, control during lowering, and others. Additional tests were used to compare two different evacuation system configurations. Evacuation performance deteriorated according to some of the performance measures, but not all. A few of the results were presented here; a more detailed account will be presented elsewhere.
Motions of the platform, in the present case a FPSO, had a major effect on the launch. While the influence of motions is certainly relevant to any particular floating installation, it makes it difficult to determine the specific effects of weather conditions on launch performance, as these can be masked by motion effects. As it is evacuation system performance and the effects of configuration parameters, such as height of launch, clearance of TEMPSC at launch, orientation of the TEMPSC at launch, direction of the weather relative to launch, launch point on waves, and others that can be usefully evaluated in systematic series of model tests, the second phase of testing, which is underway at the time of writing, consists of launches from a fixed platform.
Results from these and similar systematic experiments can be used to improve personnel safety during evacuation.
ACKNOWLEDGEMENTS
Financial support of this research was provided by NRC. In-kind support was provided by
the Terra Nova Project. The authors thank the many people at NRC/IMD who contributed to
the fabrication and instrumentation of the models, and helped carry out the experiments.
REFERENCES
Spouge, J. 1999. A guide to quantitative risk assessment for offshore installations. CMPT Publication 99/100.
Rutgersson, O., and Tsychkova, E. 1999. Safety management of the mustering and
evacuation of damaged passenger ships - MEPdesign on the development of a tool box. Proceedings, Learning from Marine Incidents, Royal Institution of Naval Architects, 13 pp.
Campbell, I.M.C., Claughton, A.R., and Kingswood, A.R. 1983. Development of lifeboat launching systems for offshore rigs and platform. Proceeding, International Conference on Marine Survival Craft, Royal Institution of Naval Architects, 11 pp.
MacFarlane, C. 1994. Offshore safety in a cost conscious environment from British and Norwegian perspectives. Proceedings, OFS/OILC Conference, Stavangar.
Cullen, W.D. 1990. The public inquiry into the Piper Alpha disaster. Department of Engergy, London, Vol.II.
Kingswood, A. 2000. Evacuation standards development and quantification. Proceedings, 2nd International Conference & Exhibition on Evacuation, Escape and Rescue, Aberdeen, 18 p.
IMO. 1997. International life-saving appliance code (LSA Code). International Maritime Organization.
Royal Society Study Group 1992. Risk: Analysis, perception and management. The Royal Society, London. 201 pp.
Simões Ré, A., Sullivan, M., and Veitch, B. 2000. FPSO evacuation system performance in a range of environmental conditions. TR-2000-07, Institute for Marine Dynamics, In
preparation.
Simões Ré, A. 1996. Comparative physical model study of offshore evacuation systems.