Publisher’s version / Version de l'éditeur:
ASHRAE Transactions, 115, 2, pp. 1-12, 2009-06-01
READ THESE TERMS AND CONDITIONS CAREFULLY BEFORE USING THIS WEBSITE. https://nrc-publications.canada.ca/eng/copyright
Vous avez des questions? Nous pouvons vous aider. Pour communiquer directement avec un auteur, consultez la
première page de la revue dans laquelle son article a été publié afin de trouver ses coordonnées. Si vous n’arrivez pas à les repérer, communiquez avec nous à [email protected].
Questions? Contact the NRC Publications Archive team at
[email protected]. If you wish to email the authors directly, please see the first page of the publication for their contact information.
NRC Publications Archive
Archives des publications du CNRC
This publication could be one of several versions: author’s original, accepted manuscript or the publisher’s version. / La version de cette publication peut être l’une des suivantes : la version prépublication de l’auteur, la version acceptée du manuscrit ou la version de l’éditeur.
Access and use of this website and the material on it are subject to the Terms and Conditions set forth at
Comparisons of numerical predictions and field tests in a road tunnel
Kashef, A.
https://publications-cnrc.canada.ca/fra/droits
L’accès à ce site Web et l’utilisation de son contenu sont assujettis aux conditions présentées dans le site LISEZ CES CONDITIONS ATTENTIVEMENT AVANT D’UTILISER CE SITE WEB.
NRC Publications Record / Notice d'Archives des publications de CNRC:
https://nrc-publications.canada.ca/eng/view/object/?id=ddd37f8f-347b-46a3-bef9-b6d3bf132753 https://publications-cnrc.canada.ca/fra/voir/objet/?id=ddd37f8f-347b-46a3-bef9-b6d3bf132753
http://irc.nrc-cnrc.gc.ca
Com pa risons of num e ric a l pre dic t ions a nd
fie ld t e st s in a roa d t unne l
N R C C - 5 1 3 4 9
K a s h e f , A .
J u n e 2 0 0 9
A version of this document is published in / Une version de ce document se trouve dans:
ASHRAE Transactions, 115, (2), pp. 1-12
The material in this document is covered by the provisions of the Copyright Act, by Canadian laws, policies, regulations and international agreements. Such provisions serve to identify the information source and, in specific instances, to prohibit reproduction of materials without written permission. For more information visit http://laws.justice.gc.ca/en/showtdm/cs/C-42
Les renseignements dans ce document sont protégés par la Loi sur le droit d'auteur, par les lois, les politiques et les règlements du Canada et des accords internationaux. Ces dispositions permettent d'identifier la source de l'information et, dans certains cas, d'interdire la copie de documents sans permission écrite. Pour obtenir de plus amples renseignements : http://lois.justice.gc.ca/fr/showtdm/cs/C-42
Comparisons of Numerical
Predictions and Filed Tests in a Road
Tunnel
ABSTRACT
A research project has been conducted at the National Research Council of Canada (NRC) to evaluate the effectiveness of in-place emergency ventilation strategies to control smoke spread in the event of a fire in a road tunnel. Some of these strategies date back to the design of the tunnel (1964). Following a recent fire, the operating instructions were revised. A scientific based evaluation of these operation instructions is the main objective of the research study. The research includes both numerical and experimental studies. The numerical study uses the Computational Fluid Dynamics (CFD) model Fire Dynamic Simulator (FDS) to investigate smoke ventilation in tunnels. The experimental study is used to provide the necessary initial and boundary conditions for the CFD model.
In-situ fire tests were contucted in an operating road tunnel using a fire source of 2 MW. Temperature, airflow velocity, pressure and smoke optical density (SOD) values were measured. These data was used to validate the numerical model against small fires.
CFD simulations were conducted to compare with meaured field data. Comparisons were made, at the near and the far field of the fire source, of several parameters included: volumetric airflow, temperature, and SOD values The CFD simulations were able to replicate field tests trends. They provided insight into phnomena observed during the in-situ fire tests. This understanding had been used as the basis to improve the performance of tunnel ventilation system to control smoke spread. The comparison studies showed that both numerical predictions and experimental measurements were, in general, comparable.
As such, the validated CFD model can be used to complement the experiments to analyze different fire and ventilation scenarios. They offer a predictive tool for the situations where the actual fire tests prove to be cumbersome to conduct.
Key words: mechanical ventilation system, emergency ventilation strategies, road tunnel fires, smoke control, In-situ fire tests, Computational Fluid Dynamics, Fire Dynamic Simulator.
INTRODUCTION
Fires are, in general, very complex in nature. Their complexity arises from the fact that the physical and chemical processes (e.g., turbulence, combustion, radiation, etc.) controlling fire and smoke development interact with each other, and with the surroundings. For the systematic design of an effective fire protection system, it is essential that the important transport process controlling fire development is properly understood and that the key components are clearly identified. Because of the mutual interactions of these processes and their coupling with any enclosure, reduced-scale experiments alone are often not sufficient to reproduce full-scale features. Mathematical models supported by full-scale experiments offer a practical solution for a better understanding of fire and the fluid dynamics involved.
Fire protection design in tunnels as in other building types has been, up to the 1990s, based upon empirical approaches supported by a rationale from experimental studies of fire and experience gained from actual fire disasters. The problem with this approach is that it is not possible to conduct enough experiments or fire tests to adequately deal with all possibilities. A good example of the application of empirical techniques to the problems of fire in road tunnels, was given by (Heselden 1976). Improvements in state-of-the-art have traditionally alternated between experimental and mathematical modelling approaches. Experimental approaches include full-scale physical model tests or on-site measurements.
With the advent of more powerful computers, the Computational Fluid Dynamics (CFD) modelling technique is rapidly expanding. CFD models solve the complex differential equations describing the
conservation of mass, momentum, enthalpy, species, at several thousand nodes within the tunnel. The mass and momentum equations describe the fluid dynamics. Whereas the enthalpy equation and the species concentrations equations depict the heat transfer and the transport of combustion products and unburnt fuel. Thus, CFD models simulate the overall fire environment for a specific fire scenario including ambient conditions prior to a fire and provide local predictions of temperature, velocity, smoke concentration, etc, as a function of time. As such, CFD modelling approach offers the prospect of a more general predictive tool for the calculation of conditions prevailing during a fire and for the optimization of smoke control and fire protection measures.
A major difference between CFD models is how the viscosity used in the momentum equation is calculated. The majority of CFD models, e.g. k- ε models (Wilcox 1993), use turbulence models to approximate the turbulent energy and dissipation produced by the fire. This approach results in a solution to an averaged version of the flow equations.
On the other hand, the Large Eddy Simulation (LES) (McGrattan 2000) approach solves the large scales of motion and models the small scales that are assumed to be universal. The LES approach results in an unsteady solution to the Navier-Stokes equations. Because real turbulent flow situations are inherently unsteady, LES methods can have an advantage in modelling turbulent fire-induced flows.
The Fire Dynamic Simulator (FDS) CFD model (McGrattan 2000) is based on the LES approach and solves a form of high-speed filtered Navier-Stokes equations valid for a low-speed buoyancy driven flow. These equations are discretized in space using second order central differences and in time using an explicit, second order, predictor-corrector scheme.
In FDS, fire is represented using the “mixture fraction-based” combustion model. This model directly simulates large-scale convective and radiative transport phenomena. The small length and time scales physical processes are, on the other hand estimated. The actual combustion process in the fire is not simulated. As such, the model inherently assumed that the reaction of fuel and oxygen is infinitely fast (fuel and oxygen cannot co-exist and they will react at any temperature). The local heat release rate is computed from the local oxygen consumption rate at the flame surface.FDS has been the subject of numerous validations (McGrattan 2000). The validation efforts included: comparison with full-scale tests conducted specifically for code evaluation, comparison with engineering correlations, comparison with previously published full-scale test data, comparison with standard test, and comparison with documented fire experience.
The main objective of the article is to rationalize the use of the FDS model in tunnel applications. This was achieved by comparing the FDS predictions against in-situ fire tests measurements contucted using a fire source of 2 MW. The validated CFD model was then used to analyze fire scenarios where the actual fire tests prove to be cumbersome to conduct. Kashef and Bénichou (2008) conducted a numerical parametric study to assess the performance of the emergency ventilation systems of the road tunnel for a fire size of 30 MW.
Tunnel Ventilation System
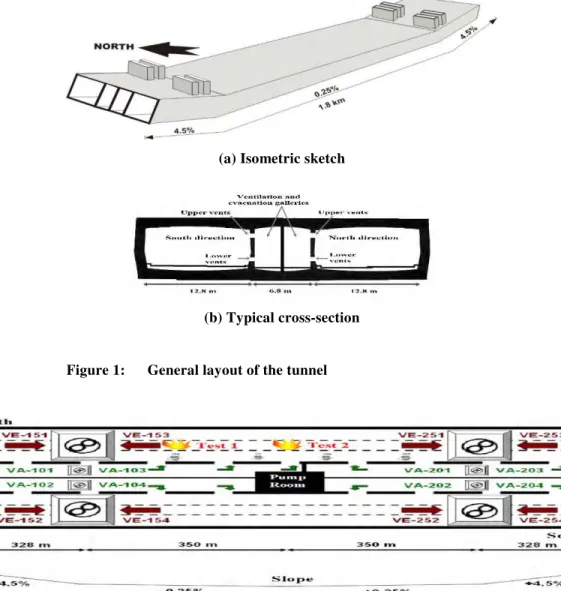
The road tunnel (Figure 1), built in 1964, is located in Montreal city, and travels underwater in a north-south direction. The tunnel is 1.8 km long with three lanes in each direction, inside two concrete tubes. Two ventilation towers are located at the ends of the underwater section. A control and monitoring centre for the tunnel is located at the North tower. A central section separates the two tubes. Galleries located in this section are used to supply air along the tunnel length via openings distributed along the walls and these galleries can also be used as evacuation routes. Doors at various locations along the length of the tunnel provide access to the gallery. There are doors between the galleries providing a route to the other roadway. The wall openings have adjustable dampers to ensure uniform air distribution. The side vents are situated in two rows: upper and lower. The lower and the upper rows are located at heights of 1.0 and 3.9 m above the tunnel floor, respectively, and at intervals of approximately 6 m. The two rows of vents are offset by 3 m.
The tunnel ventilation is provided by a semi-transverse ventilation system with local extraction points (Figure 2). The ventilation system is composed of 8 ceiling exhaust fans (4 fans for each roadway) and 8 fans that supply air through the side vents which are uniformly distributed along one wall for each roadway. All fans can operate in reverse mode. Therefore, fresh air may be supplied at either the ceiling (fans VE151 through VE254), or by fans VA101 through VA204 through the side vents. In the exhaust mode, fans VE151 through VE254 can operate at full or half capacity, and in the supply mode they can
only operate at full capacity. In the supply mode, fans VA101 through VA204 can operate at: half, three-quarter, or full capacity. In the exhaust mode, these fans can only operate at full capacity.
(a) Isometric sketch
(b) Typical cross-section
Figure 1: General layout of the tunnel
FIELD FIRE TESTS
The need for reliable experimental data is common to validation of all fire models. While there is a significant amount of experimental data available from large-scale fire tests in tunnels, many of those tests were performed for reasons other than validation of fire models. In view of this and due to the fact that the tunnel under investigation is an operating tunnel, it was logical to proceed with conducting full-scale field tests using an appropriate fire size to minimize damage to the tunnel structure and its components. The main objective of the current article is to validate the use of FDS CFD code for tunnel applications.
Four fire tests were conducted at two positions in the North Roadway of an operating road tunnel under two different ventilation scenarios. It was concluded from the measured data that the ventilation system helped to control the temperatures and produced enough airflow velocity to prevent the occurrence
of the backlayering phenomenon. The full details of the experimental work of the study are documented in references (Kashef et al. 2003, 2004, 2005).
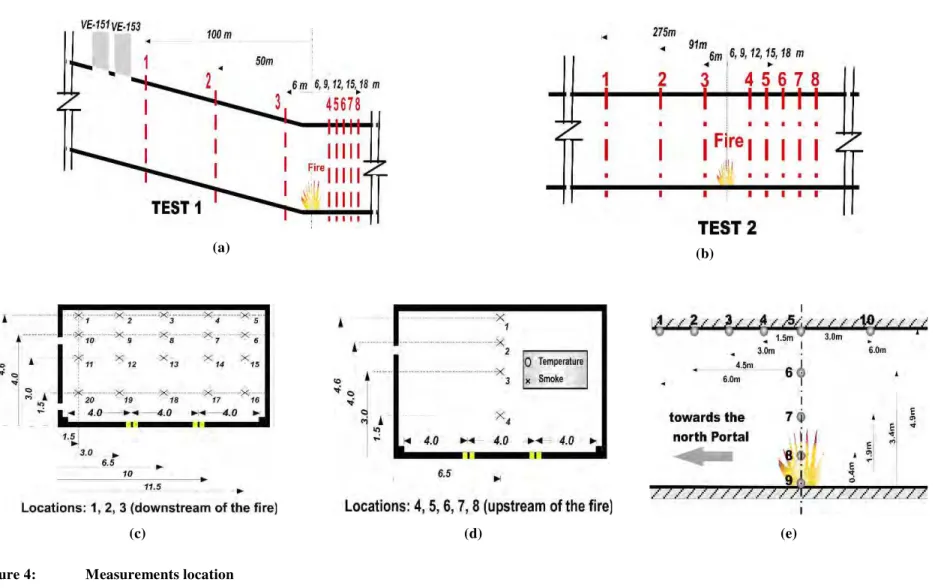
Two fire locations were selected (Figure 2): one close to the exhaust fans at the north end of the tunnel (Test 1) and one in the middle of the tunnel (Test 2). Two different ventilation scenarios were activated for the two tests. For Test 1, the two fans VE151 and VE153 were operated in the exhaust mode and the two fans VA103 and VA201 in the supply mode. In Test 2, a similar ventilation scenario was used except for fan VA103, which was used in the exhaust mode.
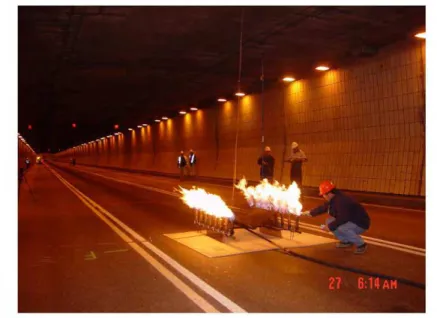
A clean-burning propane burner system that produces minimal smoke is developed for the in-situ fire tests (Figure 3). The burner is about 1.3 m wide and 1.8 m long. This system is a compact, portable and convenient heat source that is capable of producing up to 5 MW of heat output simulating a small car fire. Artificial smoke is used for visualization purposes with four smoke bombs added at 1 min intervals. The heat output of the burner is measured using a gas tube variable area rotometer set for propane gas density with ±2% accuracy on full-scale readings.
Figure 3: Propane burner system
A fire size of 2 MW is selected so as to minimize damage to the tunnel structure and its components and to produce reliable data for the calibration and validation of the numerical models. Temperature and smoke optical density (SOD) were measured (Figure 4). These measurements were taken at sixty locations downstream of the fire (Positions 1 through 3) and twenty locations upstream of the fire (Positions 4 through 8). In addition, air speed was measured at selected lower and upper side vents, the four ceiling exhaust fans (VE fans), the two portals, the middle cross-section of the tunnel, and inside the evacuation paths located between the two roadways. Upstream is defined in the context of this paper as the direction from which the traffic enters the tunnel.
A vane anemometer is used to measure the air velocity and temperature in the range of 0.40 to 25 m/s and 0 to 60oC, respectively, with resolutions of 0.1 m/s and 0.1oC. The accuracies of measurements are ±2% for the velocity and ±0.8oC for the temperature.
A “Pulsed White Light LED” system built in-house is used to measure the obscuration in terms of OD/m. The system has a wavelength in the range (0.450-0.650 mm) and consists of a white light emitting diode (LED) source, aperture and detector. A silicon pin diode was used as the detector. The LED was pulsed to minimize the affects of ambient light and temperature variations. This LED source approximates the light sensitivity of the human eye. The system is accurate to ±5% from 400 to 700 nm and from 0.4 OD/m to 4 OD/m
A thermocouple tree was constructed at each fire location to measure the centreline plume and ceiling temperatures (Figure 4e). The thermocouple tree included eleven thermocouples, distributed vertically along the tunnel height and horizontally at the ceiling spanning 6 m upstream and downstream from the
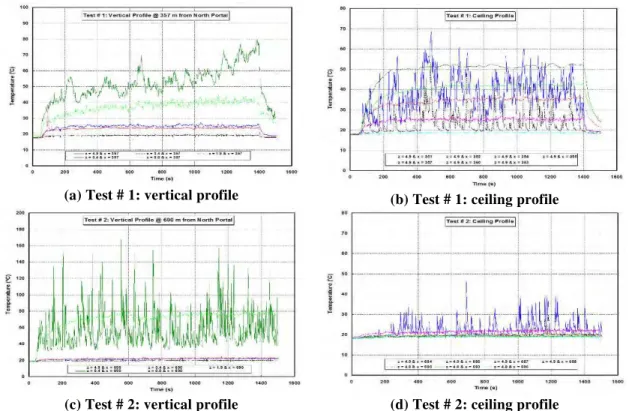
fire.Figure 5 shows the time plots of the vertical and ceiling temperature profiles at the fire location for the tests, respectively. The measurements were recorded for 25 min at each location. The fire grew to the maximum heat release (2 MW) in 5 min and was maintained at that level for about 15 min. The activation of emergency ventilation scenarios modified the flow field in the tunnel. Airflow speeds of 2.5 and 4.6 m/s in the south-north direction were recorded at fire locations for Tests 1 and 2, respectively. As a result, the fire plume was deflected towards the downwind direction. Figure 3 shows a visual angle of deflection of the fire plume of about 25–30o for Test 2. The degree of deflection depends on both the wind speed and plume upward velocity.
Raj et al (1979) suggested the following relationship to calculate the plume deflection of LNG pool fires: 2 1 3 1 2 − − ∞ ∞ ∆ = c f p H T c w u πρ ρ θ sin (1)
where ρ and ∞ ρf are densities of ambient air and fuel vapour respectively, ∆Hcis the heat of
combustion, u is the wind speed, and w is the characteristics plume velocity. The angles of deflection of the plume were determined from Eq. 1 to be about 45o and 32o for the two tests 1 and 2, respectively, which compare well with the visual observation shown in Figure 1. This phenomenon was manifested in the vertical and horizontal temperature profiles in Figure 5. The maximum temperature was detected at 0.4 m above the ground at the two fire locations (Figures 5a and 5c). Figures 5b and 5d denoted high fluctuations of temperature measurements of the two thermocouples on the ceiling at 3 and 6 m downstream of the fire implying the flickering of the deflected plume.
SOD indicates the level of smoke obscuration. The higher the value of SOD, the higher the smoke obscuration and the lower the visibility are. The visibility, VIS, may be calculated from SOD as follows (Klote and Milke 2000):
α K VIS = (2) where: α = extinction coefficient, m-1 = 2.303 SOD
K = proportionality constant, dimensionless (6 for illuminated signs, 2 for reflected signs and building components in reflected light)
VIS = visibility, m
The NFPA 502 (2004) defines the smoke obscuration levels that should be considered to maintain a tenable environment for periods of short duration. Smoke obscuration levels should be continuously maintained below the point at which a sign illuminated at 80 lx (7.5 ft-candles) or equivalent brightness for internally luminated signs, is discernible at 30 m (100 ft), and doors and walls that are discernible at 10 m (33 ft).
Test observations
For both tests, the values of smoke SOD were quite low upstream of the fire and the temperatures were at ambient temperature (about 20oC). These observations indicate that the ventilation scenarios used in the tests created airflow such that the hot smoke moved in the desired direction. That is, it moved from the South to the North in the traffic direction.
In general, close to the fire location, high SOD values were measured and as a result, the visibility was reduced. A few meters from the fire, the SOD decreased at the lower tunnel height and the visibility was in the range of 12 m and higher. However, at locations further away from the fire, the SOD increased at lower elevations and the visibility was reduced especially during Test 2. Moreover, the reduced level of visibility extended, in the case of Test 2, further downstream of the fire location.
(a) (b)
(c) (d) (e)
(a) Test # 1: vertical profile (b) Test # 1: ceiling profile
(c) Test # 2: vertical profile (d) Test # 2: ceiling profile
Figure 5: Temperature profiles at fire location for Tests 1 and 2
For Test 1, ceiling fans VE151 and VE153 were activated in the exhaust mode causing the smoke to be pulled towards the ceiling and, therefore, lower values of the SOD were observed and good visibility was maintained up to the 3.0 m elevation.
It was concluded from the measured values for Test 2 that the ventilation system helped to control the temperatures and produced a high airflow velocity in the middle of the tunnel. However, most of the smoke was extracted through the sidewall vents. The visibility was reduced at a lower elevation downstream of the fire up to a distance of about 300 m. In addition, a dense layer of smoke was observed in the evacuation path limiting its use in this scenario. Moreover, it was observed that the smoke extracted through the side vents was recirculated into the other evacuation paths downstream of the exhaust fans. The full details of the experimental work of the study are documented in references (Kashef et al. 2003, 2004, 2005).
NUMERICAL MODELLING OF FIRE TESTS
The two North and South Roadways concrete tubes are completely separated. Therefore, only the North Roadway of the tunnel and its galleries (Figure 6) were simulated with a grid consisting of about 800,000 control volumes. A special refined grid was constructed around the fire source (60 x 162 x 50). Two transient numerical simulations were conducted to represent the ventilation scenarios used for both fire tests (hereinafter referred to as “Scenario 1” and “Scenario 2”). Fans were simulated as mass sources or sinks depending on the ventilation scenario. Free boundaries with the pressure equal to the static ambient pressure were assumed at the North and South Portals.
A propane source, approximately, 1.8 m long, 1.5 m
wide and 0.7 m high was used to simulate the experimental fire source. The fire source with a heat output of 2 MW was placed at a distance of 356 m and 689 m from the North Portal for Scenarios 1 and 2,
Figure 6: CFD modeled domain (all dimensions are in m)
respectively. The fuel was assumed to be propane with modified soot yield to account for the extra smoke produced by the smoke bombs added for visualization during the field measurements.
Ventilation Scenario 1
Fresh air was supplied through the sidewall vents of the galleries of fans VA103 and V201 and hot smoke and fire products were exhausted through the tunnel ceiling fans VE151 and VE153. Fresh air was also drawn through the North and South Portals.
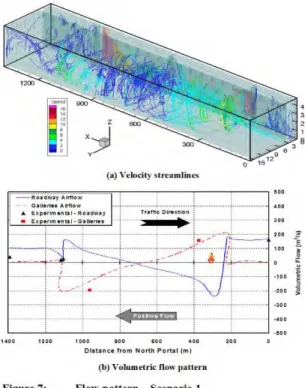
The behaviour of the airflow in the tunnel plays a major role in determining the longitudinal air velocity and, consequently, the ability of a ventilation configuration to clear the smoke and fire products. Figure 7a represents the general flow pattern in the tunnel for Scenario 1. The airflow pattern is represented by streamlines of the velocity vector field. As depicted in Figure 7, the air supplied through the lower and upper side vents created regions of turbulent flow. Furthermore, the air from the larger upper vents was faster than that from the lower vents, which resulted in more air being injected at the top of the tunnel. The air jets forced airflow downwards and created rotational movement of the air. As a result, only a small portion of the tunnel had a longitudinal airflow, near the two portals. These results are in agreement with the field observations that indicated low longitudinal air velocities in the middle section of the tunnel.
Figure 7b shows the average volumetric flow pattern for cross-sections along the tunnel length. A positive air velocity within the tunnel represents airflow from the North Portal towards the South Portal (against traffic). The predicted and measured volumetric flow are comparable. The results indicated that there was a stagnant flow zone near the middle of the tunnel (at 708 m from the North Portal).
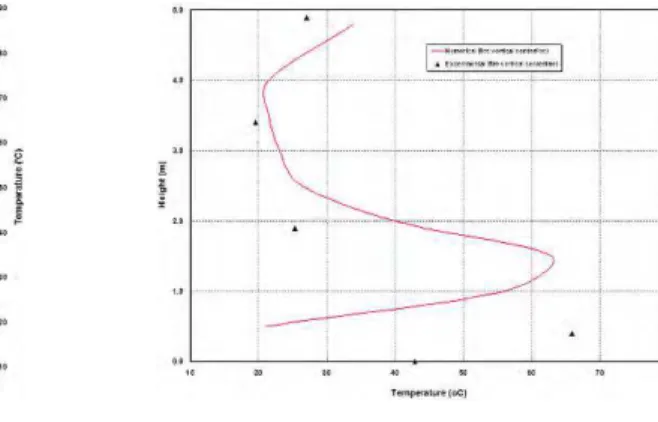
Figures 8a and 8b show the ceiling and vertical temperature profiles, respectively, above the fire source. Both numerical predictions and experimental measurements of the ceiling temperatures revealed that the highest temperature did not occur directly above the fire source (Figure 8a). Rather it occurred at a distance downstream of the fire. This is due to the tilt of the fire plume caused by airflow in the tunnel. The highest ceiling temperature, 80oC predicted by numerical simulations, were rather higher than the measured value, 59oC, (≈27%) and occurred at a distance downstream of the fire further from the fire source than those measured.
Figure 8b shows the comparison of both the predicted and measured vertical temperature profile above the fire. The two profiles are comparable above the height 2 m (approximately flame height). The two set of values are within 20% range of difference. Below that height there is a discrepancy between the predicted and measured temperatures (≈40%), which may be attributed to the fluctuations of the plume that are not fully reproduced in the numerical model.
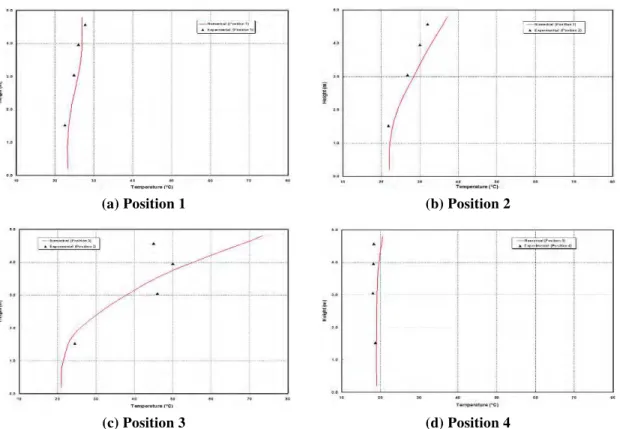
Figure 9 shows the vertical temperature profiles at Positions 1, 2, 3, and 4. The profile at each position is constructed by averaging the values of all measurements or predictions at each height. The numerical predictions and experimental data are comparable (14% range of difference). At Position 3 (Figure 9c), both prediction are comparable up to a height of 4.0. It should be noted that in modelling the side vents, the exact number or locations of the vents were not completelty replicated. Modelling all sidewall vents would have led to a rather large number of grid cells and conseguently unpractical simulation time. Rather, the number of side vents and their locations were modelled such that to ensure reasonable simulation time without impacting on the accuraracy of estimating the flow in/out of the tunnel. As a result, the model did not fully account for the highly turbulent flow at Position3 due to supplying fresh air with high speed from
the sidewall vents of fan VA103 galleries. The prevailing temperature at Position 4 is the ambient temperature.
(a) Ceiling temperature profile (b) Vertical temperature profile
Figure 8: Temperature profiles above the fire source – Scenario 1
Figure 10 shows the smoke optical density (SOD) Profiles at Positions 1, 2, 3 and 4. In general, the numerical predictions and measured values are comparable especially at Positions 1 and 2 further downstream of the fire (20% range of difference). At Positions 3 and 4, the comparisons show discrepancies between numerical predictions and experimental data (>30% difference) that could be attributed to the highly turbulent flow at these positions as a result of supplying fresh air with high speed from the sidewall vents of fans VA103 and VA201 galleries.
Ventilation Scenario 2
In this scenario, fresh air was supplied through the sidewall vents of the galleries of fan V201 and hot smoke and fire products were exhausted through the tunnel ceiling fans VE151 and VE153 and the sidewall vents of the galleries of fan VA103. In this case the flow field was greatly modified with the air speeds at mid-tunnel increased from almost zero (Scenario 1) to about 5.0 m/s providing improved smoke clearance. While the longitudinal air speed increased, the turbulent behavior of the flow in the middle of the tunnel remains as the dominant mode of transport.
Figure 11 shows the vertical temperature profiles at Positions 1, 2, 3, and 4. The numerical predictions and measured values are comparable especially at Positions 1, 2, and 4 (5% range of difference). The prevailing temperature at Position 4 (upstream of fire) is ambient temperature.
Figure 12 shows the SOD Profiles at Positions 1, 2, 3 and 4. The numerical predictions and measured values are comparable especially at Positions 1, 2 and 3 downstream of the fire. At Positions 4 the comparisons show discrepancies between numerical predictions and experimental data.
CONCLUSIONS AND RECOMMENDATIONS
The article reports the successful in-situ fire tests that were carried out in a road tunnel. A fire source of 2 MW was used to conduct the fire tests. Temperature, airflow velocity and smoke SOD values were measured. These data was used to provide the necessary initial and boundary conditions for the CFD model and to partially validate the CFD model against small fires.
The 2 MW fire was selected to minimize damage to the tunnel structure and its components by limiting the temperature at the tunnel ceiling below 100°C. However, this size of fire was appropriate to produce buoyant smoke reasonable enough to judge the capability of ventilation system to control smoke. Each smoke bomb is capable of generating 40,000 cubic feet of greyish white smoke in approximately 3 minutes.
(a) Position 1 (b) Position 2
(c) Position 3 (d) Position 4
Figure 9: Vertical temperature profiles at Positions 1, 2, 3, 4 – Scenario 1
(a) Position 1 (b) Position 2
(c) Position 3 (d) Position 4
(a) Position 1 (b) Position 2
(c) Position 3 (d) Position 4
Figure 11: Vertical temperature profiles at Positions 1, 2, 3, 4 – Scenario 2
CFD simulations, using FDS, were conducted to compare with field data. The comparison studies showed that both numerical predictions and experimental measurements were, in general, comparable. Comparisons were made, at the near and the far field of the fire source, of several parameters included: volumetric airflow, temperature, and SOD values. FDS was sucessful in replicating and explaning the
(a) (b)
(c) (d)
trends and phnomena observed during the in-situ fire tests. This insight had provided the basis to investigate the improvement of tunnel ventilation system performance. Discrepencies between field measureemnets and numerical predictions of temperature and SOD values were observed at locations downstream of the fire for both scenarios. The could be atributed to the highly turbulent flow from the sidewall vents of fans VA103 and VA201.
The main objective of the article was realized by rationalizing the use of the FDS model in tunnel applications. This was achieved by comparing the CFD predictions against in-situ fire tests measurements contucted using a fire source of 2 MW. In another work (Kashef and Bénichou 2008), the CFD model was used to conduct a numerical parametric study to assess the performance of the emergency ventilation systems of the road tunnel for a fire size of 30 MW.
As such, CFD techniques can be used to complement the experiments to analyze different fire and ventilation scenarios. They offer a predictive tool for the situations where the actual fire tests prove to be cumbersome to conduct.
ACKNOWLEDGEMENTS
The author acknowledges the NRC’s researchers, Dr. Noureddine Bénichou and Dr. Gary Lougheed, technical staff, Mr. George Crampton and Mr. Don Carpenter, and the staff of the Ministère des Transports du Québec who immensely contributed to conducting the successful in-situ tests.
REFERENCES
NFPA 502 2004. Standard for Road Tunnels, Bridges, and Other Limited Access Highways. NFPA, 1 Batterymarch Park, PO Box 9101, Quincy, MA 02269-9101, USA.
Heselden, A J M. 1976. Studies of fire and smoke behaviour relevant to tunnels. Proc. Second International Symposium on the Aerodynamics and Ventilation of Vehicle Tunnels, Cambridge, BHRA, paper J1. McGrattan, K.B., Baum, H.R. Rehm, R.G., Hamins, A. and Forney, G.P. 2000. Fire Dynamics Simulator –
Technical Reference Guide. NISTIR 6467, National Institute of Standards and Technology, Gaithersburg, MD.
Kashef, A.; Bénichou, N.; Lougheed, G.D.; Debs, A. 2003. Numerical modelling of air movement in road tunnels. CFD 2003, the Eleventh Annual Conference of the Computational Fluid Dynamics, Society of Canada (Vancouver, B.C. 2003-05-28), pp. 23-30.
Kashef, A.; Bénichou, N.; Lougheed, G.D.; Debs, A. 2003. CFD simulation of in-situ airflow measurements in road tunnels. 5th International Conference Safety in Road and Rail Tunnels (Marseilles, France), pp. 609-618.
Kashef, A.; Bénichou, N.; Lougheed, G.D.; Debs, A. 2004. Application ff CFD Techniques for Modelling Fire in Road Tunnels. CFD 2004, the Twelfth Annual Conference of the Computational Fluid Dynamics, Society of Canada (Ottawa, ON).
Kashef, A.; Lougheed, G.D.; Bénichou, N.; Debs, A. 2005. Investigation of effectiveness of emergency ventilation strategies in the event of fires in road tunnels. ASHRAE Transactions, 111, pp. 1-14. Kashef, A. and Bénichou, N. 2008. Investigation of the Performance of Emergency Ventilation Strategies
in the Event of Fires in a Road Tunnel – A Case Study. Accepted for publication in the Journal of Fire Protection Engineering.
Klote, J., and Milke, J. 2000. Principles of Smoke management. ASHRAE, Inc., 1791 Tullie Circle NE, Atlanta, GA 30329.
Raj, P., Moussa, A., and Aravamudan, K., “Experiments Involving Pool and Vapour Fires from Spills of Liquefied Natural Gas on Water”, U.S. Coast Guard Report No. CG-D-55-79, 1979.