BOTTOM CURRENTS AND ABYSSAL SEDIMENTATION PROCESSES SOUTH OF ICELAND
by
Alexander N. Shor A. B., Harvard University
(1974)
Submitted in partial fulfillment of the requirements for the degree of
Doctor of Philosophy at the
Massachusetts Institute of Technology and the
Woods Hole Oceanographic Institution October 1979
1
-~21/
'7 Signature of Author:Certified by:
Joint Program in Oceanography, Massachu-setts Institute of Technology - Woods Hole Oceanographic Institution, and
Department of barth & Planetary Sciences and Department of Meteorology,
Massachu-setts Institute of Technology .
Thesis Supervisor
Accepted by:
a Joint Oceanography Committee in the Earth Sciences, Massachusetts Institute of Technology - Woods Hole ',ceanographic Institution
MITLIB
RMITLibraries
Document
Services
Room 14-0551 77 Massachusetts Avenue Cambridge, MA 02139 Ph: 617.253.5668 Fax: 617.253.1690 Email: [email protected] http://libraries.mit.edu/docsDISCLAIMER OF QUALITY
Due to the condition of the original material, there are unavoidable
flaws in this reproduction. We have made every effort possible to
provide you with the best copy available. If you are dissatisfied with
this product and find it unusable, please contact Document Services as
soon as possible.
Thank you.
There are numerous pages within this thesis
that contain poor greyscale image reproduction.
This is the best copy available.
-2-BOTTOM CURRENTS AND ABYSSAL SEDlMENTATION PROCESSES SOUTH OF ICELAND
by Alexander Noble Shor
Submitted to the Massachusetts Institute of Technology-Woods Hole Oceano-graphic Institution Joint Program in Oceanography on October 31, 1979, in partial fulfillment of the requirements for the degree of Doctor of Philosophy.
ABSTRACT
An investigation was carried out to observe the geologic effects of steady bottom currants on sediments of East Katla Ridge on the southern insular rise of Iceland. Near-bottom southwest to west-flowing currents exceeded 20 cm sec-1 for two weeks over a 25-kilometer wide section of the ridge flank between approximately 1400 and 1800 meters water depth; maximum density and minimum temperature were observed at 1800 meters.
Total trans ort of Iceland-Scotland Overflow Water was calculated to be 5.0 x 10⁶ m sec-1; suspended sediment transport is approximately
0.4 x 10⁶ grams sec-1, with a net deposition of 10 to 15 cm/1000
years estimated from the flux difference in and out of the station array. Sediment distribution patterns indicate that the current axis, where flow exceeds approximately 15 cm sec~1, is a site of erosion and win-nowing (sand layer formation) while the current margin is a site of rapid accumulation (from observed Holocene rates of 25 to 35 cm per 1000 yr to estimated rates of greater than 100 cm/1000 yr based on 3.5 kHz echo-sounder records). Holocene silty turbidites are locally thick in a sub-marine channel; sandy turbidites and current-winnowed 'sandy contourites.,
are present in the axis of the major submarine canyon.
'Sandy contourite' deposits beneath the axis of the Iceland-Scotland Overflow Current are very poorly sorted muddy sands lacking primary sedi-mentary structures. Bioturbation is inferred to cause the unique charac-teristics of these deposits, as well as the absence of fine silt laminae in 'muddy contourites' at the current margin.
Thesis Supervisor: Dr. Charles D. Hollister Title: Senior Scientist
-3-ACKNOW LEDGENENTS
I thank Drs. Charles Hollister and David Johnson, who provided the
support and encouragement for this thesis study, and for many other
stim-ulating projects along the way. I appreciate also the efforts of L. Valentine Worthington, Peter Lonsdale and John Southard, who also
served on my thesis committee.
I am grateful for the support provided by the crew and scientific party during ATLANTIS II Cruise 94-1, especially to David Johnson (chief
scientist) and David Casiles (master) who helped make the expedition
a great success. The able technical assistance provided by Warren Witzell
and Alan Driscoll was appreciated greatly, as was the support of David
PorLer, who operated the CTD system, and Jery Graham, who was in charge
of current meter moorings. I thank all the personnel for their assistance.
Financial support for shipboard operations and most of the post-cruise
data analysis was provided by NSF Grant OCE76-81491 to Dr. Charles Hollis-ter. Sediment trap and hydrocast operations received partial support under ONR Contract N00014-14-C-0262.
Dr. A. H. Bouma of the U. S. Geological Survey generously provided
his box corer and supplies. Arrangements for rental and operation of the CTD system were made by R. Millard. Current meter rental was arranged
with the assistance of G. Anderson and S. Ferreira of the Marine Life Res-earch Group (Scripps Institution). Rental of the Lamont-Doherty
-4-nephelometer system was provided through the courtesy of L. G. Sullivan
and P. E. Biscaye.
I appreciate the assistance of numerous members of the Woods Hole
scientific staff and of my student colleagues for the many discussions and
critiques which helped me focus my ideas and understand the implications
of the results we obtained south of Iceland. I am particularly grateful
to Roger Flood, Wilf Gardner, and Mary Jo Richardson for their interest
and help with my work, and for their unselfish cooperation during our time as students together.
The assistance of Cynthia Brown-Stanton and Elaine Ellis in typing the manuscript is greatly appreciated, as is the acquisition of a Wang word processing system by WHOI.
And finally, I am most overwhelmingly grateful to Nancy and Caleb,
my wife and son, who suffered even more than I in the final stages of this
thesis. To both of you, please accept my promise that I shall never write
-5-TABLE OF CONTENTS Page ABSTRACT... 2 ACKNOWLEDGEMENTS... ... 3 LIST OF FIGURES... 7 LIST OF TABLES... 10 CHAPTER I: INTRODUCTION... 12
A. Statement of the Problem... 12
B. Previous Work: "Contourites"... 18
C. Objectives... 20
D. Iceland Basin: Regional Setting... 21
E. Description of Shipboard Program... 31
CHAPTER II: THE DEEP CIRCULATION OVER EAST KALTA RIDGE... 36
A. Direct Current Measurements... 36
B. Indirect Current Indicators... 44
C. Volume Transport... 48
D. Water Masses... 55
E. Bottom Mixed Layers and Near-Bottom Density Distribution... 57
F. Suspended Sediment Flux... 69
G. Summary of Deep Circulation... 76
CHAPTER III: SEDIMENT DISTRIBUTION PATTERNS... 78
A. Echo Character: Definition of Acoustic Units... 78
B. Geographic Distribution of Acoustic Units... 105
C. Surface Sediment Lithology... 110
D. Summary of Sediment Distribution... 120
CHAPTER IV: SEDIMENTATION PROCESSES -- OBSERVATIONS AND INTERPRETATION... 123
A. Bottom Bedforms: Photographic Evidence... 123
B. Stratigraphy: Recognition of Holocene Deposits... 131
C. Accumulation Rates of Holocene Sediments... 142
D. Primary Sedimentary Structures... 145
E. Bioturbation... 157
F. Sediment Size Analysis... 171
G. Contourites: Recognition and Characteristics... 184
H. Summary: 'Contourite' Characteristics in the Katla Ridge Region... 197
-6-CHAPTER V: SUMARY AND CONCLUSIONS...
A. Summary... B. Conclusions... REFERENCES... 205 APPENDIX I: APPENDIX II: APPENDIX III: APPENDIX IV: APPENDIX V: STATION LOCATIONS... FLOW CALCULATIONS... CARBONATE CONTENT OF PISTON CORES...
SAND CONTENT OF PISTON CORES...
PALEOMAGNETIC ORIENTATION OF CORES...
199 199 204 212 225 231 237 241
-7-LIST OF FIGURES
Figure Page
1.1 Bathymetry of Iceland Basin... 13
1.2 Bathymetry of Katla Ridge survey area... 15
1.3 Physiographic provinces of Katla Ridge region... 25
1.4 Airgun section across East and West Katla Ridges...29
2.1 Current meter and hydrographic stations... 318
2.2 Current velocity vectors from six current meters... 40
2.3 Progressive vectors from six current meters... 42
2.4 Potential temperature vs. salinity... 46
2.5 Geostrophic velocity profiles for station pairs... 49
2.6 Potential temperature, salinity and light scattering along northern CTD section... 51
2.7 Potential density: Myrdalsjokull Canyon... 58
2.8 Potential density: east flank, East Katla Ridge... .61
2.9 Potential density: southeast of West Katla Ridge... 64
2.10 Potential density distribution around Katla Ridges at 100 meters above bottom... 66
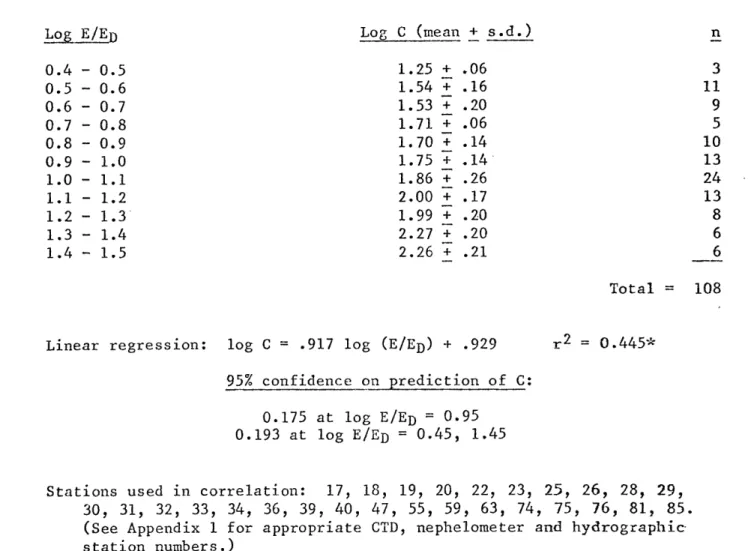
2.11 Correlation of suspended sediment concentration with light scattering for Katla Ridge stations... 72
3.1 Echo character map of Katla Ridge survey area... 79
3.2 Bathymetry of Katla Ridge survey area, showing track coverage of AII-94-1... 81
3.3 Examples of 3.5 k~iz echograms: transparent sediments... 83
-8-Figure 3.5 3.6 3.7 3.8 3.9 3.10 3.11 3.12 Examples of 3.5 kHz echograms: sediments... Examples of 3.5 kHz echograms: Examples of 3.5 kHz echograms: Examples of 3.5 kHz echograms: Examples of 3.5 kHz echograms: Examples of 3.5 kHz echograms: roughness and hyperbolae... Examples of 3.5 kHz echograms: Examples of 3.5 kHz echograms:
acoustically impenetrable
'multi-laminated' sediments...
asymmetric sediment waves.... symmetric sediment waves...
'dissected terrain'...
small-scale surface,
surface erosion... slumps, v-channels, and
scarps...
3.13 Echo character map of Katla Ridge survey area... 3.14 Carbonate content of piston core sediments...
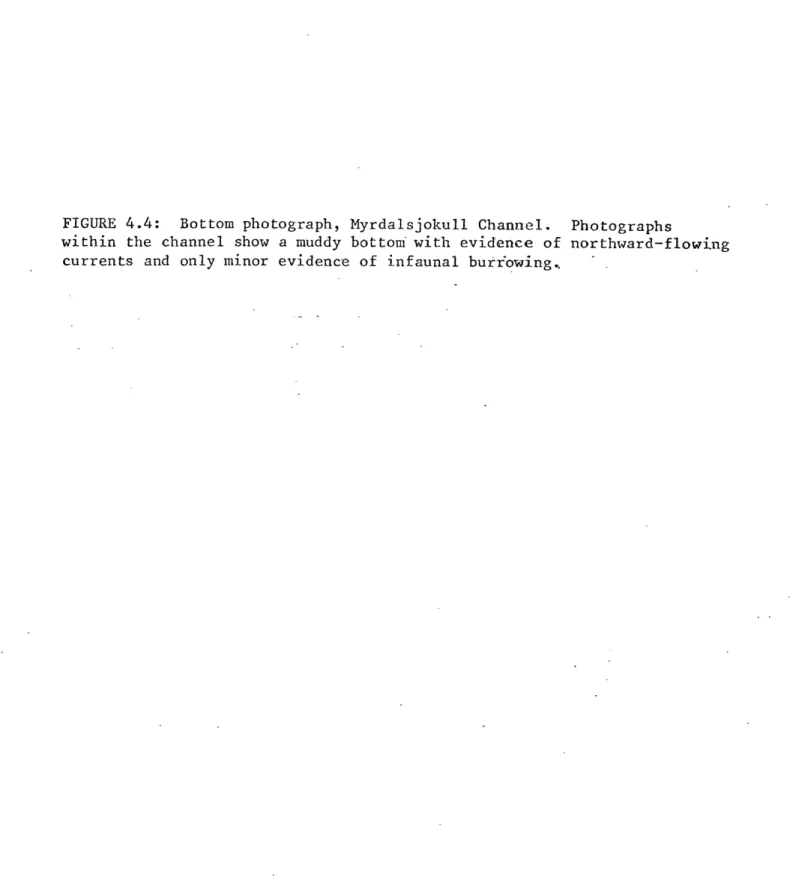
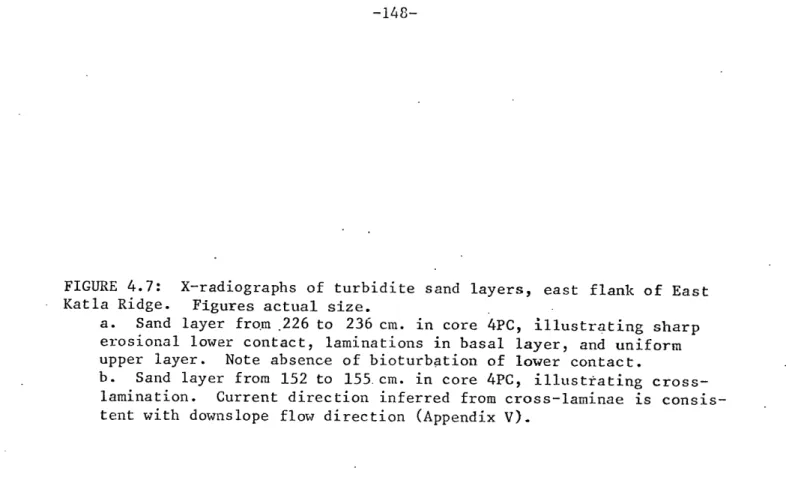
3.15 Sand-size component of piston core sediments... 4.1 Bottom photograph, East Katla Ridge crest... 4.2 Bottom photograph, East Katla Ridge current axis... 4.3 Bottom photograph, East Katla Ridge lower east flank... 4.4 Bottom photograph, Myrdalsjokull Channel... 4.5 Stratigraphy of cores 3PC, 4PC... 4.6 Globigerina pachyderma in cores 1PC, 4PC, 12PC... 4.7 X-radiographs of turbidite sand layers, east flank of
East Katla Ridge... 4.8 Photograph of face of core 1OBC (multi-laminated channel
sediments)... Page 87 89 91 93 95 97 99 101 106 112 114 124 126 129 132 135 137 148 151
-9-Figure Page
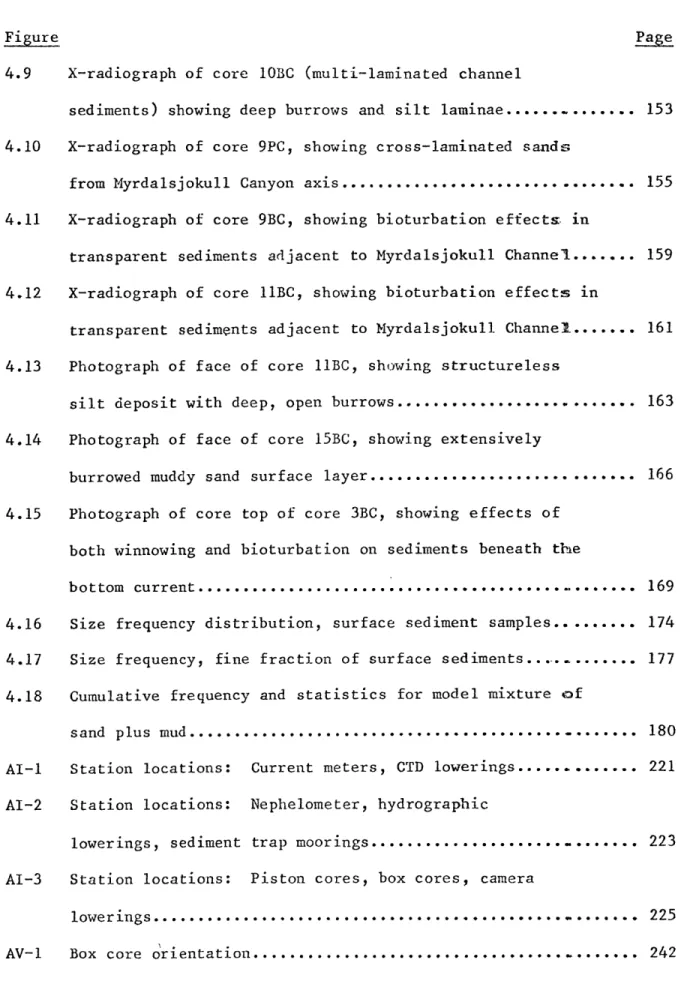
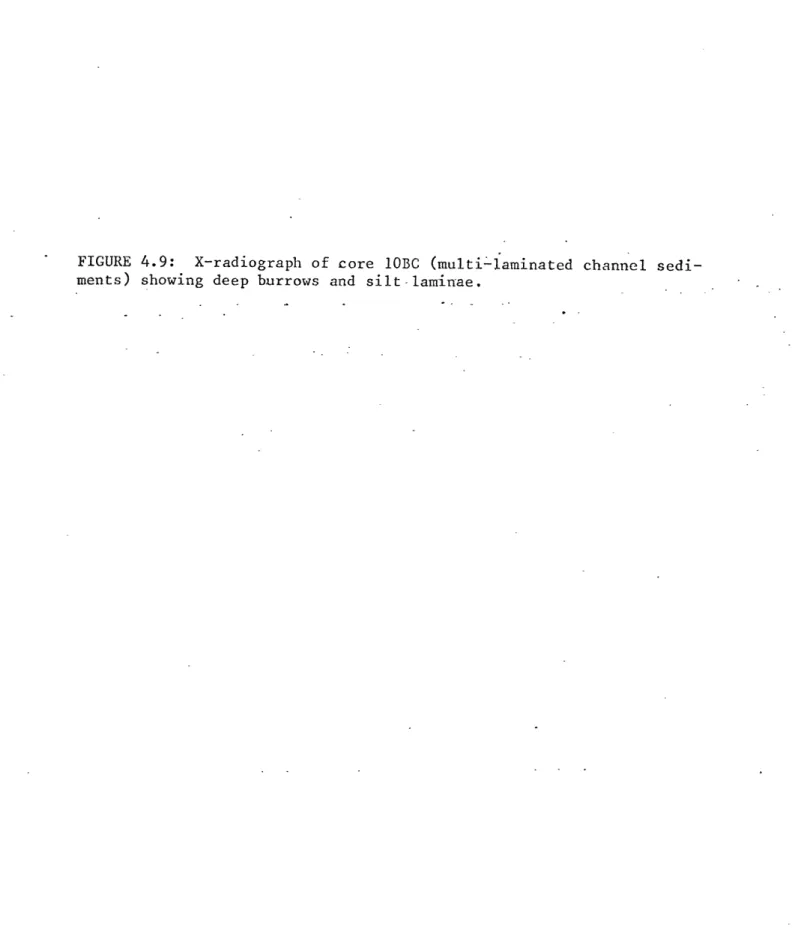
4.9 X-radiograph of core 1OBC (multi-laminated channel
sediments) showing deep burrows and silt laminae... 153
4.10 X-radiograph of core 9PC, showing cross-laminated sands
from Myrdalsjokull Canyon axis... 155 4.11 X-radiograph of core 9BC, showing bioturbation effects in
transparent sediments adjacent to Myrdalsjokull Channel... 159 4.12 X-radiograph of core 11BC, showing bioturbation effects in
transparent sediments adjacent to Myrdalsjokull Channel... 161 4.13 Photograph of face of core lBC, showing structureless
silt deposit with deep, open burrows... 163 4.14 Photograph of face of core 15BC, showing extensively
burrowed muddy sand surface layer... 166 4.15 Photograph of core top of core 3BC, showing effects of
both winnowing and bioturbation on sediments beneath the
bottom current... 169
4.16 Size frequency distribution, surface sediment samples... 174 4.17 Size frequency, fine fraction of surface sediments... 177 4.18 Cumulative frequency and statistics for model mixture of
sand plus mud... 180
AI-1 Station locations: Current meters, CTD lowerings... 221
AI-2 Station locations: Nephelometer, hydrographic
lowerings, sediment trap moorings... 223
AI-3 Station locations: Piston cores, box cores, camera
lowerings... 225
-10-LIST OF TABLES
Table Page
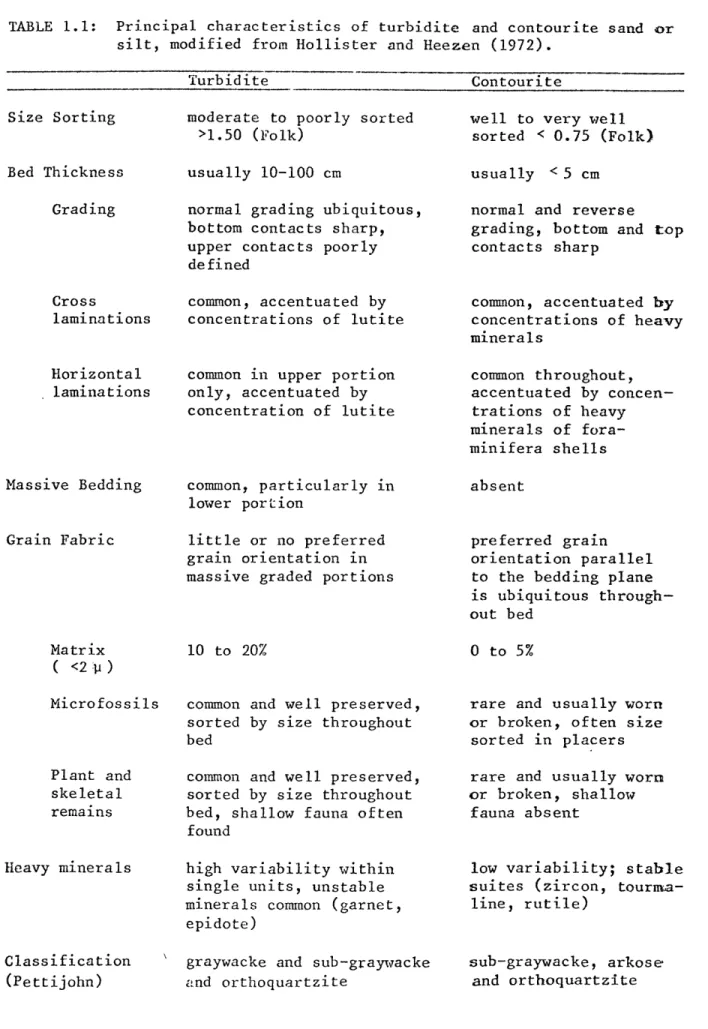
1.1 Principal characteristics of turbidite and contourite sand or
silt, modified from Hollister and Heezen (1972)... 19
2.1 Current meter data... 37
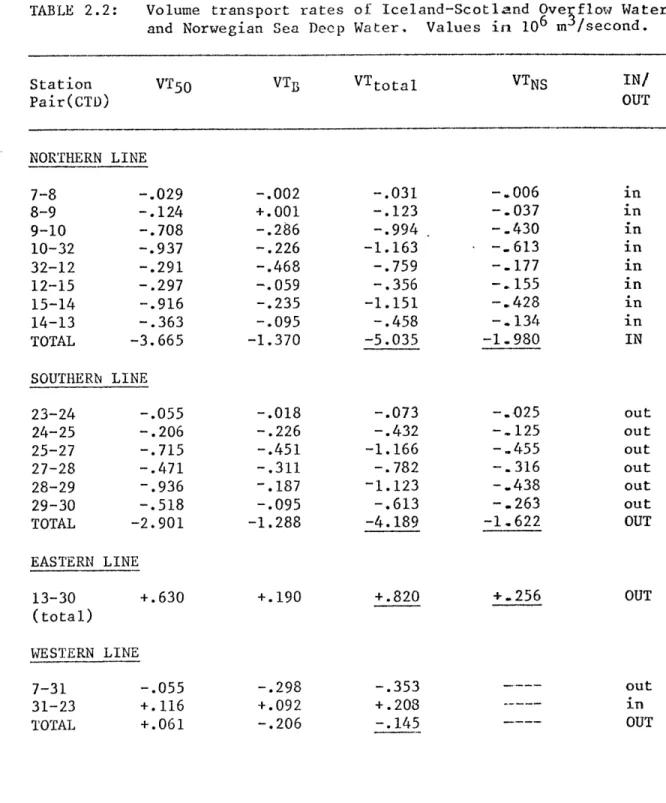
2.2 Volume transport rates of Norwegian Sea Overflow Water and Norwegian Sea Deep Water... 54
2.3 Suspended sediment concentration vs. light scattering... 71
2.4 Suspended sediment transport rates for Katla Ridge stations... 75
4.1 Radiocarbon dates, core 4PC...--.---... 141
4.2 Summary of grain size distribution in surface sediments... 173
4.3 Sandy contourites: sedimentary characteristics... 185
4.4 Muddy contourites: sedimentary characteristics... 194
AI-1 CTD stations...-... 213
AI-2 Nephelometer station;...**... 214
AI-3 Hydrocasts...-... 215
AI-4 Camera stations... . ... ... 216
AI-5 Current meters... ...--- .-. 217
AI-6 Sediment trap moorings... 218
AI-7 Piston cores... .. 219
AI-8 Box cores... 220
AlI-i Station information for flow calculations... 226
AII-2 Velocity calculations... .. 227
-11-Table Page
AIII-I Carbonate summary... 232
AIV-1 Coarse fraction... 238
AV-1 Summary of mean orientation of box cores... 244
-12-CHAPTER I: 1NTRODUCTION
A. Statement of the Problem
The initial goal of this research project was to test the hypothesis
"can bottom current deposits be distinguished from turbidity current
deposits based on primary sedimentary structures in Holocene sediments from the insular rise and slope southeast of Iceland?"
The Iceland margin was chosen as the study area because: (1) A
bottom current originating at the Iceland-Faroe Ridge is known to flow
through the region (Steele et al., 1962; Worthington and Volkmann, 1965) with velocities in the range 10-30 cm sec ~. Experimental work
sug-gests that such velocities are competent to resuspend and transport
fine-grained sediments (Southard et al., 1971; Lonsdale and Southard, 1974). (2) Volcanic activity in the Vestmann Island (Surtsey) on the Iceland
outer shelf and historical subglacial eruptions and resulting
sediment-laden floods on Iceland ("jokulhlaups") suggest that turbidity currents
have been active in post-glacial and probably historical times through one or both of two major submarine canyons incised into the Katla Ridges (Figures 1.1, 1.2).
The research problem was intended as a test of the contour current model of continental rise genesis proposed by Heezen et al. (1966) and
developed further by Hollister (1967), Hollister and Heezen (1972) and others from work on the continental rise of eastern North America.
-13-FIGURE 1.1: Bathymetry of Iceland Basin. Locations of the Katla Ridges and submarine canyons on the southern Iceland margin are indicated. Con-tours are in corrected meters. Bathymetry after Lonsdale (unpublished data) and NAVOCEANO World Relief Map NA 5.
-14-64.N- -64*N - - --- * AMERCATOR PROJECTiON 50 km CONTOURS IN METERS 59'N ".w 2*W 20 18*17" I*W
-15-FIGURE 1.2: Bathymetry of Katla Ridge survey area. Track lines indicate extent of echosounder coverage obtained during Atlantis II Cruise 94-1. Contours in regions of insufficient track coverage are based on NAVOCEANO World Relief Map NA 5. Contours in corrected meters.
17* 160 200 190 ISO 62*30' 620 61* 0' 610
-17-The basic assumptions involved in this model are:
1) The primary source of continental rise sediments is the con-tinental shelf and upper slope where land-derived terrigenous
muds are deposited;
2) Sediments are transported downslope by turbidity currents, with
the bulk of the coarse sediment bypassing the continental rise
towards ultimate deposition as turbidites in abyssal plains; and
3) A portion of the fine fraction of the turbidites is removed by bottom currents ("contour currents") flowing parallel to the
continental rise bathymetric contours. This material is
deposited from a turbulent nepheloid layer as a sediment wedge
(the continental rise) striking parallel to the contirnental
margin.
Studies on the North American rise have concentrated on
demonstrat-ing the presence of an otherwise poorly documented "contour current"
(Western Boundary Undercurrent) using bottom photographs and sediment
structures of continental rise sediments and contrasting these structures
with those in sediments from the adjacent abyssal plains. Provenance of
sediments in each sedimentary province has generally been deduced from
composition (clay mineralogy, heavy mineral assemblages, distinctive
color), or assumed. However, since this region has few unique -mineral
assemblages which may be unambiguously used for provenance determination,
this task has been only marginally successful.
The present investigation, by contrast, was undertaken in a region in
-18-defined (submarine canyons originating on the Icelandic shelf) and in
which a "steady" bottom current is known to be currently active (Steele
et al, 1962) and is inferred to have been so on independent evidence at
least since the retreat of pack ice from the Iceland-Faroe Ridge
follow-ing the last glacial maximum (Worthfollow-ington, 1970; Ruddiman and Glover,
1975; McIntyre et al., 1972; Kellogg, 1976; 1977). The purpose of this study is to delineate the characteristics of sediment deposits developed
under a known current field and with well defined sediment source charac-teristics.
B. Previous Work: "Contourites"
Analysis of cored continental rise sediments has led to the
classi-fication of a sediment type referred to as "contourite" which is
charac-teristic of the rise province, and which differs in certain respects from "turbidites" commonly recovered from abyssal plain environments. The
characteristic sedimentary structures and compositional differences between "contourite" and turbidite as defined by Hollister and Heezen
(1972), Field and Pilkey (1971) and Fritz and Pilkey (1975) for sediments
off eastern North America are found in Table 1.1.
Although distinct differences can often be discerned between these two types of deposits it should be stressed that transitional or
overlap-ping depositional structures are observed, and our understanding of the
depositional history of the continental rise has relied heavily on
sur-face morphology, acoustic stratigraphy and geologic inference.
Uncer-tainties in these inferences are largely due to a poor understanding of
the variability of the Western Boundary Undercurrent on a geologic time
-19-TABLE 1.1: Principal characteristics of turbidite and contourite sand or silt, modified from Hollister and Heezen (1972).
Turbidite Contourite Size Sorting Bed Thickness Grading Cross laminations Horizontal laminations
moderate to poorly sorted
>1.50 (Folk)
usually 10-100 cm
normal grading ubiquitous, bottom contacts sharp, upper contacts poorly
defined
common, accentuated by concentrations of lutite
common in upper portion only, accentuated by concentration of lutite
well to very well sorted < 0.75 (Folk)
usually <5 cm
normal and reverse
grading, bottom and top contacts sharp common, accentuated by concentrations of heavy minerals common throughout, accentuated by concen-trations of heavy minerals of fora-minifera shells Massive Bedding Grain Fabric Matrix ( <2:p ) Microfossils Plant and skeletal remains Heavy minerals Classification (Pettijohn) common, particularly in lower portion little or no preferred grain orientation in massive graded portions
10 to 20%
common and well preserved, sorted by size throughout bed
common and well preserved, sorted by size throughout bed, shallow fauna often found
high variability within single units, unstable minerals common (garnet, epidote)
graywacke and sub-graywacke and orthoquartzite
absent
preferred grain orientation parallel to the bedding plane is ubiquitous through-out bed
0 to 5%
rare and usually worn or broken, often size
sorted in placers rare and usually worn or broken, shallow
fauna absent
low variability; stable suites (zircon,
tournta-line, rutile)
sub-graywacke, arkose and orthoquartzite
-20-The work on the North American continental rise suffers from the
neglect of proximal turbidites and the large spatial separation of the
rise and abyssal plain cores on which "contourite" and turbidite
charac-teristics were determined. This may explain why investigations of con-tinental rise sediments and morphology in the vicinity of submarine
channels and fans (e.g. Stanley et al., 1971, Damuth and Kumar, 1975) have arrived at different conclusions regarding the relative importance
of downslope and along-slope transport of sediments in continental rise genesis. No detailed work has previously been carried out with the goal
of correlating sediment texture with sedimentary prcvinces defined by
bottom current measurements and surface echo sounding in a region with a volumetrically important local source of terrigenous sediment.
C. Objectives
The goal of this study is to describe the geologic effects of a
bottom current on the sea bed in a region of strong, unidirectional
flow. This study concentrates on the past 13,000 years (which is the
approximate termination of the last glacial period at this site) in order
to avoid the problem of changes in deep circulation and sediment input
from Iceland which have been predicted to occur across this climatic
boundary (e.g. Weyl, 1968; Kellogg, 1976; 1977; Ruddiman and Bowles,
1978; and others).
Specific goals of this research are:
1. To define the modern flow of Iceland-Scotland Overflow Water (ISOW) through the Katla Ridge region;
-21-2. To describe the regional distribution of Holocene sediments in
the region and observe whether deposition and erosion may be
uniquely related to bottom current flow; and
3. To characterize the sedimentary deposits lying beneath the cur-rent in hopes of using these criteria for subsequent
identifica-tion of current deposits where flow condiidentifica-tions are not directly observed.
D. Iceland Basin: Regional Setting
Iceland Basin is bordered on the north by the Iceland-Faroe Ridge, on the east by Rockall Plateau and on the west by Iceland and Reykjanes
Ridge (Figure 1.1). It opens to the south into the European Basin
with-out a geographical barrier. The deepest part of the basin is Maury
Channel, which lies east of the center and immediately west of Hatton
Drift, a sediment pile on the southwest flank of Rockall Plateau. The
Iceland Basin plunges to the south, with a maximum depth at the southern end of Rockall Plateau of about 3000 meters. The Iceland-Faroe Ridge has
several sills between 500 and 600 meters deep connecting Iceland Basin
with the Norwegian Sea. Reykjanes Ridge plunges southward from above sea
level on Iceland to approximately 1000 meters at 560N; Rockall Plateau
likewise rises above 1000 meters north of 56
0N.
Two elongate, north-south striking sediment drifts are developed in
Iceland Basin (Johnson and Schneider, 1969; Jones et al., 1970; Davies and Laughton, 1972). Gardar Drift is continuous from the southern slope
of Iceland (approximately 62 30'N) to at least 540
N, where it
-22-with Charlie--Gibbs Fracture Zone. The strike of Gardar Drift is
approxi-mately 2100, nearly parallel to Reykjanes Ridge over its entire
length. Several smaller, subparallel drifts are developed between Gardar
Drift and Reykjanes Ridge south of 600N.
Hatton Drift extends along the western flank of Rockall Plateau from
its southern limit to somewhat north of 61
0N.
It appears to wraparound the southern edge of the plateau and connect with Feni Drift in
Rockall Trough. The northern extension is poorly defined, probably due
to the gradual shallowing of the basin.
Hydrographic studies (Fuglister, 1960; Steele et al., 1962;
Worthington and Volkmann, 1965; Worthington and Wright, 1970; Hollister et al., 1976) reveal a well-developed deep thermohaline current flowing
southward along the eastern flank of Reykjanes Ridge from its origin in the Norwegian Sea (Worthington, 1970) to Charlie-Gibbs Fracture Zone near
53 N (Worthington and Volkmann, 1965; Garner, 1972; Shor et al., 1980
(in press). The flow originates through several channels and sills across the Iceland-Faroe and Scotland-Faroe Ridges, and is driven by downslope flow of high density Norwegian Sea Deep Water brought to shallow depths by convective winter overturning (Worthington, 1970). This dense water mixes with warmer, more saline water as it flows
down-slope (Worthington and Volkmann, 1965; Steele et al., 1962).
At least some of the overflow may be episodic over short periods
(weeks to years) (Lee and Ellett, 1965; Ellett and Roberts, 1973; Crease,
1965), although the Faroe Bank Channel appears to maintain a steady flow
-23-transport calculated by Worthington and Volkmann (1965) along the length 6 3 -1
of the flow (from 2.0 to 7.6 x 10 in sec ), although problems
associated with choice of an appropriate reference level may explain some of the uncertainty (Ivers, 1975). Velocities measured within the
over-flow current along the western margin of the Iceland Basin (Steele et
al., 1962; Worthington and Volkmann, 1965) are typically in the range
10-30 cm sec 1.
Gardar and Hatton Drifts are presumed to originate from sediment
transported along the margins of the basin by bottom currents of
Iceland-Scotland Overflow Water (Jones et al, 1973; Johnson and Schneider; 1969,
Ruddiman, 1972). The morphology of the drifts ranges from smooth, convex
piles to irregular deposits with mudwaves and scour, and from sharply
peaked to nearly flat. Similar features have been described in the
Argentine Basin (Ewing et al., 1971); the western North Atlantic (Johnson
and Schneider, 1969; Ewing and Hollister, 1972; Flood, 1978) and in Rockall Trough (Johnson and Schneider, 1969; Jones et al., 1973; Flood,
1978) in regions swept by deep thermohaline currents.
A major study of sedimentation processes on the east flank of
Reykjanes Ridge by Ruddiman (1972) concluded that sediment deposition
between 53 and 600N along the ridge has been almost entirely a
result of bottom current flow, with major accumulations in fracture zones
and along the current margin (Gardar Drift). He inferred that current
activity has been important in controlling sedimentation since at least
17 my BP based on the age of the youngest crust beneath the deposits interpreted as current-deposited in seismic reflection profiles.
-24-Katla Ridges
The Katla Ridges (Malmberg, 1974) are a pair of thick sedi.ment
deposits located on the insular rise south of Iceland (Figure 1.2). They
cover an area of approximately 20,000 km , and they strike about 2100 from the insular slope. They may be distinguished morphologically
between water depths of approximately 1000 and 2300 meters. The two ridges are separated by Myrdalsjokull Canyon (Egloff & Johnson, 1979;
Johnson and Palmasson, In prep.), a deep narrow turbidity-current pathway originating on the Iceland shelf. A second major canyon (Reynidsjup
Canyon) bounds West Katla Ridge to the west. It also originates on the Iceland shelf in the vicinity of the Vestmann Islands (Hollister and
Lonsdale, 1977).
Previous works by Malmberg (1974), Egloff and Johnson (1979) and
Johnson and Palmasson (In prep.) have designated the names 'Katla Ridges'
(East and West) to the two sediment drifts, and the names Myrdalsjokull
and Reynidsjup Canyons to the two canyons which bound them (Figure 1.3).
Two additional features outside the immediate study area (Gardar Ridge,
discussed at length by Johnson et al, 1970 and Ruddiman, 1972), and Maury
Channel (Cherkis, et al, 1973) are major morphologic features of Iceland
Basin which are inferred to be related to the ridge/channel morphology of
the Iceland Rise.
For the purpose of this study several additional morphologic
fea-tures in the vicinity of East Katla Ridge are assigned generic names.
These include (as illustrated in Figure 1.3): Myrdalsjokull Suprafan, Myrdalsjokull Canyon Levee, Myrdalsjokull Channel, and South Katla
-25-FIGURE 1.3: Physiographic provinces of Katla Ridge region. See text for discussion.
62030'
620
61*30'
-27-Basin. The following criteria have been used for the identification of
the geomorphic units named above:
1) Myrdalsjokull Suprafan extends from the mouth of Myrdalsjokull Canyon
at approximately 2120 meters axial depth towards the east out of our
sur-vey area. It is bounded on the south by Myrdalsjokull Canyon Levee, and
has been the site of deposition of turbidites for an indeterminate
period. Over 0.25 sec ( >250 meters) of deposition has occurred in the
former erosional extension of Myrdalsjokull Canyon at 180 25'W (Figure 5 in Johnson and Shor, 1977).
2) Myrdalsjokull Canyon Levee: This SE-trending spur of West Katla
Ridge is a barrier to southward flow of turbidity currents. The south-west flank is mantled with asymmetric sediment waves.
3) Myrdalsjokull Channel is a depositional feature approximately one
kilometer wide extending from the mouth of Myrdalsjokull Canyon
(61058'N, 18 48'W) towards the southeast (trend 140 0). It is
recognized as both a local depression in bathymetry and as the site of
deposition of a unique acoustically-defined sediment type
('multi-laminated'). The channel undergoes a major change in trend (to 0900) and acoustic character at 18020'W where the topographic expression of
the channel continues eastward. The acoustically 'multi-laminated' sedi-ment fill characteristic of the western end of the channel terminates,
apparently due to the ability of turbidity currents to breach the
Myrdalsjokull Canyon Levee and flow to the south.
4) South Katla Basin is a cul-de-sac basin bounded on the north by West
-28-meander at the mouth of Reynidsjup Canyon (Lonsdale and Hollister, 1979, in press) and on the south by a levee extending eastwards from Reynidsjup
Canyon. South Katla Basin is open at its eastern end, and merges with
the central portion of Iceland Basin and the Maury Channel/Fan complex.
The Katla Ridges are smooth features with accumulation of sediment
beneath the crests in excess of 1.5 kilometers (Figure 1.3). Their mode
of formation is inferred to result from the rapid denudation of Iceland
during the Neogene, sediment transport to the base of the slope by
tur-bidity currents and subsequent entrainment and transport southwestward by
the flow of Iceland-Scotland Overflow Water. The development of the
ridges has very likely not been a continuous process, however, and major
fluctuations in both turbidity current (input) and bottom current
activity (redistribution) since the Early-Middle Miocene are likely (e.g. Shor & Poore, 1978).
Development of the Katla Ridges as levees built by Plio/Pleistocene
turbidity currents, as suggested by Johnson and Palmason (in prep.), does
not appear reasonable. Our profile (Figure 1.4) across both East and West Katla Ridges shows that the convex ridge morphology is evident in
deep reflectors to approximately 0.75 sec subbottom (>0.75 ki), which would imply accumulations rates since 3 myBP (during ridge growth) of
>250 meters per million years (25 cm/1000 yr) if the sea level fluctua-tions of the glacial Pliocene and Pleistocene are solely responsible for
the turbidity currents inferred to be responsible for the development of
the canyon/ridge morphology. It seems more plausible that the ridge and
-29-FIGURE 1.4: Airgun section across East and West Katla Ridges (Profile P-P' of Johnson and Shor, 1977). This reflection profile was obtained during AII-94-1 with a 40 cubic inch airgun, and crosses the ridge crests at approximately 62030' N. Arrows beneath each ridge indicate
(start-ing with the deepest): 1) acoustic basement, 2) the shallowest
flat-lying reflector, which is inferred to predate ridge formation, and 3) the highly reflective group of reflectors within the convex ridge sequence, which is tentatively inferred to be a Pliocene unconformity (see text).
WEST
~m
0 0 0 I 080 I 0700I I I I II
100
1000
0900
0800
0700
0600
0500
04.00
0300
P'1
1500-
2250-3000
2.0
2.5
3.0
3.5
4.0
4.5
E AST
-31-Middle Miocene, a time when evidence from both tectonic studies (Vogt
1972) and sedimentary studies (Ruddiman, 1972; Shor and Poore, 1978) indicate that a major reorganization of sea floor spreading and bottom
circulation occurred in the North Atlantic. A set of strong reflections
at approximately 0.3 sec subbottom may be an unconformity related to the
changing sea level on Iceland and the resultant increase in turbidity
current flow (Figure 1.4). This feature is well above the deepest ridge
reflections, however.
The Katla Ridges are located on crust whose presumed age ranges from
ca. 35 to 50 myBP based on extrapolation of magnetic lineations from the
south (e.g. Vogt & Avery, 1974). Magnetic anomaly 18 is observed in both AII-94 data and LDGO data (Talwani et al, 1974) beneath the east flank of East Katla Ridge (Schouten, personal communication).
Basement depths throughout the northern North Atlantic (north of
53 N) are shallow relative to the worldwide averages for crust of equi-valent age (Luyendyk et al, 1978; Parsons & Sclater, 1977; and others).
However, subsidence rates are not observed to be different. Instead, the entire Reykjanes Ridge appears to be shallow, and to have been so at
least since 36 myBP. The crest dips from above sea level on Iceland to
normal (approximately 2000 meters) depth at the Charlie-Gibbs Fracture
Zone near 53 N. Thus the shallow depth of our study area is a regional
tectonic feature, and not a local anomaly.
E. Description of Shipboard Program
During June and July of 1977, the author spent 15 days in the Katla
-32-Shor, 1977) to study the influence of abyssal currents on accumulation
patterns of Holocene sediments on the Katla Ridges and to investigate the
impact of turbidity currents as both direct and indirect sources of
sedi-ment on and around the fan seaward of Myrdalsjokull Canyon. Operations
on this cruise are summarized below:
Navigation
A combination of satellite and LORAN C navigation was used. Fixes
with LORAN C were taken (automatically) every 10 minutes, and were
sup-plemented with fixes recorded manually. Satellite data was routinely
recorded by the mate on watch. Both systems worked well, and the only
problems were caused by weather interference with the LORAN. Most of
these fixes proved to be correctable, however. Navigation in all
por-tions of the survey area may be considered to have a precision of
approx-imately + 0.1 n.m. Station Data
1. CTD profiles. Twenty-six CTD profiles were obtained in the
Ice-land Basin region using the Neil BrownR CTD system modified by R.
Millard and L. Armi at Woods Hole. Twenty-two of these profiles provided
usable pressure, temperature and salinity data from the surface to near-bottom. Three stations (CTD #16, 17, 18) provided only temperature data
due to failure of the conductivity cell, while one station (CTD #20) did
not profile the entire water column, but was a test station using a
second instrument at the site of CTD #19.
CTD data was reduced on shore under the direction of Robert Millard of WHOI. Problems with data acquisition were resolved for the 22 good
-33-stations and data quality is comparable to that expected for this Neil
Brown R instrument (accuracy of t + .001 C, S + .003 /oo, P + '0.1 dbar; precision of S + .001 /oo for each cast). Salinities were cali-brated against samples obtained at each station with Niskin and Nansen
bottles to correct for drift in the conductivity sensor.
Ten good CTD lowerings were made on the northern section o~f stations
at nine locations extending from the ridge crest at approximat-ely 1180
meters to the center of the basin at approximately 2320 meters. CTD
#"32
was a reoccupation of CTD #11.. Seven stations were occupied om a tran-sect extending SE from the crest of West Katla Ridge, four lowerings weremade in Myrdalsjokull Canyon and Channel, and one lowering was in the
current axis on the southern flank of W. Katla Ridge (all station
loca-tions are tabulated and figured in Appendix I).
2. Nephelometer profiles. A total of 27 nephelometer profiles were
obtained in the Iceland Basin region using the system develope.d at
Lamont-Doherty Geological Observatory by Thorndike (1975). In general
the locations of the nephelometer stations correspond with the CTD
lower-ings, with the nephelometer attached to the wire 10 meters above the CTD
(Appendix I).
3. Hydrocasts. Twenty-four hydrographic' stations were occupied,
each of which consisted of between five and fifteen water samples (using
5-liter bottles and 30-liter bottles) (Appendix I). Water sanples were
filtered through 0.6 micron NucleporeR filters for analysis of the con-centration and composition of suspended particulates and the underlying surface sediments. The measurements of total concentration of suspended
-34-particulates were used to calibrate the nephelometer profiles.
Tempera-ture and salinity from hydrocasts were used to calibrate the salinity
data acquired on adjacent CTD lowerings. Details of suspended sediment studies will be reported by M. J. Richardson (Ph.D. dissertation in
pro-gress; WHOI/MIT Joint Program in Oceanography).
4. Bottom current measurement. Three current meters, of the type developed by the Scripps Institution of Oceanography Marine Life Research Group (Schick et al, 1968) were deployed at a total of six locations on
the east flank of the East Katla Ridge to measure the speed and direction
of the thermohaline current flowing along the ridge. Each instrument was
positioned 10 meters above the sea floor, and recorded currents over a
period of approximately one week. The location of the transect of
cur-rent meters corresponds with the western end of the northern transect of CTD stations (Appendix I).
5. Coring. Twelve standard piston cores and fourteen box cores were obtained in the Katla Ridge area (Appendix I). The box core used is that described by Bouma (1969, p. 339-342). Generally the box corer
functioned well, although poor penetration resulted in poor or no
recovery at 4 stations (#2, 5, 13, 14 BC). The locking compass used for
core orientation was lost during a test station, and was not used during the cruise. Paleomagnetic declination was used for azimuthal orientation
of the cores. All piston cores were rigged with 40 feet (13 meters) of
core barrel, and generally penetrated completely with only a minor amount of flow-in. Piston core 7 PC did not trip properly, and recovered only
-35-6. Bottom photography. Nine camera stations in the Katla Ridge area
yielded one or more useable exposures, and a total of 42 useable
exposures were obtained in the region. The camera used (Benthos Model 371 Utility Camera System) was extensively tested in shallow water and consistently performed in a satisfactory manner, but failed repeatedly
during the Iceland Basin work, despite'extensive efforts by electronics
technicians to remedy the problems. Camera station locations and number of usable exposures at each are listed in Appendix 1.
7. Sediment trap mooring.s. In order to estimate the vertical flux
of suspended particulates, three moorings of sediment traps were deployed
in the Katla Ridge region: two along the East Katla Ridge transect, and
one near the turbidity current channel (Appendix I). This data is part of a study of sedimentation processes by M. J. Richardson and will be
discussed in her Ph.D. dissertation.
Underway data
Routine collection of 3.5 kHz echosounder profiles was carried out throughout the cruise, weather permitting. During periods when storms
prevented use of the 3.5 kHz system, the 12 kHz backup system was used.
Overall quality of records was good, although some record sections are
noisy due to poor weather conditions.
Airgun (40 cubic inch) and magnetometer data was gathered on a
num-ber of profiles within the survey area. The airgun data is summarized
-36-CHAPTER II: THE DEEP CIRCULATION OVER EAST KATLA RIDGE
Circulation of Iceland-Scotland Overflow Water (ISOW) around and over
East Katla Ridge is inferred from a series of current meters, hydrographic sections, and bottom photographs.
A. Direct Current Measurements
Direct current measurements were made 10 meters above bottom at six
locations on the east flank of East Katla Ridge (Figure 2.1). This
sec-tion was composed of three current meters moored for one week followed by
redeployment of the same meters at alternating depths down the flank for
one additional week. These current meters show a velocity core (a flow
greater than 20 centimeters per second) flowing somewhat upslope of the
contours (up to 450) flanked on either side by reduced velocities.
This indicates that our section encompassed most or all of the main flow
of the ISOW through the East Katla Ridge region.
Velocity information measured at current meter deployments on the
east flank of East Katla Ridge is summarized in Table 2.1 and Figures 2.2 and 2.3. Current meters moored in 1400, 1600 and 1800 meters water depth
all recorded steady, unidirectional flow towards the west to southwest
(CM 6, 2, 5 respectively). Vector mean velocities exceeded 18 cm sec~1 over the recording period (5.5 to 6.75 days). Maximum speeds observed
during 15-minute digitizing intervals were 29 cm sec~ . Flow was directed upslope from the contours by 30 to 454.
The shallowest current meter (CM 3, 1177 meters) on the ridge crest
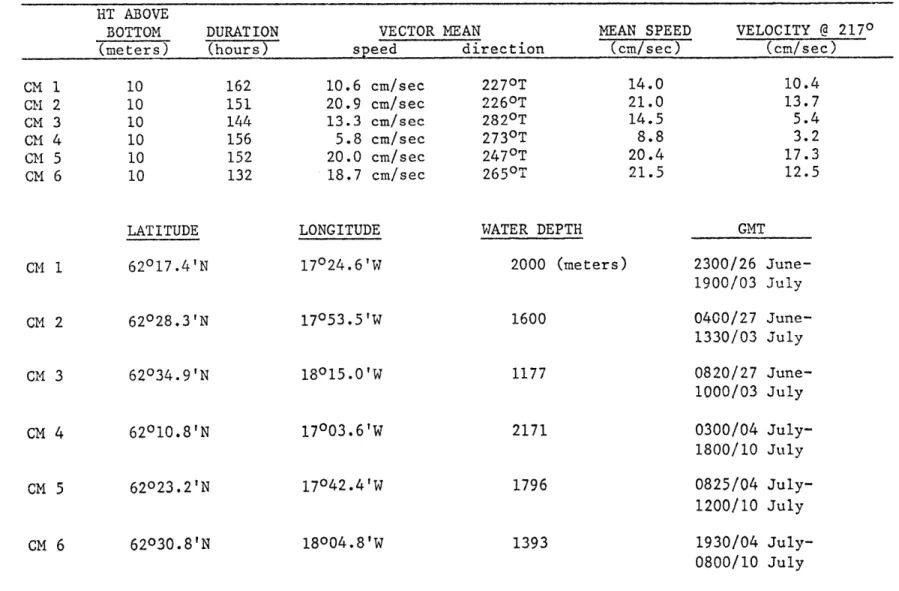
TABLE 2.1: Current meter data. HT ABOVE
BOTTOM DURATION VECTOR MEAN MEAN SPEED VELOCITY @ 2170
(meters) (hours) speed direction (cm/sec) (cm/sec)
162 151 144 156 152 132 10.6 cm/sec 20.9 cm/sec 13.3 cm/sec 5.8 cm/sec 20.0 cm/sec 18.7 cm/sec 2270T 2260T 2820T 2730T 2470T 2650T 14.0 21.0 14.5 8.8 20.4 21.5 10.4 13.7 5.4 3.2 17.3 12.5 LATITUDE 62017.4'N 62028.3'N 62034.9'N 62010.8'N 62023.2'N 62030.8'N LONGITUDE 17024.6'W 17053.5'W 18015.0'W 17003.6'W 17042.4'W 18004.8'W WATER DEPTH 2000 (meters) 1600 1177 2171 1796 1393 GMT 2300/26 June-1900/03 July 0400/27 June-1330/03 July 0820/27 June-1000/03 July 0300/04 July-1800/10 July 0825/04 July-1200/10 July 1930/04 July-0800/10 July CM 1 CM 2 CM 3 CM 4 CM 5 CM 6 CM 1 CM 2 CM 3 CM 4 CM 5 CM 6
-38-FIGURE 2.1: Current meter and hydrographic stations. Locations of all CTD stations occupied during AII-94-1 plus 6 current meter moorings are indicated. Mean vector velocity for period of current meter deployments are indicated. Solid line encloses the 17-station array which is used for volume transport and suspended sediment flux calculations. Figure from Shor, 1978.
-39-190 w 180 70 i6*
0
CURRENT METERS
A CTD PROFILES
CURRENT VELOCITY
(cm /sec> 25 20 15 10 5 62*
61 N
-40--FIGURE 2.2: Current velocity vectors from six current meters. Current meter locations are indicated in Figure 5. Velocity vectors are plotted against date(GMT), and 30-minute averages are plotted every hotur. Tidal components have not been removed. Compass orientation is as iindicated; vertical vectors are perpendicular to the CTD station line strike
(1270) for comparison with velocity estimated by geostrophic calcula-tions. Note uniformity of current direction and speed at the three meters located within the axis of the ISOC flow (CM 6, 2, 5).
~LL-IIA-01
69 (i.Ofl WO) Q33dS G z IIlk1 W0091 'LU LL1j c no~ IA-LZ // I 11A111011MINNA AIIA fi//izz //
1111111., P
ap
J&lzl,
--00oz
No
-42-FIGURE 2.3: Progressive vectors from six current meters. Velocity data as in Table 2.1 and Figure 2.2 plotted as progressive vectors every 30 minutes. Flow at the shallowest meter is -uniform in direction, although
speed varies considerably; the two deepest meters show considerable fluctuation in both speed and direction. The three meters in the flow axis show remarkably little fluctuation in direction or speed throughout the deployments.
E
Qr()
co~
*c'J 0010b 00o0E
0~J
E
Qq-( 00/29 00!' CE
L)
Ojro
-44-(2820). Periodic stalls and occasional current reversals reduced the vector mean velocity to only 13 cm sec~ , and suggest that 1200 meters
is near the minimum depth of cross-ridge flow of the bottom current.
The current meter at 2000 meters (CM 1) recorded a period of
approx-imately 2 days of low velocities and stalls which was both preceded and
followed by strong
(
>20 cm/sec) flow. The current meter record shows eastward flow preceding the stall, and. we infer that water from thecur-rent axis (upslope) moved into the position of the station and stalled.
The deepest current meter (CM 4; 2171 meters) shows low westerly flow
= 5.8 cm sec
1)
for the duration of the record, and is assumed to lie outside of the main body of the bottom current.Velocity components along the azimuth 2170 are listed in Table 2.1; the vector stick diagram (Figure 2.2) is also plotted relative to
2170. This is the azimuth normal to the mean line of CTD seations 7 to
15 to which geostrophic velocities are compared.
B. Indirect Current Indicators
Various methods were used to determine flow direction and estimate
velocity in other portions of the survey regions. Bottom photographs
obtained on the east flank of East Katla Ridge show good agreement
between directions inferred from surface sculpturing and current meter
measurements Similarily, bottom photographs from the saddle of West
Katla Ridge indicate westward flow. Photographs from the Myrdalsjokull
Canyon axis and two additional sites within the channel extending
east-ward from the canyon show evidence of northeast-ward flow (into the canyon).
-45-expect that the presence of ripples and scouring pointing northwards
indicates strong tidal flow within the canyon region.
Hydrographic stations were used to extend the measured velocity
sec-tion from the East Katla Ridge. Seventeen lowerings with a Neil Brown
CTDR instrument were made in two sections. The northern section coin-cides with the current meter locations, and extends an additional 80
kilometers eastward to the basin center. The second line was located off
the southeast flank of West Katla Ridge, extending a comparable distance
towards the southeast (Figure 2.1). Velocities were calculated based on
the geostrophic assumption, according to the formula
V = 100 g (.AD) cm sec~I
2 0 ( Ax) sin
0
Where g = gravitational acceleration (983 cm sec- 2);
0= angular velocity of the earth (0.729 x 10- 4 sec-l);
0
= site latitudeAD= dynamic height difference (units of meters) between stations relative to the reference level (where AD =
0); and
Ax= station separation (meters).
A reference level was chosen based on both measured velocities along the northern line and on previous work (Steele, Barrett and Worthington, 1962). We used a level corresponding to the density interface sigma-t
equals 27.75 for a 'level of no motion'. This level produces good
agree-ment between calculated and measured velocities, and allows us to
extrap-olate our results to regions where direct measurements are absent. This
reference surface corresponds to a major break in the
temperature-salinity curve (Figure 2.4), and is comparable to the level used by Steele et al (1962) based on 'salinity anomaly'.
-46-FIGURE 2.4: Potential temperature vs. salinity. All CTD stations occupied during AII-94-1 within the Katla Ridge survey area are
included. Water masses are abbreviated as in the text. Percentages of Norwegian Sea Deep Water (NS) are indicated on the left margin, after the method of Hermann (1967). Heavy line indicates the approximate position of the reference surface used in velocity and volume transport calcula-tions. Salinity is horizontal axis; potential temperature is vertical.
01*gQ
00*92
-1.-SN
00
01
ot,
09-0
L-06'tp9
-48-General features of the calculated velocity profiles are observed in
Figure 2.5. They are as follows:
1. A tendency toward increasing southwest velocities towards the
bottom is observed at all stations pairs except the northernmost two pairs on the east flank;
2. Maximum velocities near the bottom are observed between 1600 and 1800 meters on the east flank of East Katla Ridge, and between 1800 and
2100 meters on the east flank of West Katla Ridge;
3. The velocity maximum coincides with a local minimum in potential
temperature (which is also the maximum in potential density) (Figure 2.6);
4. The apparent decrease in near-bottom velocity near the top of East Katla Ridge may perhaps be explained as being due to flow shifting
towards the west and northwest, nearly parallel to our section, as observed at current meters at 1177, 1393 and 1600 meters.
C. Volume transport. Seventeen CTD stations were included in a closed array encompassing the flow of ISOW along East Katla Ridge for volume
transport calculations (Figure 2.1). A reference level at = 27.75 was
used as a level of no motion.
Volume transport was computed every 50 meters below the reference level for each consecutive station pair by the standard equation for
geo-strophic flow:
VT5 0 = 50 g ( AD) m3 sec-1 2 Q sin 0
where VT50 is the flow through a 50-meter thick layer between adjacent stations. The symbols and reference level are as defined previously for
-49-FIGURE 2.5: Geostrophic velocity profiles for station pairs along the two lines of CTD stations indicated in Figure 2.1. Velocities are cal-culated as discussed in the text, using a reference 'level of no motion" at sigma-t equals 27.75.
NORTHERN LINE
CTD 9-10 -q0 -10 0 10 20 CTD 10-32 - 2,0 -10 0 10SOUTHERN LINE
CTO 25-27 -20 -10 0 CTD 27-28-20 -10 0 CTD 7-8 -1,0 0 10 CTD 8-9 -10 0 10 20 CTD 32-12 -to1 0 10 20 CTD 12-15 -10 0 10 CTD 15-14 -20 -10 CTD 14-13 -10 0 10 0 500 1000 1500 2000 2500 CTD 23-24 -1,0 0 10 CTD 24-25 -10 0 10 20 -10 CTD 28-290 1.0 2,0 CTD 29-30 -10 0 10 500 1000 -1500 2000 2500
-51--FIGURE 2.6: Potential temperature, salinity and light scattering along northern CTD section. Note core of cold water in vicinity of 1800 meters water depth, where potential temperature is less than 20 C. Salinity within the current is higher than at comparable depths in the basin to
the east. Light scattering (log E/ED) is uniformly higher throughout the water column within 50 kilometers of the ridge crest than to the east. This station is based on data from CTD stations 7 to 15 and the associated nephelometer lowerings.
(*%) AllNI'VS 02* 0
SdJIJ#07/%
0
00
0 00.
0PA
SI -0*m
0"I- 90 EM 90-9'0 E 9'0>C3
Sd73M O/VP
38nm~dio3 -....~i
, 0,9 9 0.8o3
3
~/
9
8O/~
0A
03-901
01
O-r I I 96**001
-53-velocity. Volume transport below the reference level for each station
pair ( EVT5 0) is listed in Table 2.2.
Because the stations are located on a sloping bottom, a considerable
volume of water is missed by the above calculation, and must be estimated
in a slightly different manner. Dynamic heights at the deepest
measure-ment of the shallower CTD lowering are used to calculate flow velocity at
that level. The calculated velocity is then multiplied by the area below
the deepest incremental calculated volume transport 'to give the "bottom
flow volume" (VT B) for each station pair (Taple 2.2)..
Once the volume transport has been calculated for each station pair,
the total transport of the deep current may be estirmated by summing all
station pairs on each section across the current. In addition, we may test our choice of a reference level by determining whether mass is
con-served through the array.
Volume transport for the northern and southern lines of stations 6 3
(below the reference level) are 5.02 and 4.19 x 10 6m /sec respec-tively (Table 2.2). The lower value for the southern line apparently
indicates that our stations did not extend far enough to the east to
encompass the total flow. This is supported by the calculated transport
of 0.82 x 10⁶ m3 /sec (east) between the easternmost stations on the northern and southern lines (stations 13 and 30). Flow across the
6 3
western line is small (0.15 x 10 m /sec) and poorly determined due
to the geometry of Myrdalsjokull Canyon, which separ.ates the East and
West Katla Ridges. Only a minor portion of the flow is likely to be able
-54-TABLE 2.2: Volume transport rates of Iceland-Scotland Overflow Water and Norwegian Sea Deep Water. Values in 106 m /second.
Station VT5 0 VTB VTtotal VTNS IN/
Pair(CTD) OUT NORTHERN LINE 7-8 8-9 9-10 10-32 32-12 12-15 15-14 14-13 TOTAL -. 029 -. 124 -. 708 -. 937 -. 291 -. 297 -. 916 -. 363 -3.665 -. 002 +.001 -. 286 -. 226 -. 468 -. 059 -. 235 -. 095 -1.370 -. 031 -. 123 -. 994 -1.163 -. 759 -. 356 -1.151 -. 458 -5.035 -. 006 -.037 -. 430 -. 613 -- 177 -. 155 -. 428 -. 134 -1.980 SOUTHERN LINE 23-24 24-25 25-27 27-28 28-29 29-30 TOTAL -. 055 -. 206 -. 715 -. 471 -. 936 -. 518 -2.901 -. 018 -. 226 -. 451 -. 311 -. 187 -. 095 -1.288 -. 073 -. 432 -1.166 -. 782 -1.123 -. 613 -4.189 -. 025 -- 125 -. 455 -. 316 -. 438 -. 263 -1.622 out out out out out out OUT EASTERN LINE 13-30 (total) +.630 +.190 +.820 +.256 OUT WESTERN LINE 7-31 31-23 TOTAL -. 055 +.116 +.061 -. 298 +.092 -. 206 -. 353 +.208 -. 145 out in OUT
-55-the remainder of -55-the water recirculating in -55-the canyon. We feel that the
mass balance supports our choice of a reference level at a = 27.75. CTD 11 (at 2000 meters) was taken during a period of near-zero flow (1000 GMT, 30 June-see Figure 2.2). The record shows a thick bottom
layer of low temperature gradient which is considerably different from
the record of CTD 32 taken at the same place 10 days later. For this reason, we chose to substitute CTD 32 (at the same location) into the
northern line, feeling that calculations made using CTD 11 would give a poor representation of the geostrophic flow due to advection. If CTD 11 is substituted into the northern line, a total flow of 5.6 x 10⁶
m 3/sec is obtained for the northern line. The increased flow is due
mainly to the shallowing of the reference surface in CTD 11 as compared
with CTD 32.
D. Water Masses
The principal water masses involved in the deep circulation of
Ice-land Basin are as follows:
(1) Norwegian Sea Deep Water (NS).
e
= -0.50C; S = 34.920/oo. Theprincipal deep water mass of the Norwegian Sea. (2) Modified North Atlantic Water (MNA). 9 = 8.0 C; S =
35.20
0/oo.
A water mass whose 9 and S properties varyregionally. Values used are typical of the eastern