Publisher’s version / Version de l'éditeur:
Questions? Contact the NRC Publications Archive team at
[email protected]. If you wish to email the authors directly, please see the first page of the publication for their contact information.
https://publications-cnrc.canada.ca/fra/droits
L’accès à ce site Web et l’utilisation de son contenu sont assujettis aux conditions présentées dans le site LISEZ CES CONDITIONS ATTENTIVEMENT AVANT D’UTILISER CE SITE WEB.
International Stormwater and Urban Water Systems Modeling Conference
[Proceedings], pp. 1-14, 2008-02-21
READ THESE TERMS AND CONDITIONS CAREFULLY BEFORE USING THIS WEBSITE. https://nrc-publications.canada.ca/eng/copyright
NRC Publications Archive Record / Notice des Archives des publications du CNRC :
https://nrc-publications.canada.ca/eng/view/object/?id=535144cb-761e-4714-8494-ec68e085ba60 https://publications-cnrc.canada.ca/fra/voir/objet/?id=535144cb-761e-4714-8494-ec68e085ba60
Archives des publications du CNRC
This publication could be one of several versions: author’s original, accepted manuscript or the publisher’s version. / La version de cette publication peut être l’une des suivantes : la version prépublication de l’auteur, la version acceptée du manuscrit ou la version de l’éditeur.
Access and use of this website and the material on it are subject to the Terms and Conditions set forth at
A multi-objective optimization decision support model for renewal
planning of sewer networks
A M ult i-obje c t ive opt im izat ion de c ision suppor t m ode l for
re ne w a l pla nning of se w e r ne t w ork s
N R C C - 5 0 4 3 8
H a l f a w y , M . R . ; D r i d i , L . ; B a k e r , S .
M a r c h 2 0 0 9
A version of this document is published in / Une version de ce document se trouve dans:
International Stormwater and Urban Water Systems Modeling Conference,
Toronto, Ontario, February 21-22, 2008, pp. 1-14
The material in this document is covered by the provisions of the Copyright Act, by Canadian laws, policies, regulations and international agreements. Such provisions serve to identify the information source and, in specific instances, to prohibit reproduction of materials without written permission. For more information visit http://laws.justice.gc.ca/en/showtdm/cs/C-42
Les renseignements dans ce document sont protégés par la Loi sur le droit d'auteur, par les lois, les politiques et les règlements du Canada et des accords internationaux. Ces dispositions permettent d'identifier la source de l'information et, dans certains cas, d'interdire la copie de documents sans permission écrite. Pour obtenir de plus amples renseignements : http://lois.justice.gc.ca/fr/showtdm/cs/C-42
9
A Multi-Objective Optimization Decision
Support Model for Renewal Planning of
Sewer Networks
Mahmoud R. Halfawy, Leila Dridi, and Samar Baker
A new integrated approach for optimal renewal planning of municipal infrastructure systems has been developed. This paper discusses the application of the proposed approach to implement a GIS-based Decision Support System (DSS) to support the renewal planning of sewer networks. The approach involves several steps addressing condition rating, risk assessment, and prioritization of sewers. It also incorporates a procedure for identifying and selecting the most suitable renewal technologies. A genetic algorithm (GA)-based multi-objective optimization (MOO) technique is used to find a Pareto front and identify a set of feasible solutions, in which a set of sewers is selected for renewal each year, along with the associated costs and expected benefits in terms of condition improvement and risk reduction. The paper also presents an example application of the prototype DSS on the sewer network in Regina, Canada.
9.1 Introduction
Municipalities across the world are moving towards adopting more proactive, sustainable, and optimized approaches to manage sewer assets and plan for their short and long term renewal. These approaches primarily aim
to maximize the return on investment by optimizing budget allocation, maximizing asset performance, minimizing risk of failure, and minimizing life-cycle costs. Clearly, an integrated multi-criteria approach is needed in order to develop renewal plans that satisfy these conflicting criteria in a balanced and optimized manner.
The sewer renewal planning process remains fundamentally heuristic and subjective in nature, and is still largely considered as much an art as it is science. The process is mainly documented in the form of guidelines or manuals of best practices, e.g., WEF and ASCE (1994), WRc (2001), and InfraGuide (2003, 2004). However, the application of these guidelines varies significantly between different municipalities, and few or no standards have been defined for performing most of the activities involved. As a result, the renewal planning has been typically performed in a manual and subjective manner, with limited or no software support.
A survey of commercial asset management software (Halfawy et al 2006a) concluded that the vast majority of existing systems focus primarily on managing day-to-day operational activities (e.g., issuing and tracking work orders, mapping and data management, logging service requests, cost estimating, etc.) and that commercial offerings of renewal planning software are scarce. This scarcity is mainly attributed to: the lack of systematized, standardized, and quantitative models (e.g., deterioration, risk, prioritization, and optimization models); and the lack of adequate reliable data sufficient to support the application of such models. However, the need to systematize the renewal planning practices and to develop more consistent, standardized, and integrated renewal planning software solutions are now widely recognized.
This paper proposes a new step-wise integrated approach that could potentially assist municipal professionals in developing optimized renewal plans that identify the most appropriate renewal actions, while simultaneously optimizing the renewal costs, condition state, and risk of failure of the sewer network. The approach defines a systematic procedure to quantitatively assess and evaluate the costs and benefits of alternative renewal options, which would help to reduce the subjectivity typically employed in the decision-making process. The implementation and example application of a GIS-based DSS are also presented.
9.2 Decision Support Systems for Renewal
Planning of Sewer Networks
During the last decade, significant investment has been made in developing and deploying software tools to support various sewer renewal planning activities. The majority of these tools mainly support two activities: closed-circuit television (CCTV) inspection and condition rating, and hydraulic modeling. These tools are commonly used in municipalities. More advanced tools, which are less commonly used, implement functionality for deterioration modeling, prioritization, and capital planning activities. Examples of these tools include Harfan and RIVA, among others (Halfawy et al 2006a). Another software in this category, which is less common in North America, is WertMin (WertMin 2007). AQUA-WertMin uses a cohort survival function to model the sewer deterioration process (Baur and Herz 2002), and then uses this model for selective inspection planning, prediction of remaining service life, calculation of renewal costs, and investment planning. However, the use of these advanced tools by municipalities is still rare. This may be attributed to the high cost and technical requirements for customizing and deploying these tools.
Many municipalities and consulting firms have also developed their own in-house renewal planning software to conform to their work practices and specific data and process requirements. Most of these tools are developed by customizing general-purpose tools such as spreadsheets, DBMS, CAD, or GIS software. Examples of such tools include the UMA Engineering sewer management system (SMS) (Homeniuk and Croft 2005). The SMS software mainly supports condition assessment and rating, rehabilitation design, and maintenance management. Halfawy et al. (2000) also reported the development of a GIS-based software that supports integrated management and assessment of sewer networks inventory, condition, and hydraulic data.
A significant number of decision models and software prototypes have been reported in the literature. Many studies have proposed models to predict and assess sewer deterioration rates, risk of failure, asset prioritization, and selection of possible rehabilitation options. Most notably, the Computer-Aided Rehabilitation of Sewer Networks (CARE-S) research project (CARE-S 2007) was an international collaborative effort to develop a comprehensive suite of tools to support renewal planning activities. Ariaratnam and MacLeod (2002) proposed a proactive rehabilitation infrastructure sewer management (PRISM) model that used linear programming to optimize allocation of funding for maintenance and repair of the sewer network. Abraham et al (1998) proposed an integrated sewer management system that used probabilistic Markovian deterioration models and deterministic dynamic programming to optimize the selection of sewer
rehabilitation techniques. Fenner and Sweeting (1999) described a decision support model for rehabilitating non-critical sewers by using sewer performance and GIS data to rank variably sized grid squares into priority zones for rehabilitation action. Kleiner (2001) defined a semi-Markov process to model asset deterioration and a decision framework to optimize the scheduling of rehabilitation and inspection of large buried assets (e.g., trunk sewers). Fenner (2001) presented a review of several techniques employed in a number of countries for optimizing and prioritizing sewer rehabilitation strategies.
9.3 An Integrated Approach for Optimal Renewal
Planning of Sewer Networks
Renewal planning decision-making is inherently an integrated process that requires the assimilation of a multitude of condition, risk, cost, and optimization models. The process involves several inter-dependent data-intensive activities, which include inspection and condition assessment, risk assessment, prediction of future condition, asset prioritization, selecting appropriate renewal technologies, and evaluating alternative renewal plans. Clearly, an effective renewal planning scheme would require addressing these various activities from an integrative perspective. The need to define and adopt new integrated approaches to infrastructure management, in general, is widely recognized in industry and academia (Lemer 1998; Grigg 1999; Halfawy et al 2002). The development of proactive and optimized renewal plans will depend, to a large extent, on our ability to fully integrate models, data, and processes in a unified and consistent framework.
A process model that systematizes the structure, organization, and information flow among various asset management and renewal planning processes was developed through previous efforts (Halfawy 2007). This model characterized key infrastructure management processes by identifying the main activities involved and their interrelationships and information requirements. Based on this model, an integrated approach for optimal renewal planning of municipal infrastructure assets has been defined. The renewal planning problem can be defined as follows: what are the renewal actions (what assets to rehabilitate or replace, what methods to use, and when) for a specific planning horizon that would optimize the allocation of renewal budgets by maximizing the network’s average condition and minimizing risk of failure, subject to condition, risk, and budget constraints. This problem is tackled by adopting a step-wise algorithm where multi-year
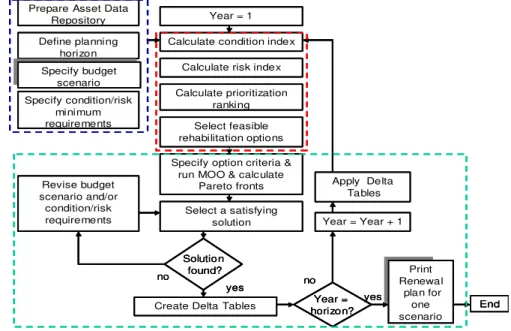
plans are optimized on a year-by-year basis. A typical plan establishes, for a given year and for each sewer segment, the most appropriate and cost-effective renewal action, if any. A plan would be used to update the sewers’ condition and risk levels and to develop renewal plans for subsequent years. Figure 1 shows the flowchart of the proposed renewal planning algorithm.
The proposed approach generates renewal plans on a segment level (i.e. manhole to manhole). The algorithm starts by classifying and subdividing the network into a set of homogeneous groups of sewers in terms of their current condition and deterioration pattern as well as their criticality (or expected consequence of failure). Then, for each group, a renewal plan will be developed for each planning period (e.g., one or more years). At the beginning of each period, sewer condition indices are re-evaluated using the deterioration model, taking into consideration any renewal actions that have been planned in previous years. The condition indices and deterioration models are used to estimate the remaining service life and calculate the likelihood of failure index. The consequence of failure is then determined, which, together with the calculated likelihood of failure index, is used to estimate the sewer risk levels.
Year = 1
Calculate condition index
Calculate risk index
Calculate prioritization ranking
Select feasible rehabilitation options Prepare Asset Data
Repository Define planning horizon Specify condition/risk minimum requirements Specify budget scenario Specify budget scenario
Specify option criteria & run MOO & calculate
Pareto fronts Select a satisfying solution Revise budget scenario and/or condition/risk requirements
Create Delta Tables yes no RenewalPrint plan for one scenario yes no Year = Year + 1 End Apply Delta Tables Solution found? Year = horizon? Year = 1
Calculate condition index
Calculate risk index
Calculate prioritization ranking
Select feasible rehabilitation options
Year = 1
Calculate condition index
Calculate risk index
Calculate prioritization ranking
Select feasible rehabilitation options Prepare Asset Data
Repository Define planning horizon Specify condition/risk minimum requirements Specify budget scenario Specify budget scenario Prepare Asset Data
Repository Define planning horizon Specify condition/risk minimum requirements Specify budget scenario Specify budget scenario
Specify option criteria & run MOO & calculate
Pareto fronts Select a satisfying solution Revise budget scenario and/or condition/risk requirements
Create Delta Tables yes no RenewalPrint plan for one scenario yes no Year = Year + 1 End Apply Delta Tables Solution found? Year = horizon? Specify option criteria &
run MOO & calculate Pareto fronts Select a satisfying solution Revise budget scenario and/or condition/risk requirements
Create Delta Tables yes no RenewalPrint plan for one scenario yes no Year = Year + 1 End Apply Delta Tables Solution found? Year = horizon?
Based on the condition and risk levels, a list of sewers prioritized according to their urgency of intervention is prepared. For each sewer on the priority list, the most feasible and cost-effective renewal actions are selected based on their technical and economical merits. These renewal actions are optimized, and a set of feasible optimal renewal plans is generated. The plans are further evaluated according to the budget constraints as well as their projected impact on the overall condition and risk levels. The decision-maker can carry out several iterations to evaluate alternatives and study the impact of various decision parameters until a renewal plan that meets all objectives and constraints is composed. The renewal plan is then applied in the form of delta tables to update the condition of the sewers for the following planning period. In multi-year planning scenarios, this process is repeated for every period in the planning horizon.
9.4 Renewal Planning DSS Implementation
During the past two years, an integrated and modular sewer management software environment has been under development in collaboration with the City of Regina, Saskatchewan, Canada. Details about the data and process models, and software architecture can be found in Halfawy (2008). The software environment aims to support various processes conducted by different functional groups within a typical municipal sewer department. Several applications have already been developed and integrated into the environment. Examples include inventory data analysis, query, and reporting, inspection and condition assessment, and hydraulic modeling. This section describes the implementation of the sewer renewal planning application based on the proposed approach. This application has been recently integrated into the sewer management environment.
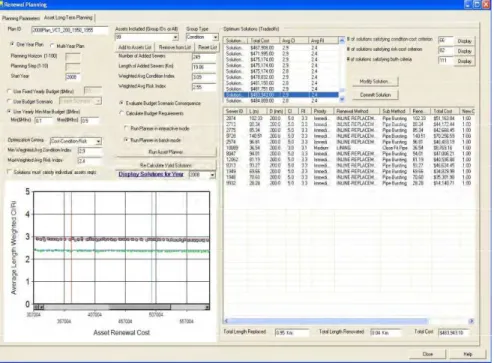
The renewal planning DSS application was implemented as a set of loosely coupled modules; each addressing one stage of the renewal planning process outlined above. Each module was implemented as an add-on to ESRI ArcGIS software using the ArcObjects class library (ESRI 2001). The modules can be simply invoked from a toolbar added to the ArcGIS interface (Figure 2). The genetic algorithm (GA)-based multi-objective optimization (MOO) module was implemented using the Open BEAGLE C++ class library (Open BEAGLE 2007). The modular architecture of the application will help accommodate future enhancement and extension of the application, e.g. implementing more sophisticated deterioration or risk models.
Sewer renewal planning requires access to a multitude of data about the network inventory, condition, risk criteria, renewal methods, etc. The sheer size and complex inter-dependencies of the data pose many data management and process coordination challenges. Also, conducting these activities involve a significant amount of redundancy in data collection, retrieval, interpretation, and re-entry. Efficient representation, integration, management, and sharing of these data sets can be efficiently supported through the use of a centralized integrated data repository (Halfawy and Figueroa 2006c).
An object-oriented integrated data model for sanitary and storm sewers was developed previously (Halfawy et al 2006b, Halfawy 2007). The data model defined classes that represented spatial, inventory, inspection, condition, risk, and renewal data. The data model also defined attributes to represent the proximity and inter-dependencies with other assets such as road segments and water mains, which are co-located in the roadway corridor. This information can be used to assess sewer criticality or to coordinate renewal actions. An integrated data model enables various activities to share common semantics and representation of the data, and hence, improves data availability and consistency across these activities (Halfawy et al 2002). The data model was defined using the Unified Modeling Language (UML) notation and was based on ESRI’s water utilities spatial data models (ESRI 2007). The UML data model was used to generate the database tables, fields, and data types based on ESRI’s geodatabase object-relational schema. The centralized integrated data repository was implemented using Oracle relational DBMS and the ArcSDE software (Halfawy and Figueroa 2006c). Accessing the data repository through a unified GIS interface significantly enhances the ability to explore, access, query, and edit data.
The DSS was designed to enable the user to control the level of asset granularity desired based on the quantity and quality of the available data and on the specific planning scenarios and requirements (e.g., long-term or short-term). For example, a particular group and all its associated deterioration and risk models, prioritization rules, and renewal methods data may span a large group of sewers or a single sewer segment. The flexibility would enable a system user to balance the data requirements and planning objectives to optimize the time and effort needed to collect and input data. For example, in the face of inadequate and/or unreliable data, the user may depend on the assumption of the homogeneity of assets within the same group and use a deterioration curve that approximates the average deterioration rate for the entire group. This assumption may be satisfactory
for most long-term or network level planning scenarios. However, short-term or project-level planning will typically have more data requirements in order to consider the specific characteristics and differences between individual sewers within a group. In general, the user is always allowed to input approximate values for missing data or to override values calculated or suggested by the system.
The DSS was also designed to allow for easy customization to the specific practices and rules used in a particular municipality. All data and settings that can be considered as municipality-specific (e.g., prioritization rules, criticality factors and weights, costs of renewal methods, etc.) were not hard-coded into the software and were stored in an external database that can be edited by users as required. For example, information about various renewal methods is stored in a database that can be customized to the specific practices and data available at a particular municipality.
9.5 Example System Use
The prototype DSS was used to develop renewal plans for an example sewer network in the City of Regina, Canada. Figure 2 shows the prototype GIS interface. More details about the DSS implementation and use can be found in Halfawy et al. (2008). The City of Regina has an inventory of approximately 860 km of sanitary sewers and 755 km of storm sewers. The network was subdivided into a set of homogeneous groups. This example demonstrates the development of a renewal plan for one year (2008) for one of these groups using actual data as recorded in the City database. The group was defined to include vitrified clay sanitary sewers, with 200 mm diameter, and constructed between 1950 and 1955. This group included 249 sewer segments with a total length of 19.86 km. Only 39 sewers in this group were previously inspected and rated using the WRc condition rating scheme (WRc 2001). The condition indices as recorded in the database were found to vary significantly, 2 sewers in condition state 1 (0.1 km), 17 in condition state 2 (1.5 km), 9 in condition state 3 (0.8 km), and 11 in condition state 4 (1 km). Based on these values, an average condition index for the un-inspected sewers is assumed to be 3 at the average age of 52 years. Given that condition data were only available for a small subset of the sewers, the user may at this point decide to perform CCTV inspection of the most critical sewers in the group to verify or revise this assumption.
Figure 9.2 GIS interface of the sewer renewal planning DSS
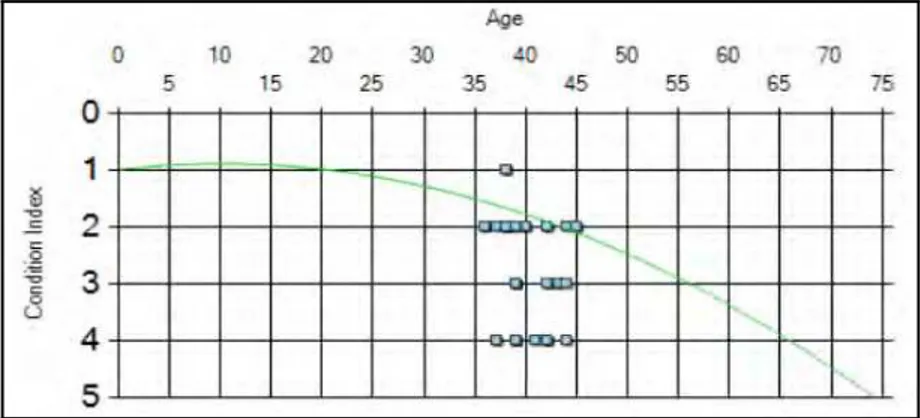
Fitting a deterioration curve to the set of the condition data points can then be performed. By analyzing data collected from several Canadian municipalities, a set of deterioration curves was developed by Newton and Vanier (2005). These curves were defined for sanitary sewers based on the condition data for approximately 9000 km of sewers, 3,400 km of which had condition data available. A database of these models was created and used to check if any previously defined curves approximately fit condition data for a particular group. If a sewer has two or more inspection records, a deterioration curve could be defined specifically for that sewer. However, in actual practice, adequate condition data to define deterioration curves for individual sewer segments are rarely available, and approximation and judgment are typically used to compensate for the data inadequacy. In this example, a deterioration curve from the library was found to reasonably fit the data points. The selected deterioration curve (Figure 3) indicates an expected service life of 75 years. The curve also indicates that, on average,
the condition index of a typical sewer in the group may reach 3 at the age of 55, which concurs with the general assumption previously made in estimating the condition index for the sewers that lacked inspection records.
Figure 9.3 Selected deterioration curve for the sewer group in the example
The deterioration curve is used to estimate the condition index of the sewers in a target year (2008). Although the deterioration curve indicates the average rate of sewer deterioration, individual sewers within the same group may exhibit different condition states at similar ages, which is evident in this particular group. For example, at an age of 42 years, some sewers were found to be in condition state 2, 3, or 4. Therefore, the prediction of future condition of a sewer should take into account the specific condition data of a sewer, if any is available. For example, the sewer that has a condition state 2 at age 42 would approximately reach condition state 5 at age 75, while a sewer that has a condition state 4 at age 42 would reach state 5 by age 50. Once the sewers’ condition indices for the target year are predicted using the deterioration model, the remaining service life and likelihood of failure index can be established. The remaining service life is estimated as the number of years until a sewer reaches condition state 5, and the likelihood of failure index is the ratio between the sewer age at the target year and its age when it reaches condition state 5.
Next, the sewer risk indices are calculated. To simplify this calculation, sewers can also be grouped according to their criticality criteria. Similar to condition groups, sewers with similar criticality levels are grouped into risk groups. Applicable criticality criteria can be selected and weights and ratings assigned. The risk factor, which indicates the “level of criticality” (or
consequence of failure) can then be calculated. The risk indices are subsequently calculated by multiplying these risk factors by the likelihood of failure index calculated at the previous step. The proposed approach defines a scale for risk indices that ranges between 5 (most critical) and 1 (least critical). In this example, the sewer risk indices for this group were found to range between 2.0 and 3.5.
Once condition and risk indices are determined for all sewers in the group, prioritization rules are applied to establish the “priority index” for each sewer. For the 249 sewers in this group, 11 sewers were found to need immediate intervention (priority index =5), no sewers with high priority (index = 4), 8 sewers with medium priority (index = 3), 230 sewers with low priority (index = 2), and no sewers with no renewal action needed (index = 1). Sewers with priority indices of 3, 4, and 5 are then considered for possible renewal actions.
The renewal methods selection procedure starts by identifying the applicable renewal category for each sewer, and retrieving the methods within these categories from the renewal technologies database. This database stores default information about renewal methods including their limitations (diameter range, soil type, pipe material, etc.), expected condition improvement, and cost. The default cost and improvement values are specified for each condition grade, since these values would depend on the type and severity of the defects. The user can eliminate some renewal methods or override their default values as they apply to a particular sewer or sewer group. For each sewer in the group, the system will then evaluate the applicability of various renewal methods and calculate costs and condition improvements.
The GA-based MOO module identified the Pareto fronts for the two main optimization criteria: condition-cost and risk-cost criteria. In this particular example, this calculation lasted for approximately 3 hours on a dual processor Pentium 4 (3.2 GHz) computer. The optimal solutions are further evaluated against the budget constraints as well as the minimum acceptable condition and risk levels ((i.e., weighted average) for the group. Figure 4 shows the cost-condition and cost-risk Pareto fronts between the minimum and maximum budget limits.
In this example, a budget scenario was given ($0.1-0.5 Million), and a total of 111 possible solutions were found to meet both condition and risk constraints. For example, one solution (highlighted in Figure 4) with a total budget of $483,943 indicated that 11 sewers (with condition index of 5) would be replaced (total length = 0.95 km), while one sewer (with condition index of 3) will be lined (0.04 km). This solution will result in improving the
average condition and risk indices of the group from 3.09 and 2.55 to 2.9 and 2.4, respectively. A decision maker may evaluate the impact of budget, condition, and risk constraints on the set of selected solutions, and experiment with different scenarios until a satisfactory solution is found. Scenarios may also be analyzed to show the relationship between the sewer system average condition/risk levels and funding levels (i.e. predict how different levels of funding would affect the overall network condition).
Figure 9.4 Cost-condition (red) and cost-risk (green) Pareto fronts and lists of valid solutions
9.6 Conclusion and Future Directions
Integrated sewer renewal planning DSS can play a critical role to improve the planning and management of sewer networks. This paper presented an approach for renewal planning of sewer networks. Although the proposed approach currently employs several simplified models (e.g., for risk
assessment), it provides a framework and software tools for practitioners to systematize and optimize the renewal planning decisions. The approach integrated the three main criteria in the planning process: condition, risk, and cost. It also incorporated procedures for the evaluation and GA-based multi-objective optimization of renewal methods. The approach can be used to support short and long term planning scenarios, as well as network-level and project-level planning. To efficiently implement the algorithm, an integrated data model was developed. The data model supported the integration and management of sewer data and enabled data sharing and exchange between various activities and software tools. A proof-of-concept GIS-based software was developed and demonstrated using the City of Regina data.
In light of this study, some directions for future research can be identified. Substantial work still needs to be done to refine and extend the approach and fully develop the software. An obvious extension is the use of sewer hydraulic performance, in addition to structural condition, in asset prioritization, selection of renewal methods, and in the assessment of pre- and post-rehabilitation performance. Through industrial partnerships, the approach and software are currently being refined, tested, and validated.
A similar approach has been developed and used to support renewal planning for water distribution networks. Our long-term research objective is to integrate the renewal planning processes for water, sewer, and road networks to optimize the overall allocation of funds across these spatially co-located assets within roadway corridors. The prototype will need to be extended to integrate and coordinate the renewal planning processes across these asset classes. Eventually, a comprehensive and fully integrated renewal planning software based on the proposed approach can be realized.
Acknowledgement
The authors thank the City of Regina Engineering and Works staff Loretta Gette, Ken Wiens, and Andrea Weston, for providing data and guidance throughout this project. Thanks are also due to Dr. David Hubble, Dr. Yehuda Kleiner, and the anonymous reviewers for their valuable suggestions and feedback.
Abraham, D., Wirahadikusumah, R., Short, T.J., and Shahbahrami, S. (1998). Optimization modeling for sewer network management, J. Construction Eng and Management, 124 (5), pp.402-410.
AQUA-WertMin (2007). <http://www.sewer-rehabilitation.com> (September 2007). CARE-S. (2007). Computer Aided REhabilitation of Sewer Networks,
<http://care-s.unife.it/> (July 25, 2007).
ESRI. (2001). Environmental Systems Research Institute, Exploring ArcObjects, Vol. 1 & 2, Redlands, California.
ESRI. (2007). “Environmental Systems Research Institute Water Utilities ArcGIS Data Models,” <http://support.esri.com/index.cfm?fa=downloads.dataModels.gateway> (July 25, 2007).
Fenner, R.A. & Sweeting, L. (1999). A decision support model for the rehabilitation of non-critical sewers. Water Science & Technology, IWA Publishing, 39(9), 193–200. Fenner, R. A. (2001). Approaches to sewer maintenance: a review, Urban Water 2
(2000), 343-356.
Grigg, Neil S. (1999). Infrastructure: Integrated Issue or Tower of Babel?" Journal of Infrastructure Systems, Vol. 5, No 4.
Halfawy, M.R., Pyzoha D., Young R., Abdel-Latif M., Miller R., Windham L. and Wiegand R. (2000). GIS-based sanitary sewer evaluation survey, 20th Annual ESRI International User Conference, Jun., San Diego, CA.
<gis.esri.com/library/userconf/proc00/professional/papers/PAP158/p158.htm>, Last accessed: March 2005.
Halfawy, M.R., Pyzoha, D., and El-Hosseiny, T. (2002). An Integrated Framework for GIS-Based Civil Infrastructure Management Systems, Proceedings of the Canadian Society for Civil Engineers (CSCE) Conference, Montreal, Canada.
Halfawy, M.R. (2008) Integration of municipal infrastructure asset management processes: challenges and solutions," ASCE Journal of Computing in Civil Engineering, 22 (3), pp. 216-229.
Halfawy, M.R., Dridi, L., Baker, S. (2008). Integrated decision support system for optimal renewal planning of sewer networks," ASCE Journal of Computing in Civil Engineering, 22 (6), In Press.
Halfawy, M., Newton, L., Vanier, D., (2006a). Review of commercial municipal infrastructure asset management systems, J. ITCON, 11, 211-224.
Halfawy, M., Vanier, D., Froese, T., (2006b). Standard data models for interoperability of municipal infrastructure asset management systems, Canadian Journal of Civil Engineering, 33(12), 1459-1469.
Halfawy, M. and Figueroa, R. (2006c). Developing enterprise GIS-based data
repositories for municipal infrastructure asset management, Proc., Joint International Conference on Computing and Decision Making in Civil and Building Engineering, ICCCBE/ASCE/DMUCE/CIB, Montreal, Canada.
Homeniuk, R. and Croft, B. (2005). Implementing an automated sewer management system in Winnipeg, Canada: A systems Perspective, AWWA/WEF Information Management Technology Conference, April 18-20, Denver, Colorado, USA. InfraGuide (2003). Investment Parameters for Municipal Infrastructure”, National Guide
to Sustainable Municipal Infrastructure, Ottawa, ON, Canada.
stment_Planning/Investmnts_Paramtrs_Munic_Infrastr.pdf > (Accessed October 2007).
InfraGuide(2004). “Assessment and Evaluation of Storm and Wastewater Collection Systems,” National Guide to Sustainable Municipal Infrastructure, Ottawa, ON, Canada.<http://sustainablecommunities.fcm.ca/files/Infraguide/storm_and wastewater/assessmnt_evalu_storm_wastewtr_coll_syst.pdf > (October 2007). Kleiner, Y. (2001). Scheduling inspection and renewal of large infrastructure assets. J.
Infrastructure systems, 7 (4), 136-143.
Lemer, A.C., (1998). Progress Toward Integrated Infrastructure-Assets-Management Systems: GIS and Beyond, APWA International Public Works Congress, NRCC/CPWA Seminar Series: Innovations in Urban Infrastructure.
Newton, L.A. and Vanier, D.J. (2006). MIIP Report: The State of Canadian Sewers - Analysis of Asset Inventory and Condition, p.38, National Research Council, Institute for Research in Construction NRC-IRC, Ottawa, Canada.
<http://irc.nrc-cnrc.gc.ca/pubs/fulltext/b-5123.11/> (October 2007) Open BEAGLE. (2007). Open BEAGLE: A a versatile EC framework.
<http://beagle.gel.ulaval.ca> (October 2007).
WEF and ASCE. (1994). Existing sewer evaluation and rehabilitation,” WEF Manual of Practice FD-6 and ASCE Manual and Report on Engineering Practice No. 62, 1992. WRc. (2001). Sewerage Rehabilitation Manual, Fourth Edition, Volumes I & II, Water