Publisher’s version / Version de l'éditeur:
Journal of Fire Protection Engineering, 18, February 1, pp. 55-73, 2008-02-01
READ THESE TERMS AND CONDITIONS CAREFULLY BEFORE USING THIS WEBSITE. https://nrc-publications.canada.ca/eng/copyright
Vous avez des questions? Nous pouvons vous aider. Pour communiquer directement avec un auteur, consultez la
première page de la revue dans laquelle son article a été publié afin de trouver ses coordonnées. Si vous n’arrivez pas à les repérer, communiquez avec nous à [email protected].
Questions? Contact the NRC Publications Archive team at
[email protected]. If you wish to email the authors directly, please see the first page of the publication for their contact information.
NRC Publications Archive
Archives des publications du CNRC
This publication could be one of several versions: author’s original, accepted manuscript or the publisher’s version. / La version de cette publication peut être l’une des suivantes : la version prépublication de l’auteur, la version acceptée du manuscrit ou la version de l’éditeur.
For the publisher’s version, please access the DOI link below./ Pour consulter la version de l’éditeur, utilisez le lien DOI ci-dessous.
https://doi.org/10.1177/1042391507080810
Access and use of this website and the material on it are subject to the Terms and Conditions set forth at Corrosion of electronic components by hydrogen fluoride
Kim, A. K.; Crampton, G. P.
https://publications-cnrc.canada.ca/fra/droits
L’accès à ce site Web et l’utilisation de son contenu sont assujettis aux conditions présentées dans le site LISEZ CES CONDITIONS ATTENTIVEMENT AVANT D’UTILISER CE SITE WEB.
NRC Publications Record / Notice d'Archives des publications de CNRC:
https://nrc-publications.canada.ca/eng/view/object/?id=094c2640-9b05-4117-bbfd-1a7309017730 https://publications-cnrc.canada.ca/fra/voir/objet/?id=094c2640-9b05-4117-bbfd-1a7309017730
http://irc.nrc-cnrc.gc.ca
C o r r o s i o n o f e l e c t r o n i c c o m p o n e n t s b y
h y d r o g e n f l u o r i d e
N R C C - 4 9 2 1 9
K i m , A . ; C r a m p t o n , G .
A version of this document is published in / Une version de ce document se trouve dans: Journal of Fire Protection Engineering, v. 18, no. 1, Feb. 2008, pp. 55-73 doi:
10.1177/1042391507080810
The material in this document is covered by the provisions of the Copyright Act, by Canadian laws, policies, regulations and international agreements. Such provisions serve to identify the information source and, in specific instances, to prohibit reproduction of materials without written permission. For more information visit http://laws.justice.gc.ca/en/showtdm/cs/C-42
Les renseignements dans ce document sont protégés par la Loi sur le droit d'auteur, par les lois, les politiques et les règlements du Canada et des accords internationaux. Ces dispositions permettent d'identifier la source de l'information et, dans certains cas, d'interdire la copie de documents sans permission écrite. Pour obtenir de plus amples renseignements : http://lois.justice.gc.ca/fr/showtdm/cs/C-42
Corrosion of Electronic Components by Hydrogen Fluoride (HF)
Andrew Kim* and George Crampton
Fire Research Program,
Institute for Research in Construction, National Research Council Canada
1200 Montreal Road,
Ottawa, Ontario, K1A 0R6, CANADA
ABSTRACT
Generation of Hydrogen Fluoride (HF) from fire suppression by some gaseous agents is a major concern, because HF causes corrosion. Without proper precautions, the HF corrosion damage to some electronic facilities could be significant. A study was carried out to evaluate the corrosion effect of HF on electronic equipment. This paper describes the details of the corrosion
assessment study and provides test results of the corrosion damage assessments. The test results showed that surface corrosion on the electronic boards was visible when the test specimen was exposed to HF concentrations above 1000 ppm for 1 h. Test results also showed that the video card with many attached components was much more vulnerable to HF corrosion damage than the other test boards. The functionality of the video card was affected even at a relatively low HF concentration of 500 ppm.
INTRODUCTION
Generation of Hydrogen Fluoride (HF) from fire suppression by some gaseous agents is a major concern, because HF causes corrosion on many types of materials including electronic components. A study by the National Research Council of Canada (NRC) [1, 2] had shown that current halocarbon replacements produce at least 5 to 10 times more HF than Halon 1301 does under similar fire challenges. In electronic facilities protected with halocarbon systems, corrosion of electronic equipment due to HF, is a major concern after completion of the fire suppression.
Without proper precautions, the HF corrosion damage to some electronic facilities could be significant. A review by NRC [3] indicated that previous studies [4-13] have provided no clear threshold concentration of HF or exposure duration that can cause short-term or long-term corrosion damage to electronic equipment. The degree of corrosion damage to electronic facilities is dependent on the HF concentration, exposure time, temperature and relative humidity of the enclosure and the properties of the equipment exposed.
A study was initiated by NRC to evaluate the impact of Thermal Decomposition
Products (TDP) of HFC-227ea (FM-200) on electronic equipment. The study was carried out in
*
Author to whom correspondence should be addressed. E-mail: [email protected] Fax # : (613) 954-0483 Phone # : (613) 993-9555
two phases. In the first phase, fire tests were carried out to determine the possible amount of TDP, especially HF, produced by HFC-227ea during fire extinguishment under fire conditions encountered in typical electronic facilities. In the second phase, the short and long term effects of HF, at the measured concentrations, on electronic components were assessed.
The results of the first phase study was reported previously [14], and the results of the second phase study is presented in this paper. This paper describes the details of the corrosion assessment study, including test protocol, and provides the test results of the corrosion damage assessments, including the functionality of the electronic components after being exposed to various HF concentrations.
TEST SET-UP AND PROCEDURE
Experiments were conducted using a 1 m3 box to investigate the corrosive effect of HF on electronic components. Three types of electronic components were placed in the test box and HF was injected into the box. Tests were carried out for various HF concentrations and
duration. The test specimens were examined for corrosion damages after the exposure tests.
Test Box
The 1 cubic meter square box was constructed using 20 gauge 316 stainless steel. All joints and wall penetrations of the compartment were sealed to reduce air leakage. The top of the box had a 300 mm x 300 mm opening to allow access to the box. This opening was normally covered with a lexan window sealed with a polyethylene gasket. There were 2 holes plugged with rubber corks at mid-height of one side through which a torch flame and hot air were introduced into the test box during some tests. A picture of the test box with
instrumentation is shown in Figure 1.
There were 5 stainless steel tube sample ports; 4 on the top and 1 on the lower side. Sample ports on the top of the box were used to insert tubes into the box for pressure
measurement and collecting gas samples for FTIR measurements as well as for the installation of a pressure relief tube. The side port was used to inject HF into the box. A 6.4 mm diameter (1/4") stainless steel tube for HF injection was welded 50 mm above the bottom of the box along the vertical center line. A 3-way valve connected the tube to a flexible Teflon line, which was connected to the needle valve on the HF cylinder. The bypass of the 3-way valve was connected to tygon tubing and ran to the exterior of the test facility.
A small fan was placed inside the test box. The 100 mm boxer fan, 2.7 m3 (100 cfm) capacity, was located near the test specimen in the upper portion of the box and was oriented to blow down in order to circulate and mix the gases in the test box.
Instrumentation and Gas Measurement
Data from various instrumentation was collected using a data acquisition system. The temperature distribution and the pressure changes in the test box were measured using
Three thermocouples were installed in the test box to monitor the temperature changes during the tests. Two stainless steel thermocouples 1.6 mm (1/16") diameter closed bead with grounded junctions were mounted at the top and bottom quarter points along the vertical center line of the box. An additional thermocouple, a fiberglass sheathed 36 gauge open bead, was placed near the test specimen located at the top 1/3 point of the box along the vertical center line. To monitor pressure changes in the test box during the tests, a 6.4 mm diameter pressure tap was installed on the top of the test box, 250 mm from an outside edge.
The concentrations of CO2 and CO, as well as the concentrations of HF and water vapor in the test box, were determined using an FTIR. CO2 and CO concentrations were measured to determine the leakage characteristics of the test box. The amount of water vapor in the test box was measured to determine the relative humidity (RH) in the box. HF reacts with moisture, therefore, the corrosion effect of HF would be sensitive to the humidity and heat in the test box as well as the concentration of HF.
Gas sampling ports were installed in the test box to measure the CO2, CO, HF and water vapor concentrations. Two 6.4 mm diameter stainless steel inlet and outlet gas-sampling probes were placed near the top of the box. These sampling probes were connected to the FTIR by a heated stainless steel tube to prevent condensation of the sample gases. The FTS 175 FTIR spectrometer was used to measure the gas concentrations and the amount of water vapor in the test box. The gas samples were extracted from the test box, then flowed through a cylindrical gas cell (100 mm path length, 32 mm diameter, 110 mL volume) at a flow rate of 8 L/min. The spectrometer scanned the gas samples in the frequency range of 4500 to 400 cm-1 at 1 cm-1 resolution. Each spectrum from a scan was recorded every 2 s.
Test Specimen
Three types of electronic components were used in the tests to study the corrosion effects of HF. They were two types of custom-made corrosion detector boards and a computer video card.
One of the custom-made corrosion detector boards (Type 1) had a continuous copper wire loop, which detects the loss of current due to corrosion of the copper loop. The Type 1 board was made from 3.175 mm thick board material with 0.036 mm thick copper clad on one side. It was 25.4 mm wide by 55.88 mm long. A continuous trace of 0.305 mm wide copper circuit ran back and forth along the board with 0.305 mm spacing between the rows. Solder tabs were located at either end of the trace for mounting electrical connections to the board. The electrical resistance of a new Type 1 board before any exposure to HF was 4.1 ohms plus or minus 0.1 ohms. During the test, the electrical resistance of the board was continuously measured to detect any onset of corrosion on the board. The copper trace on the board was clean and unprotected prior to testing. Figure 2 shows a picture of the Type 1 corrosion detector board.
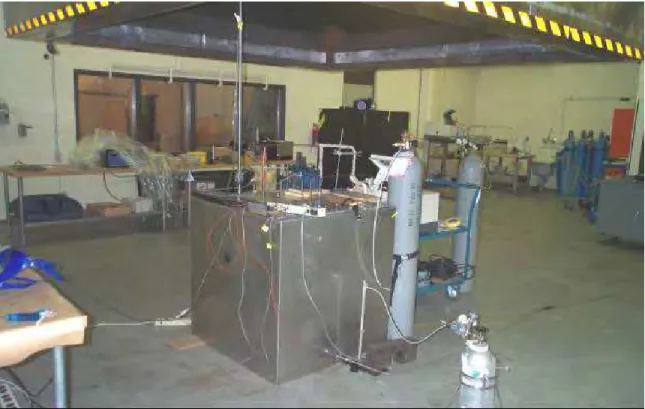
The Type 2 custom-made corrosion detector board had two parallel loops, which detects the loss of maintaining a voltage between the two charged loops due to corrosion of the board.
The Type 2 board was made from 3.175 mm thick board material with 0.036 mm thick copper layer on one side. It measured 50.8 mm wide by 50.8 mm long. Parallel traces of 0.318 mm wide copper circuit was put on the board; one copper loop runs along the board from one side and an identical loop runs from the other side such that no electrical connection exists between the two loops. These traces were separated by 0.318 mm spacing between the loops. Solder tabs were located at either end of the board for mounting the electrical connections. The electrical resistance of a new Type 2 board before any exposure to HF showed an open circuit. During the test, the electrical resistance of the board was continuously monitored to detect any resistance between the two loops, which indicates the onset of corrosion on the board. The copper traces on the board were clean and unprotected prior to testing. Figure 3 shows the picture of the deposition board Type 2.
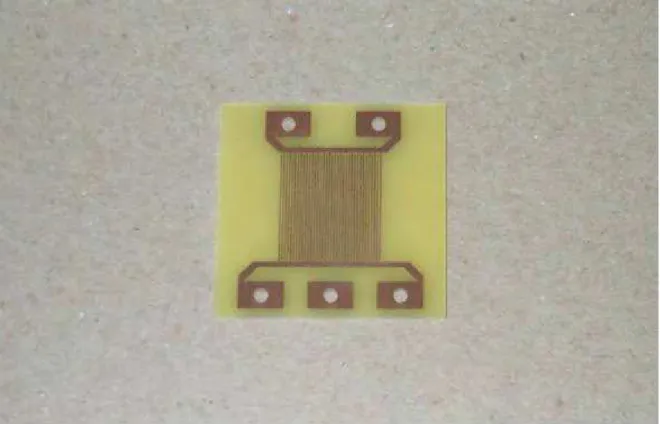
The computer video card used in the tests was a commercial grade, 5 volt PCI video card, SIS brand, model C6326. The video card contained many small components mounted on the surface of the board. This was a newer type of board, which is less rugged than older boards. Older boards had discreet components mounted on the board with pin connections and were very rugged. Newer video cards are more fragile and sensitive to corrosion effects.
Surface mounted components were hot air soldered and they were protected by very thin casings rather than the more rugged casing found on older style boards. The corrosion would attack the thin protective layer of the small surface mounted components rather easily and would affect the functionality of those components. A picture of the video card is shown in Figure 4.
HF Concentrations and Test Duration
The target concentrations of HF in the test box ranged from 100 ppm to 5000 ppm. These concentrations were within the range of HF concentrations measured in a typical
electronic cabinet facility during fire suppression in a previous NRC study [14]. In the previous study [14], tests were carried out to determine the amount of HF produced in a typical electronic equipment room during fire suppression with a HFC-227ea (FM-200) system, in a realistic fire scenario that could occur in an electronics facility. Fire scenarios used in the previous NRC study included cable bundle fires in simulated electronic cabinets with various ventilation conditions and a small liquid fuel fire.
The previous study [14] showed that for a cable bundle fire in an open or ventilated type cabinet, the HF concentration generated from agent-flame interaction was below 100 ppm in the fire cabinet, and very little HF moved into non-fire cabinets. For a cable bundle fire in a closed type cabinet test, it took a long time to extinguish the fire, and the HF generated from agent-flame interaction reached a peak concentration of 800 ppm in the fire cabinet, and then decayed slowly. Again, migration of HF from the fire cabinet to the adjacent non-fire cabinets was minimal. With a large pool fire with heat release rate of 500 kW, the HF concentration in the room reached a maximum of 3900 ppm. In the non-fire open type cabinet, a peak HF
concentration of 3800 ppm was measured, whereas in the ventilated type and closed type cabinets, peak HF concentrations of 1800 ppm and 500 ppm, respectively, were reached. When there is a large fire in the room, the generation of HF from the fire suppression by HFC-227ea was significant, and a large amount of HF migrated into the cabinets in the room.
The test duration was originally planned to be 1 h, 6 h, 24 h and 7 days. However, tests indicated that the HF concentration in the box diminished substantially with time and the HF concentration in the box was less than 10% of the initial value by the end of 6 h. Therefore, it was decided to limit the test duration to 1 h and 6 h.
Test Procedures
A video card was pre-checked in the test computer to make sure that it was functioning properly before the test. The video card and several Type 1 and Type 2 boards were placed in the test box before a pre-determined amount of HF was injected into the box. HF was stored in a cylinder in the liquid phase, and it was released into the box through a stainless steel tube at a fixed flow rate for a specific duration to produce the predetermined concentration of HF in the box. The HF went through a phase change as it flowed through the stainless steel tube, and by the time it reached the test box, most of it was fully vaporized. To obtain a steady flow of HF in the injection tube, the HF cylinder was immersed in a hot water bath (40 – 45°C), which
enhanced the vaporization of the liquid HF in the cylinder.
The weight of HF required to produce the desired concentration in the test box was calculated prior to the test. A needle valve was used to release a steady flow of liquid HF from the cylinder through the stainless steel tube. The cylinder was weighed using a digital scale to measure the exact amount of HF released.
The concentration of HF in the box should be proportional to the amount of HF released in the box, however, it was noted that it was also sensitive to the humidity in the box. Some of the injected HF condensed in the box and was not fully vaporized. The amount of HF
condensed was related to the relative humidity (RH) in the box. The measured HF
concentration in the box was always lower than the theoretical HF concentration based on the amount of injected HF.
In a typical fire scenario in an electronic facility, there will be some humidity and heat produced by the combustion effect of the fire in the facility prior to the extinguishment with a fire suppression system. Extinguishment of the fire with a halocarbon agent produces HF. The concentration of HF is sensitive to the humidity and heat in the compartment, because the humidity and heat loss enhances condensation of the HF.
To simulate this effect of humidity and heat in the current study, a small flame was inserted into the test box prior to the injection of HF. The size and duration of the flame were calculated to produce the same amount of heat per unit volume as the NRC’s previous full-scale halocarbon agent tests [1].
In the previous NRC study [1], a 120 m3 compartment was used to evaluate the TDP production of halocarbon agents. In that study, the typical fire size was 500 kW, and the pre-burn duration was 30 s. This is equivalent to 125 kW-s/m3. To produce the same amount of heat per unit volume, a small torch flame of 1 kW was introduced in the test box (1 m3) for the duration of 2 min 30 s, prior to the injection of HF in the box.
The data acquisition system and FTIR were turned on at time zero, which was 30 s prior to the start of the test, to get background data. At 30 s, a 1 kW size flame was placed in the test box through a small access hole on the side of the box. This flame lasted for 2 min 30 s. After heating the box, the access hole was plugged with a rubber cork and the injection of HF into the box started.
After the completion of HF injection into the test box, a small fan placed inside the test box was turned on to mix the air in the box and to produce a uniform HF concentration in the test box. The test specimens were exposed to a specific concentration of HF in the test box for a pre-determined duration. During the tests, HF concentration and moisture content in the test box were continuously measured by the FTIR. Also, visual observations of the test condition including the fogging of HF in the test box were recorded during the test.
After the tests, the test specimens were removed from the test box, and they were visually examined for any changes in the copper wire spacing or width in the circuit board as well as for any discoloration or pitting on the surface. The Type 1 and Type 2 corrosion detector boards were connected to an ohm meter and changes in the electrical resistance of the circuits on the boards were measured, which indicate the deterioration of the functionality of the boards. The video card specimen was visually examined for surface corrosion, then it was tested for any changes in functionality by installing it in the test computer.
Some test specimens were washed with distilled water, flushed with alcohol and blow-dried to determine whether it would help in reducing the corrosion damage and revive some of the functionality of the test specimens.
RESULTS AND DISCUSSION
A total of 16 tests were conducted with various HF concentrations in the box, ranging from 200 ppm to 5000 ppm. Table 1 shows summary of the test results. Theoretical HF column shows calculated HF concentration based on the amount of HF injected into the box. Measured peak HF column shows the largest HF concentration in the box measured by FTIR. Box RH column shows the RH in the box at the beginning of each test. This RH was calculated based on the amount of water vapor in the box measured by FTIR. The RH values for most of the test are high, because a small flame was introduced in the box at the beginning of the test, which
produced water vapor. In some of the tests (Test #7-9, 11, 15), small flame was not used in the test. In Test #16, the test box was purged with dry air before the test to remove all moisture in the box.
The tests clearly showed that the electronic boards had corrosion problems when they were exposed to a high level of HF concentration. The corrosion problem can be grouped into two types; surface corrosion and degradation of functionality of electronic equipment. Surface corrosion is caused by acidic liquid droplets depositing on a surface. A high level of acidic liquid droplets in a fire compartment will result in severe corrosion problems on all of the exposed surfaces including walls, cabinets and exposed circuit boards. Degradation of the functionality of electronic equipment due to acid corrosion is more sensitive to the gaseous HF concentration in the compartment.
HF Concentrations in the Box
HF concentration in the test box was measured using the FTIR. It was noted during the tests that even though enough HF was injected into the box to produce the target HF
concentration in the box, the measured HF concentration was always lower than the target HF concentration. Some of the injected HF was either not fully vaporized or reacted with moisture to form acid droplets or liquid condensate. In some tests, especially when the humidity in the test box was high, a significant amount of fog was noted during the HF injection, confirming the reaction of HF with moisture to form acid droplets.
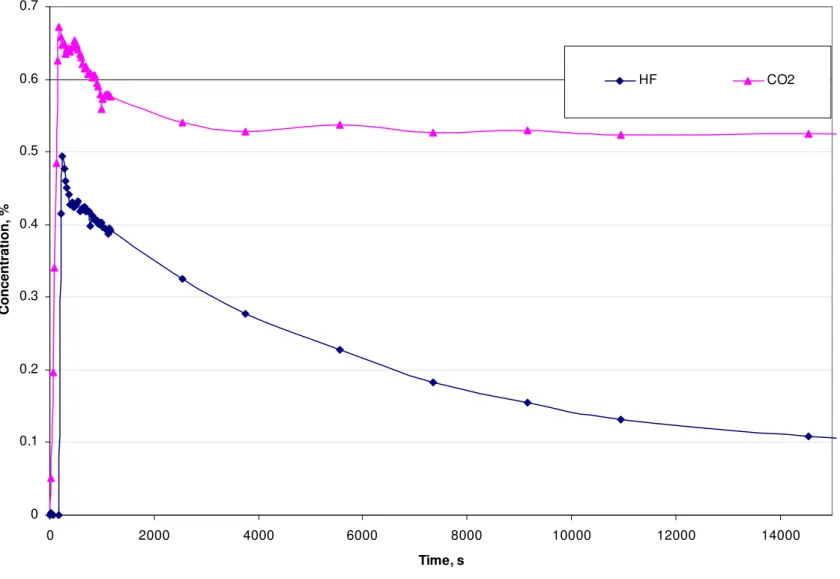
The peak HF concentration was reached at the completion of the HF injection. However, the HF concentration decayed quickly with time. First, it was assumed that the reduction in HF concentration was due to the leakage of the box, however, a measurement of CO2 concentration in the box showed that the test box was air-tight since the CO2 concentration in the box remained steady with time. A possible explanation for the sharp reduction in the HF concentration with time would be that the HF reacted with moisture and condensed very quickly, thus reducing the HF vapour concentration.
Figure 5 shows the HF and CO2 concentration changes with time. The figure shows that the CO2 concentration remains steady while the HF concentration drops sharply, confirming that the test box was not leaky and HF reduction was due to the HF reaction with moisture.
Corrosion Test Results (Short term effect)
The Type 1 and Type 2 corrosion detector board and computer video card were exposed to specific concentrations of HF in the tests. The test results showed that surface corrosion of the electronic board depended on the concentration of HF as well as the humidity in the compartment during the exposure period. Moisture reacted with HF in the compartment, and the acidic moisture condensed on the surface of the electronic boards to cause corrosion. Condensed acidic moisture on the electronic board attacked the surface, and depending on the degree of surface corrosion, the printed circuit on the surface was damaged by the condensed acid and the functionality of the board was affected.
Table 2 shows the changes in the resistance of Type 1 and Type 2 corrosion detector boards during the HF exposure in some of the tests.
The resistance measurement during the HF exposure shows slight increase in the resistance for Type 1 detector board. The Type 1 detector board has a continuous copper wire loop, and if the wire loop is damaged by corrosion, the resistance would be increased. However, small corrosion on the wire loop would not change the resistance significantly. To have a significant change in the resistance, the corrosion damage has to be significant enough to cut into the wire loop. The test results show that there is some surface corrosion on the surface of the wire loop, as indicated by a small change in the resistance, but the corrosion damage is not significant enough to damage the wire loop.
The test results show a significant change in the resistance measurement during the HF exposure tests for Type 2 corrosion detector board. Type 2 corrosion detector board has two parallel loops, and resistance measurement before the tests showed an open circuit. If there is a corrosion damage on the surface, such that the distance between the two parallel loops is compromised, or if there is a small deposit on the surface, which enables some current between the two parallel loops, then the resistance between the two loops would drop significantly. The test results show a significant change in the resistance for Type 2 detector board, which may be caused by condensation of HF on the detector board, reducing the resistance between the two wire loops from open circuit to much lower resistance.
Test results showed that surface corrosion on the electronic boards was visible when the test specimen was exposed to HF concentrations above 1000 ppm for a 1 h exposure duration. Figures 6 and 7 show pictures of Type 1 and Type 2 corrosion detector boards before and after exposure to HF. Above 5000 ppm, heavy corrosion damage on the specimen surface was noted, and the printed circuit on the surface was also damaged, which affected the functionality of the board. When exposed to HF concentrations of less than 1000 ppm, no visible corrosion damage on the surface was noted. However, the surface corrosion damage depended not only on the concentration of HF but also depended on the humidity of the surrounding air. When the
humidity was high in the test compartment, minor surface corrosion was noted at 1000 ppm HF, however, under very dry conditions, no surface corrosion was noted even at 2500 ppm HF.
The functionality of the computer video card was tested after exposure to various HF concentrations. The video card was an electronic board, which contained many small
components mounted on the surface. Surface mounted components were hot air soldered and protected by very thin casings rather than the rugged casings used in older type boards.
Test results showed that the video card was very vulnerable to HF corrosion damage. The functionality of the video card was affected even at a relatively low HF concentration. Test results showed that the video card functioned normally after exposure to less than 400 ppm peak HF for 1 h. However, when exposed to 500 ppm peak HF, there was a partial malfunction of the video card. The video card, after exposure to peak HF above 500 ppm, had a total loss of
functionality. The degree of damage to the video card depended mostly on the gaseous HF concentration and was not affected by the humidity, unlike surface corrosion.
If the fire compartment is humid (over 70% RH), even with the same amount of HF production in a compartment, more condensed acid will be produced, and there will be less HF in the air, resulting in lower gaseous HF concentration when measured by FTIR. In this case, there will be more surface corrosion and less problems with the functionality of electronic components. On the other hand, if the compartment is dry, for the same amount of HF
production in a compartment, there will be less condensed acid, and more HF in the air. In this case, there will be less surface corrosion and more problems with the functionality of electronic components.
Exposure duration is another parameter, which may affect the severity of the corrosion problem. In the current tests, however, it was shown that the effect of exposure duration on the severity of corrosion was not as important as the HF concentration and the humidity level in the
test compartment. This is partly due to the rapid decrease in the HF concentration in the test box with time.
The test results indicated that the HF concentration in the test compartment reached a peak value right after the completion of the HF injection into the test box, and then dropped sharply with time. The HF concentration decay in the test box depended on the humidity level in the box. The study indicated that HF is a very reactive gas and it reacts with moisture in the compartment and condenses into acidic liquid droplets, substantially reducing the gaseous HF concentration in the compartment. In tests with a small torch flame, the humidity level in the box was relatively high and the HF concentration in the box dropped to below 30% of its peak concentration after 1 h exposure duration. The test results showed that the test specimen exposed for 6 h had a little more surface corrosion problem compared to the test specimen exposed for 1 h at the same HF concentration, however, the degradation of the functionality of the two test specimens were approximately the same. In most fire compartments, the condition would be rather humid due to moisture generation from the combustion, therefore, the corrosion of electronic equipment exposed for more than 24 h may not be much different from the
corrosion for equipment exposed for a shorter period with the same initial peak HF concentration.
Corrosion Test Results (Long term effect)
To investigate the long-term effect of HF corrosion on electronic equipment, including further deterioration of the functionality of the electronic equipment with time after initial exposure to HF, test specimens were cleaned and stored in a safe place to be examined at a later date.
The test specimens were examined for changes in surface corrosion and functionality of the test specimen at one month intervals for a 6 month duration after the exposure tests. The examinations showed that there were some advances in surface corrosion as well as further degradation of the functionality of the test specimen. The rate of increase in surface corrosion and degradation of functionality was very gradual, and hardly measurable at a one month intervals. However, comparing the condition of the test specimen at the time of exposure and at 6 months after the test, showed a definite change in the surface corrosion and functionality. The electronic boards showed a further corrosion on the surface and current and voltage
measurements showed an increase in resistance of the circuit board indicating further degradation of the functionality of the test specimen. Also, the video card that functioned partially after the exposure test lost all its functions after the 6 month period.
CONCLUSION
The experiments clearly showed that the electronic boards were affected with corrosion when they were exposed to HF. The corrosion problem can be grouped into two types: surface corrosion and degradation of functionality of electronic equipment. Surface corrosion is caused by acidic liquid droplets depositing on a surface. A high level of acidic liquid droplets in a fire compartment will result in a severe corrosion problem on all exposed surfaces including walls,
cabinets and exposed circuit boards. Degradation of the functionality of electronic equipment due to acid corrosion is more sensitive to the gaseous HF concentration in the compartment.
During the tests, it was shown that the HF concentration in the test box depends not only on the amount of HF injected but also on the humidity of the air in the test box. When the air in the test box was humid, the injected HF reacted with the moisture and produced acidic droplets, which deposited on the surface of the test box, resulting in lower gaseous HF concentration in the test box. The condensed acidic droplets caused severe surface corrosion on any surface where it was deposited.
Test results showed that surface corrosion on the electronic boards was visible when the test specimen was exposed to HF concentrations above 1000 ppm for 1 h. However, the surface corrosion was very sensitive to the humidity in the compartment. If the condition was very dry in the compartment, the test specimen showed no visual surface corrosion even after exposure to 2500 ppm HF concentration.
Above 5000 ppm, heavy corrosion damage on the specimen surface was noted and the printed circuit on the surface of the board was also damaged. This affected the functionality of the board. When exposed to HF concentrations of less than 1000 ppm, no visible corrosion damage on the surface was noted.
Test results also showed that the video card with many attached components was much more vulnerable to HF corrosion damage than the small test boards. The functionality of the video card was affected even at a relatively low HF concentration. Test results showed that the video card functioned normally after exposure to less than 400 ppm peak HF for 1 h. However, when exposed to 500 ppm peak HF, there was a partial malfunction of the video card. The video card, after exposure to above 500 ppm peak HF, had a total loss of functionality. The degree of damage to the video card (with many attached components) depended mostly on the gaseous HF concentration and was not affected by the humidity, unlike surface corrosion.
Exposure duration is another parameter, which may affect the severity of the corrosion problem. In the current tests, however, it was shown that the effect of exposure duration on the severity of corrosion was not as important as the HF concentration and the humidity level in the test compartment.
A previous study by NRC [14] indicated that if a small cable bundle fire was confined in a cabinet, the HF production from the fire suppression by HFC-227ea was high only in a non-ventilated fire cabinet. Even in that case, migration of HF from the fire cabinet to the adjacent non-fire cabinet was minimal. The HF concentration in the non-ventilated fire cabinet was approximately 800 ppm, but the HF concentration in the open or ventilated fire cabinet was below 100 ppm. Therefore, in a typical electronic facility, if a fire were confined to a small cable bundle in a cabinet, the corrosion problem from the extinguishment by HFC-227ea would be minimal, except for the case where the fire was in a non-ventilated cabinet. In that case, the corrosion problem would be limited to the electronic components in the non-ventilated fire cabinet.
If a fire in the facility were a major one (above 500 kW) involving liquid fuel or other combustibles in the open area of the facility, the HF production from the extinguishment with HFC-227ea would be significant. The HF concentration level expected in the facility from the extinguishment of this size fire would be much higher than the threshold concentration of 500 ppm HF. Therefore, functionality of all electronic components in the facility, including the ones inside the closed type electronic cabinets, would be affected by corrosion.
ACKNOWLEDGEMENTS
This study was conducted under the Halon Alternatives Performance Evaluation
Program, a joint research project between the Department of National Defence and the National Research Council of Canada. The authors appreciate the assistance of Dr. Malgosia Kanabus-Kaminska in measuring the gas concentrations with FTIR.
REFERENCES
1. Kim, A.K., Su, J.Z. and Crampton, G.P., “Full-scale Fire Testing of HFC-227ea in a Mock-up of DND Frigate Radar Room No. 2,” National Research Council Canada, Ottawa, Client Report A-4223.2, July, 1996.
2. Kim, A.K., Su, J.Z. and Crampton, G.P., “Full-scale Fire Testing of HCFC Blend A in DND Frigate Radar Room No. 2,” National Research Council Canada, Ottawa, Client Report A-4223.3, August, 1996.
3. Liu, Z. and Kim, A.K., “Impact of Thermal Decomposition Products Generated by Halon Replacements on electronic Equipment – A Literature Review,” National Research Council Canada, Ottawa, Client Report B-4104.1, June, 1999.
4. Bartlett, P. K. N., “A Desk Top Study of the Corrosivity of Hydrogen Fluoride and Hydrofluoric Acid,” CAPCIS Client Report, UK, 1995.
5. Reagor, B. T., “The Impact of Smoke Corrosivity on Post-Fire Restoration Rates in Telephone Offices,” Proceedings of the Corrosive Effects of Combustion Products Conference, London, UK: Fire & Materials Center, Queens Mary College, 1987. 6. Reagor, B. T., “Combustion and Corrosivity,” The Hinsdale Challenge Industry Forum,
Schaumgurg, lL: Ameritech Services, 1989.
7. Tanaka, T. J., “A Review of Smoke Damage to Electrical Equipment,” Sandia National Laboratories, NUREG/CR-6476, SAND96-2633, Appendix B, 1996.
8. Nowlen, S. P., “A Review of Research at Sandia National Laboratories Associated with the Problem of Smoke Corrosivity,” Fire Safety Journal 15, pp. 403-413, 1989.
9. Reagor, B. T., “Smoke Corrosivity: Generation, Impact, Detection, and Protection,” Journal of Fire Sciences, Vol. 10, pp. 169-179, 1992.
10. Gandhi, P. D., “Corrosion from Combustion Products – An Overview,” 13th Meeting of the UJNR Panel on Fire Research and Safety, Gaithersburg, USA, March 13-20, 1996, pp. 209-224.
11. Hanauska, C. P., Forssell, E. W. and DiNeno, P. J., “Hazard Assessment of Thermal Decomposition Products of Halon Alternatives,” Proceedings of Halon Options Technical Working Conference, pp. 577-582, Albuquerque, USA, 1993.
12. NASA Test Report TR-339-001, “Corrosion of Typical Orbitec Electronic Components Exposed to Halon 1301 Pyrolysis Product,” Issued by National Aeronautics and Space Administration, Johnson Centre, White Sands Test Facility, November, 1985.
13. Bryan, J. L., “The Effects of Corrosive Thermal Decomposition Products on Input/Output Cards, Produced when Halon Alternatives are Used to Extinguish a Heptane Fuel Fire,” William Dumayas Senior Research Report ENFP 416, July, 1993.
14. Kim, A. K., and Su J., “Thermal Decomposition Products from Fire Suppression with HFC-227ea in an Electronic Facility,” Journal of Fire Protection Engineering, Vol. 14, Number 4, pp. 265-281, 2004.
Table 1 Summary of test results Test # Theoretical HF (ppm) Measured peak HF (ppm) Duration (hr) Box RH (%)
Type 1 Type 2 Video card
1 3665 16 1 94 No resistance change, but shows some surface corrosion
No resistance change, but shows some surface corrosion
Not used
2 4581 1500 1 76 No resistance change, but shows some surface corrosion
No resistance change, but shows some surface corrosion
Not used
3 3300 450 1 74 No resistance change, and no visible corrosion
No resistance change, and no visible corrosion
Function normally
4 4800 2560 1 99 No resistance change, but shows surface corrosion
No resistance change, but shows surface corrosion
Did not function even after cleaning
5 4320 3180 1 99 No resistance change, but shows surface corrosion
Some resistance change, and shows surface corrosion
Did not function even after cleaning
6 4050 2000 6 80 No resistance change, but shows surface corrosion
Some resistance change, and shows surface corrosion
Did not function even after cleaning
7* 4230 2500 1 44 Small resistance change, but some surface corrosion
Small resistance change, and some surface corrosion
Did not function even after cleaning
8* 620 500 1 48 No resistance change, and no visible corrosion
No resistance change, and no visible corrosion
Partial function
9* 9080 4380 6 52 Large resistance change, and severe surface corrosion
Large resistance change, and severe surface corrosion
Did not function even after cleaning
10 11560 4946 6 95 No resistance change, but shows surface corrosion
No resistance change, but shows surface corrosion
Did not function even after cleaning
11* 480 475 1 48 No resistance change, and no visible corrosion
No resistance change, and no visible corrosion
Partial function
12 480 228 1 79 No resistance change, and no visible corrosion
No resistance change, and no visible corrosion
Function normally
13 1080 550 1 89 No resistance change, and no visible corrosion
No resistance change, and no visible corrosion
Partial function
14 13120 5050 6 86 Large resistance change, and severe surface corrosion
Large resistance change, and severe surface corrosion
Did not function even after cleaning
15* 2040 1440 0.33 57 No resistance change, and no visible corrosion
No resistance change, and no visible corrosion
Not used
16* 8160 3800 1 0 No resistance change, but small surface corrosion
Some resistance change, and small surface corrosion
Partial function
Table 2 Resistance of detector Type 1 and detector Type 2 during HF exposure tests
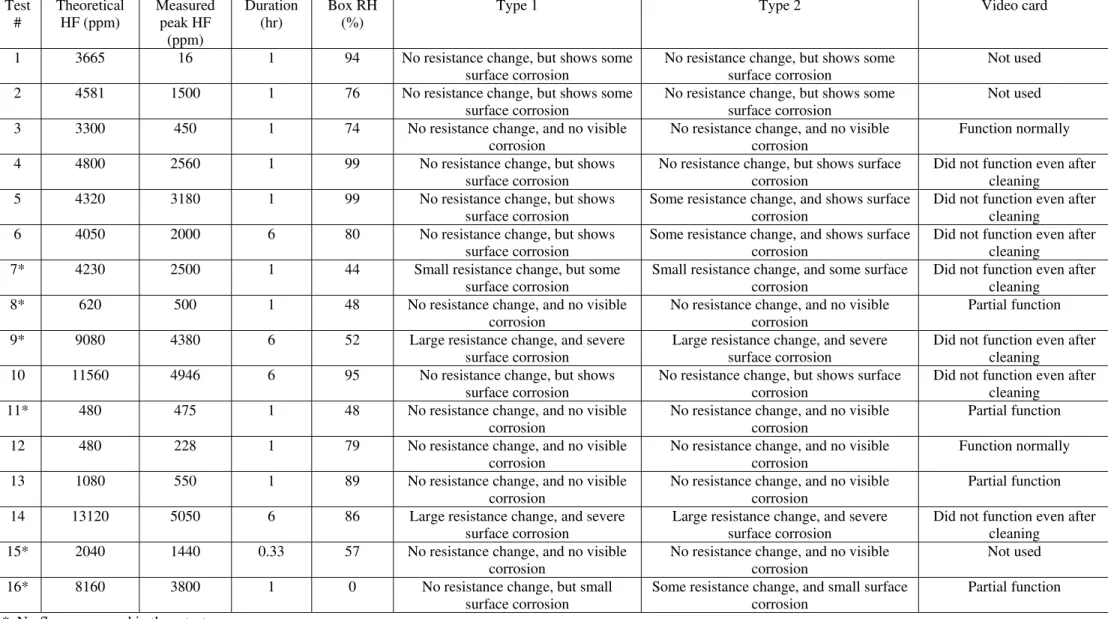
Test #5 HF concentration: target; 4000 ppm, measured peak; 3180 ppm Duration: 1 hr
Temperature; 38ºC Relative Humidity; 99%
Time (min:s) 0:00 6:00 12:00 17:30 25:00 35:00 45:00 Resistance Type 1 (ohms) 4.20 4.21 4.21 4.21 4.21 4.21 4.21 Type 2 (M ohms) open 18.0 16.6 15.3 14.0 14.0 13.6 Test #9 HF concentration: target; 8000 ppm, measured peak; 4380 ppm Duration: 6 hr
Temperature; 44ºC Relative Humidity; 52%
Time (min:s) 0:00 5:00 6:30 25:00 40:00 60:00 120:00 180:00 240:00 365:00 Resistance Type 1 (ohms) 4.16 4.18 4.18 4.18 4.18 4.17 4.18 4.19 4.19 4.18 Type 2 (M ohms) open 1.0 0.8 0.3 0.05 0.033 0.069 0.084 0.086 0.088 Test #14 HF concentration: target; 8000 ppm, measured peak; 5050 ppm Duration: 6 hr
Temperature; 40ºC Relative Humidity; 86%
Time (min:s) 0:00 6:00 20:00 30:00 38:00 50:00 120:00 180:00 240:00 360:00 Resistance Type 1 (ohms) 4.02 4.05 4.05 4.06 4.07 4.08 4.08 4.09 4.10 4.10 Type 2 (M ohms) open 0.14 0.11 0.057 0.04 0.025 0.0015 0.008 0.0075 0.0127
Figure 1 Picture of Test Set-up
Figure 3 Picture of Deposition Detector Board, Type 2.
0 0.1 0.2 0.3 0.4 0.5 0.6 0.7 0 2000 4000 6000 8000 10000 12000 14000 Time, s Co n cen tratio n , % HF CO2