Publisher’s version / Version de l'éditeur:
ASHRAE Transactions, 114, pt. 1, pp. 329-343, 2008-07-01
READ THESE TERMS AND CONDITIONS CAREFULLY BEFORE USING THIS WEBSITE. https://nrc-publications.canada.ca/eng/copyright
Vous avez des questions? Nous pouvons vous aider. Pour communiquer directement avec un auteur, consultez la première page de la revue dans laquelle son article a été publié afin de trouver ses coordonnées. Si vous n’arrivez pas à les repérer, communiquez avec nous à [email protected].
Questions? Contact the NRC Publications Archive team at
[email protected]. If you wish to email the authors directly, please see the first page of the publication for their contact information.
NRC Publications Archive
Archives des publications du CNRC
This publication could be one of several versions: author’s original, accepted manuscript or the publisher’s version. / La version de cette publication peut être l’une des suivantes : la version prépublication de l’auteur, la version acceptée du manuscrit ou la version de l’éditeur.
Access and use of this website and the material on it are subject to the Terms and Conditions set forth at
Balcony spill plumes: full-scale experiments, Part 1
Lougheed, G. D.; McCartney, C. J.
https://publications-cnrc.canada.ca/fra/droits
L’accès à ce site Web et l’utilisation de son contenu sont assujettis aux conditions présentées dans le site LISEZ CES CONDITIONS ATTENTIVEMENT AVANT D’UTILISER CE SITE WEB.
NRC Publications Record / Notice d'Archives des publications de CNRC:
https://nrc-publications.canada.ca/eng/view/object/?id=affdab6d-4ffa-4460-8c0f-e28af4de6d1f https://publications-cnrc.canada.ca/fra/voir/objet/?id=affdab6d-4ffa-4460-8c0f-e28af4de6d1f
http://irc.nrc-cnrc.gc.ca
B a l c o n y s p i l l p l u m e s : f u l l - s c a l e e x p e r i m e n t s ,
P a r t 1
N R C C - 5 0 0 4 4
L o u g h e e d , G . D . ; M c C a r t n e y , C . J .
A version of this document is published in / Une version de ce document se trouve dans: ASHRAE Transactions, v. 114, pt. 1, 2008, pp. 329-343
The material in this document is covered by the provisions of the Copyright Act, by Canadian laws, policies, regulations and international agreements. Such provisions serve to identify the information source and, in specific instances, to prohibit reproduction of materials without written permission. For more information visit http://laws.justice.gc.ca/en/showtdm/cs/C-42
Les renseignements dans ce document sont protégés par la Loi sur le droit d'auteur, par les lois, les politiques et les règlements du Canada et des accords internationaux. Ces dispositions permettent d'identifier la source de l'information et, dans certains cas, d'interdire la copie de documents sans permission écrite. Pour obtenir de plus amples renseignements : http://lois.justice.gc.ca/fr/showtdm/cs/C-42
Balcony Spill Plumes: Full-Scale
Experiments, Part 1 (RP-1247)
ABSTRACT
There have been a number of concerns regarding the balcony spill plume equation provided in North American standards and codes. These include: lack of verification by full-scale experiments and application of the equation for high atria even though it was developed for low-height atria. As a result of these concerns, the American Society of Heating, Refrigerating and Air-Conditioning Engineers (ASHRAE) initiated a project to evaluate the balcony spill plume equation used in North American codes and standards (RP-1247). The research project included CFD modeling studies to investigate smoke entrainment in the balcony area and smoke entrainment in high atria. The primary research conducted, as part of RP 1247, was a series of full-scale experiments conducted to investigate smoke flow in balcony spill plumes and the resulting mechanical exhaust requirements for an atrium. The full-scale experiments included measurements inside the fire compartment and in the opening between the fire compartment and the balcony area. It also included measurements in a simulated atrium space. In Part 1 of this paper, the results of the measurements in the fire compartment area are discussed. The data was also analyzed to estimate the mass flow rate through the compartment opening. The estimated mass flow rates are compared with algebraic equations, which are used to estimate the mass flow through a compartment opening.
INTRODUCTION
Atriums have become popular elements in commercial, office and residential buildings because they can provide attractive, environmentally controlled, naturally lit spaces. Such spaces, however, present a challenge for fire protection engineers because their height (typically greater than 20 m) decreases the effectiveness of automatic sprinkler systems and because they lack the floor-to-floor separations that can limit the likelihood of fire and smoke spreading from the floor of fire origin to other areas of the building. Evacuation routes in atriums are of greatest concern because they become vulnerable to spreading smoke unless smoke management measures are used. As a result, specific requirements are included in building codes for atria (IBC 2003; NFPA 2006; NBC 2005).
In recent years, approaches to smoke management in atria have been developed and are provided in standards and engineering guides (NFPA 2005; Klote and Milke 2002; Morgan et al. 1999). Smoke management systems can be used to accomplish one or both of the following (NFPA 2005):
1. Maintain a tenable environment in the means of egress from large-volume spaces during the time
required for evacuation;
2. Control and reduce the migration of smoke between the fire area and adjacent spaces.
NFPA 92B (2005) provides algebraic equations for the design of smoke management systems for three design fire scenarios:
1. The fire is located on the floor of the atrium and smoke production includes the air entrainment into
the plume as it rises to the ceiling (axisymmetric plume).
2. The fire is located in an adjacent space and the smoke flows through a compartment opening and
subsequently under a balcony before entering the atrium space (balcony spill plume).
3. A ventilation-limited fire is located in an adjacent space and the smoke enters the atrium through a
window, which is broken by the fire (window plume).
Initially in North America, the design of atrium smoke management assumed that the fire was located on the floor of the atrium and that the smoke production could be estimated using the axisymmetric plume equation. It was assumed that sprinklers would limit the size and thus the smoke produced by fires in adjacent spaces. In recent years, smoke management requirements for atria in the US building codes specify that the design of atrium smoke management systems includes design fire scenarios in both the atrium and adjacent spaces (UBC 1997; IBC 2003; IBC 2006). Also, research including full-scale fire tests
indicates that sprinkler-controlled fires can generate significant quantities of buoyant smoke (Morgan et al. 1999; Madrzykowski and Vettori. 1992; Lougheed 1997; Lougheed, McCartney and Taber 2000; Lougheed, McCartney and Taber 2001; Ghosh 1997). As a result, it has become necessary to consider design fire scenarios involving fires in both the atrium space and adjacent spaces in the design of an atrium smoke management system.
There have been a number of concerns regarding the balcony spill plume equation provided in NFPA 92B (2005) and IBC (2003). These include:
1. Lack of verification by full-scale experiments.
2. Application of the equation for high atria even though it was developed for low-height atria.
As a result of these concerns, the American Society of Heating, Refrigerating and Air-Conditioning Engineers (ASHRAE) initiated a project to evaluate the balcony spill plume equation used in North American codes and standards (RP-1247). For this project, three research activities were undertaken: • Full-scale experiments.
• CFD modeling to investigate smoke entrainment below the balcony and at the balcony edge as the plume spills into an atrium.
• CFD modeling of smoke entrainment into a balcony spill plume for high atria.
The CFD modeling studies were undertaken to address two concerns with the experimental program: 1. The distance between the balcony and the ceiling in the experimental facility was limited (5-7 m). This
distance exceeds the distance required in the initial request for proposals. However, in comparison to scenarios in many North American atria, this distance was a concern.
2. The second concern was the inability to fully investigate the effect of the parameters that affect air entrainment in the balcony area using full-scale experiments.
To address these issues, an effort was made to verify a CFD model using NIST’s Fire Dynamic Simulator (FDS) software (McGrattan et al 2002a; 2002b) for determining smoke entrainment into a spill plume. Detailed results of the modeling studies are provided in masters degree theses by Ko (2006) and McCartney (2006) and summarized in Ko et al. (2007) and McCartney et al. (2007).
The primary research conducted, as part of RP 1247, was a series of full-scale experiments, which investigated smoke flow in balcony spill plumes and the resulting mechanical exhaust requirements for an atrium. An extended set of full-scale experiments was conducted for a fire located in a compartment. Parameters that were varied included the width of the compartment opening and the fire size. Tests were conducted with and without a downstand in the compartment opening and with and without draft curtains used to channel the flow below the balcony.
The full-scale experiments included measurements inside the fire compartment and in the opening between the fire compartment and the balcony area. It also included measurements in a simulated atrium space. In Part 1 of this paper, the results of the measurements in the fire compartment area are discussed. Also, the data was analyzed to estimate the mass flow rate through the compartment opening. The estimated mass flow rates are compared with algebraic equations, which are used to estimate the mass flow through a compartment opening. The results for the measurements in the simulated atrium area are discussed in Part 2 of the paper (Lougheed, Gibbs and McCartney 2007).
EXPERIMENTAL STUDIES
There have been several experimental studies of balcony spill plumes. Most of these were conducted at
the Building Research Establishment (BRE) in the UK using 1/10th scale models. Experiments were also
conducted by at the University of Canterbury, New Zealand using salt-water modeling (Yii 1998) and a
1/10th scale model similar to that used at BRE (Harrison 2004). Reviews of the experimental studies are
provided by Harrison (2004) and Lougheed et al. (2006). A brief summary of the experimental studies is provided in this section.
Morgan and Marshall (1975). Morgan and Marshall (1975) conducted a series of 1/10th scale model experiments using the scaling principles provided by Thomas et al. (1963). The physical model simulated the smoke flow from a single shop with a width of 0.7 m and a double shop with a width of 1.4 m. The fire compartment was 0.5 m deep and 0.5 m high. A 0.4 m deep balcony extended along the full width of the shop and had draft curtains located at both ends. Experiments were conducted with the front of the shop fully open and a limited number of tests were conducted with a 0.16 m deep downstand running the full width of the opening. In addition, experiments were conducted with the double width shop with variable
openings. For these tests, the draft curtains were located at the edge of the opening and the downstand was included. The heated flow from the apparatus flowed into the laboratory.
Temperature data was used to develop the BRE spill plume method. Good agreement was obtained between the experimental results and the theoretical predictions. Law (1986) also used the maximum temperatures measured above the balcony for the initial development of a simplified equation for a balcony spill plume.
Morgan and Marshall (1979). Morgan and Marshall (1979) conducted a second series of 1/10th scale experiments using primarily the 0.7 m wide model shop. For these experiments, the smoke flowed into a large box with the smoke extracted from the top of the box using a mechanical exhaust system at an approximately constant rate. The heat source was a heater with a heat output between 1 and 4 kW. Most experiments were conducted with the draft curtains at 0.7 m. However, two experiments were conducted with the draft curtains at 1.4 m and a further two without draft curtains.
Thermocouple trees located outside the plume were used to measure the temperature distribution in the model atrium. These results were used to determine the thickness of the smoke layer. There was no clear demarcation between the smoke layer and the ambient air. An effective layer depth was determined by integrating the temperature-height curve.
The BRE spill plume method was used to compare the theoretical mass flow rates with those produced in the experiments. The results of this study gave rise to the development of the effective layer depth correction to allow for the temperature variation beneath the smoke layer. These experiments showed that the channeling by draft curtains was effective in reducing the amount of smoke produced by the spill plume. Law (1986) used the spill plume results from these experiments to develop a simplified calculation method.
Hansell, Morgan and Marshall (1993). Hansell, Morgan and Marshall (1993) conducted a series of
1/10th scale experiments with a model atrium. The model atrium was high (3.06 m) compared with the
model used by Morgan and Marshall (1979). It had a plan area of 3.3 m2 and a mechanical system was used
to extract air at the top.
The experiments were conducted to address specific issues regarding the horizontal flow of smoke toward an opening, air entrainment into both free and adhered plumes and the effect of balcony depth. Law (1995) used the results of these experiments to modify the earlier correlation (Law 1986) for the mass flow rate for a balcony spill plume and for the effective width of the spill plume without draft curtains.
Marshall and Harrison (1996). Marshall and Harrison (1996) conducted five series of tests using
1/10th scale physical models. Each series of test used a different atrium physical model to investigate
specific issues including the effect of atrium size, combustion air flow through the compartment opening and plume end effects on air entrainment into the plume. These experiments were used by Poreh et al. (1998) to develop a simplified spill plume expression.
Yii (1998). Yii (1998) conducted a study on spill plumes using salt-water modeling and a Laser
Induced Fluorescence (LIF) flow visualization technique using a 1/20th scale model. These experiments
investigated the qualitative features of the smoke flow but did not provide any quantitative information.
Harrison (2004). Harrison (2004) conducted 1/10th scale physical model experiments. The fire compartment was 1 m by 1 m by 0.5 m high with a 0.3 m deep balcony. The compartment opening extended the full height of the compartment and the width of the opening was varied using inserts. Full-height draft curtains were located at the edge of the opening.
A series of 55 tests were conducted with a 0.6 m wide opening. The primary parameters for this series of tests were the heat release rate, the compartment opening width and the depth of the downstand at the spill edge. Four tests were conducted with the downstand located at the compartment opening. A single fire size was used for these tests and the opening width and downstand depth were varied.
Harrison (2004) compared the measured spill plume mass flow rates with those determined using the BRE method. An algebraic equation was also developed for the smoke flow in a balcony spill plume equation for the scenario with a downstand at the spill edge. Also, an empirical relationship was developed for air entrainment beneath a balcony.
FULL-SCALE EXPERIMENTAL ARRANGEMENT
The main objective of the experimental program was to determine balcony spill plume mass flow rates produced by steady fires in a compartment with an attached balcony. The steady-state atrium smoke layer elevation was the major dependent variable to be measured. However, in reviewing the literature used to develop the present correlations for air entrainment into balcony spill plumes, it was noted that some key parameters that affect the mass flow rate in the balcony spill plume also affect the conditions within the fire compartment and the mass flow rate through the compartment opening. These parameters include the fire size (heat release rate), the width of the compartment opening and the presence of a downstand in the opening. In Part 1 of this paper, the experimental results are used to investigate the effects of these parameters on the conditions inside the fire compartment and on the smoke flow through the opening. The air entrainment in the simulated atrium space is discussed in Part 2 of the paper.
The parameters that were investigated in the full-scale experiments that affected the conditions within the fire compartment included:
1. Fire Size. The heat release rate of the fire is a primary parameter in the mass flow rate from the fire compartment and thus in the spill plume. Fires with total heat release rates of 500 to 5000 kW were included in the experimental program. A design fire size of 500 to 1000 kW has been suggested to cover most fire scenarios in sprinklered office buildings (Lougheed 1997; Madrzykowski, and Vettori 1992). Similarly, a design fire size of 2000 kW has been suggested to cover many fire scenarios in retail malls (Lougheed, McCartney and Taber 2001). Design guidelines such as NFPA 92B (NFPA 2005) and Morgan et al. (1999) suggest a design fire with a convective heat release rate of 5000 kW for sprinklered retail applications.
2. Compartment Opening Width. This is a primary parameter identified in all the methods for estimating the smoke flow rate for balcony spill plumes. Opening widths of 5.0, 7.5, 10 and 12 m were used in the experimental program. These dimensions are consistent with the physical model tests. For example, Morgan and Marshall (1975; 1979) used physical models for shops with opening widths of 7 and 14 m full-scale equivalent and Harrison ((2004) used a 6 m full-scale equivalent opening for the experiments with a downstand located at the spill edge.
3. Downstand Depth. A separate removable panel for every compartment opening width allowed compartment opening downstand depths of 0.0 and 1.6 m. These depths are arbitrary but consistent with dimensions that occur in real applications. They also match the scale model experiments conducted by Morgan and Marshall (1975; 1979). The effect of the downstand on the smoke flow under the balcony was also investigated using CFD simulations (Ko 2006; Ko et al. 2007).
In addition to these parameters, tests were conducted with and without a balcony attached to the
compartment and with and without draft curtains attached to the balcony. These parameters are discussed in Lougheed et al. (2006) and Lougheed et al (2007).
The experiments conducted with the widest compartment opening and no compartment opening downstand represent cases of a fire under a balcony. For these experiments, the compartment ceiling acts as a balcony section to give a total balcony depth of 5 m for tests without the balcony section and 9 m with the balcony.
The following experimental parameters were maintained constant throughout the experimental program to reduce costs and simplify the data analysis:
1. Fire Compartment Size. The size of the fire compartment was maintained constant. Compartment size is not a parameter considered in the balcony spill plume correlations. The correlation by Thomas (1987) does note that the compartment geometry may affect the amount of entrainment prior to the plume spilling into the atria and would need to be accounted for in the choice of the virtual origin. Also, Morgan et al. (1999) note that the size of the compartment can affect air entrainment into the fire plume inside the compartment. The compartment dimensions were approximately full-scale of those
used in the 1/10th scale physical model studies.
2. Fire Location. The fire source was located at the center of the fire compartment for all experiments. 3. Compartment Heat Transfer. The primary effect of the large compartment is the potential heat loss
to the boundaries, reducing the temperature of the airflow exiting through the opening and lowering its velocity and the resulting air entrainment. It was necessary to line the compartment ceiling, back wall and end walls with ceramic fiber insulation to provide protection for multiple fire tests. This material
has a low thermal conductivity, minimizing heat losses to compartment boundaries and maximizing the temperature and flow velocity of the smoke exiting the compartment. The metal panels used to change the opening width and height (downstand) were not insulated. These panels were galvanized steel. 4. Balcony Elevation. A single balcony height (5 m) was used for all experiments. This height is typical
of the maximum floor-to-floor height found in many commercial and retail buildings and provides a conservative result for the effect of the balcony height.
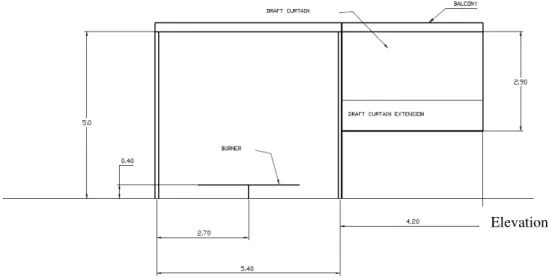
Elevation
Figure 1. Fire compartment.
Experimental Facility
In recent years, NRC has conducted joint research projects with ASHRAE related to atrium smoke management in an atrium facility (Lougheed et al. 1999; Lougheed, McCartney and Taber 2000; Lougheed, McCartney and Taber 2001). The atrium portion of the facility utilizes a section of the NRC Burn Hall facility with a footprint of 16.8 m by 30.5 m and a height of 12.2 m. A variable capacity smoke exhaust system was used to extract smoke from near the ceiling.
A 13.8 m wide by 5 m deep by 5 m high fire compartment with attached balcony was located near one end of the simulated atrium (Figure 1). The compartment was constructed using a steel frame lined with sheet steel protected using 25 mm thick ceramic fiber insulation. The front wall of the test compartment was modular in construction to allow for multiple opening widths. All removable sections forming the front wall of the fire compartment were constructed out of steel and were unlined. All openings were centered on the compartment centerline. A removable downstand 1.6 m in depth could be installed at the top of the opening.
The rear and side walls and ceiling of the compartment were lined with noncombustible ceramic fiber insulation to protect against repeated fire exposure. This material has low thermal conductivity, thus minimizing conductive heat losses through the compartment boundaries and maximizing the temperature and resulting flow velocity of the smoke exiting the compartment. The compartment floor was concrete. The floor area under the propane burner was protected using noncombustible ceramic fiber insulation.
A 4 m deep balcony was installed over the entire width of the fire compartment. The balcony was constructed of steel with negligible thickness. The underside of the balcony was flush with the ceiling of the fire compartment, allowing unimpeded flow of the exiting hot layer for tests without a downstand. The balcony was 5 m above the floor of the test facility and 7.2 m below the ceiling of the simulated atrium.
Previous investigations at NRC on atrium smoke management (Lougheed et al. 1999; Lougheed, McCartney and Taber 2000) have shown that large scale propane burner systems with dimensions of up to 3 m by 3 m are well-suited to conducting parametric studies since steady, measurable fire sizes can be maintained over extended durations. In this experimental program, a modular propane burner system was located at the center of the fire compartment at an elevation of 0.4 m. The propane was released from pipes forming three concentric squares with sides of 1, 2 and 3 m. Using this burner system, fires with areas of 1,
4 and 9 m2 could be produced. The physical size of the fire was varied depending on the heat release rate so
that the fire density, /area, was between 250 and 750 kW/m2. This range has been suggested as an
acceptable approximation for typical commercial and retail fire loads (Klote and Milke 2002; Morgan et al. 1999).
The propane volumetric flow rate was measured using rotameters to estimate the total heat release rate of the fire. Combined errors in the propane physical properties and the rotameter system gave a typical heat release rate error range of ±10%.
Instrumentation
Vertical thermocouple arrays were installed in the fire compartment. The thermocouple trees were located on the North-South centerline of the compartment. One tree was located at the compartment center above the propane burner. The other two thermocouple trees were located 3.5 m from the center of the compartment (mid-way between the center of the compartment and the end-walls). Six thermocouples were installed on each thermocouple tree. They were spaced at 500 mm intervals with the highest thermocouple at the ceiling.
Three vertical thermocouple arrays were located in the compartment opening. One thermocouple tree was located at the center of the opening. The two other thermocouple trees (North and South) were located mid-way between the center and sides of the opening. The North and South thermocouple trees were 1.25, 1.88, 2.5 and 3 m from the center of the opening for the experiments with 5, 7.5, 10 and 12 m wide openings, respectively.
For the tests without a downstand, the center opening thermocouple tree consisted of 12 thermocouples located 1.00, 1.75, 2.25, 2.75, 3.25, 3.50, 3.75, 4.00, 4.25, 4.50, 4.75 and 5.00 m above the floor. The North and South opening thermocouple trees each consisted of 8 thermocouples starting 0.25 m below the ceiling. The thermocouples were located 1.00, 1.75, 2.25, 2.75, 3.25, 3.75, 4.25 and 4.75 m above the floor.
For the tests with a downstand, the center thermocouple tree consisted of 11 thermocouples located 0.13, 0.63, 1.63, 1.88, 2.13, 3.38, 2.63, 2.88, 3.13 and 3.38 m above the floor. The North and South opening trees each consisted of 7 thermocouples located 0.13, 0.63, 1.13, 1.63, 2.13, 2.63 and 3.13 m above the floor.
All thermocouples were Type K without shielding or other types of radiation compensation; the assumed error in these devices is ±2˚C.
EXPERIMENTAL PROCEDURE
Eighty-five experiments were conducted with various combinations of compartment geometry and fire size. The standard experiment was conducted with a fixed heat output and compartment and simulated atrium geometry. During the experiment, the ventilation rate for the simulated atrium was varied by running the fan at 5 to 6 speeds (typically, 0, 12, 24, 36, 48 and 60 Hz). However, the variations in the fan speed affecting mainly the atrium smoke layer elevation and had a limited effect on the conditions in the fire compartment. The variations in fire size and compartment opening geometry (opening width and downstand) were the parameters that affected the conditions in the compartment.
Before each test, the compartment and simulated atrium geometry was set-up. Instruments were checked and calibrated if required and the exhaust system was set to the lowest flow rate. The data acquisition system was started approximately 60 s prior to ignition to collect ambient data. The data during the test was sampled at 2 s intervals. The propane burner system was ignited manually at a low level then increased to the planned heat release rate and maintained at this level until the end of the test.
FIRE COMPARTMENT RESULTS
This paper provides a discussion of the data analysis and experimental results for the fire compartment and the smoke flow through the compartment opening. The estimated mass flow rates through the compartment opening are also compared with results predicted using algebraic correlations.
Fire Compartment Temperatures
Three thermocouple trees were located in the fire compartment with one tree at the center of the compartment. The other two-thermocouple trees were located on the North-South centerline midway between the center of the compartment and the North and South compartment walls. The highest temperatures were measured by the thermocouples on the center tree, which is located at the center of the propane burner. The temperatures measured by the thermocouples located on the South thermocouple tree were slightly lower than those measured on the North thermocouple tree (Lougheed et al. 2006). This is most likely due to variations in airflow through the compartment opening.
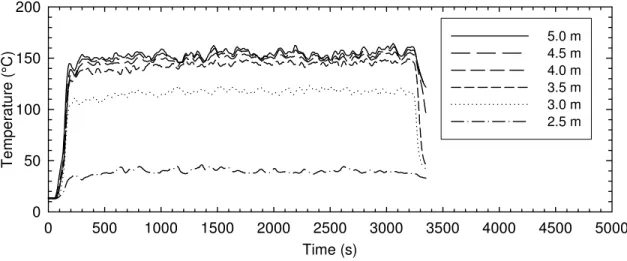
Time (s) 0 500 1000 1500 2000 2500 3000 3500 4000 4500 5000 T emp er at ur e ( °C) 0 50 100 150 200 5.0 m 4.5 m 4.0 m 3.5 m 3.0 m 2.5 m
Figure 2. Compartment temperatures south thermocouple tree for Test 10.
Figure 2 shows the temperature profiles measured at the South thermocouple tree for Test 10. Once the conditions reached steady state, there was limited variation in the temperatures measured in the fire compartment. To determine temperature profiles in the compartment, a mean temperature was determined between 1000 s and the end of the test. The average temperatures measured at the north and south thermocouple trees were averaged together to provide temperature profiles inside the compartment under steady-state conditions. This average temperature profile was found to be representative of the temperature profiles measured at the North and South thermocouple trees (Lougheed et al. 2006).
The temperatures were measured using bare thermocouples. The temperatures shown in Figure 2 were not corrected for radiation effects. A radiation correction method given by Janssens and Tran (1992) was used to correct for radiation effects on the average temperature in the fire compartment. The tests were conducted under different ambient conditions and the results were also adjusted to an ambient temperature of 20°C.
The radiation correction has minimal effect on the measurements at higher temperatures. The predominant effect is to decrease the temperature measured by the thermocouples at lower elevations. For most cases, the temperature measured by the lower thermocouples was reduced to near ambient conditions. The exceptions were three tests with the 5 m wide opening and a heat release rate of 4000 – 5000 kW. In these tests, the temperature for the lower thermocouple was overcompensated by approximately 20°C (Lougheed et al. 2006).
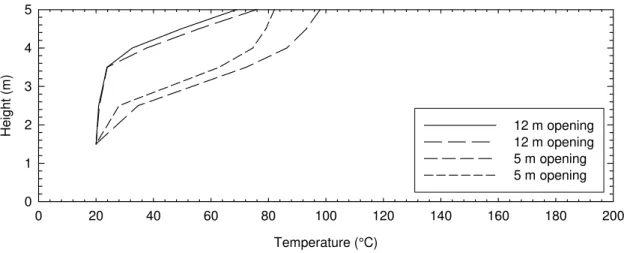
Temperature (°C) 0 20 40 60 80 100 120 140 160 180 200 Height ( m ) 0 1 2 3 4 5 12 m opening 12 m opening 5 m opening 5 m opening
Figure 3. Temperature profiles in the compartment for tests at 500 kW without downstand.
Temperature (°C) 0 20 40 60 80 100 120 140 160 180 200 Height ( m ) 0 1 2 3 4 5 12 m opening 7.5 m opening 5 m opening Downstand
Figure 4. Temperature profiles in the compartment for tests at 500 kW with downstand.
The temperature profiles for tests conducted at 500 kW are shown in Figures 3 and 4 for tests without downstand and a 5 and 12 m opening width and with a downstand and 5, 7.5 and 12 m opening width, respectively (Temperature profiles for other heat release rates are provided in Lougheed et al. (2006)). These results illustrate some of the general temperature trends determined from the results:
1. Wider opening results in a lower temperature smoke layer and higher interface height. For example, with the 500 kW tests, a 12 m wide opening and no downstand (Figure 3, Test 8), the smoke layer is limited to the upper 1 m (20%) of the compartment. This is consistent with the assumption that the minimum smoke layer depth is approximately 10% of the compartment height for the scenario with a compartment, which is open to a large space (Evans and Klote 2003). There can also be some deepening of the smoke layer depth with reflected flow from the compartment boundaries (NFPA 2005). In the experimental arrangement, there was a reflected flow from the back wall of the compartment.
2. For tests without a downstand, the measured temperature profile increased linearly with height. For a ceiling jet flow, a maximum temperature is expected near the ceiling with a lower temperature in the ceiling boundary layer. However, the spacing between the thermocouples was too large to measure this phenomenon.
3. The addition of the balcony resulted in a small increase in temperature and a decrease in the smoke interface height (see Figure 3, Test 4 without a balcony and Test 8 with a balcony). Also, the addition
of the draft curtains had a small effect on the compartment temperature (see Figure 3, Test 31 with the draft curtains and Test 39 without the draft curtains). The balcony and the draft curtains both restrict the smoke flow from the compartment resulting in a deeper smoke layer and higher temperatures. 4. The addition of the downstand resulted in a deepening of the smoke layer and an increase in the smoke
layer temperature (Figure 4). With the downstand, the temperature profile was more consistent with the two-zone approximation typically found in compartment fires.
5. An increase in heat release rate resulted in higher smoke layer temperatures and a deeper smoke layer.
Compartment Opening Temperatures
Temperatures were measured using three thermocouple trees located in the compartment opening. One tree was located at the center of the opening and two trees were located mid-way between the center of the opening and the North and South edge of the opening. Once the conditions reached steady state, there was
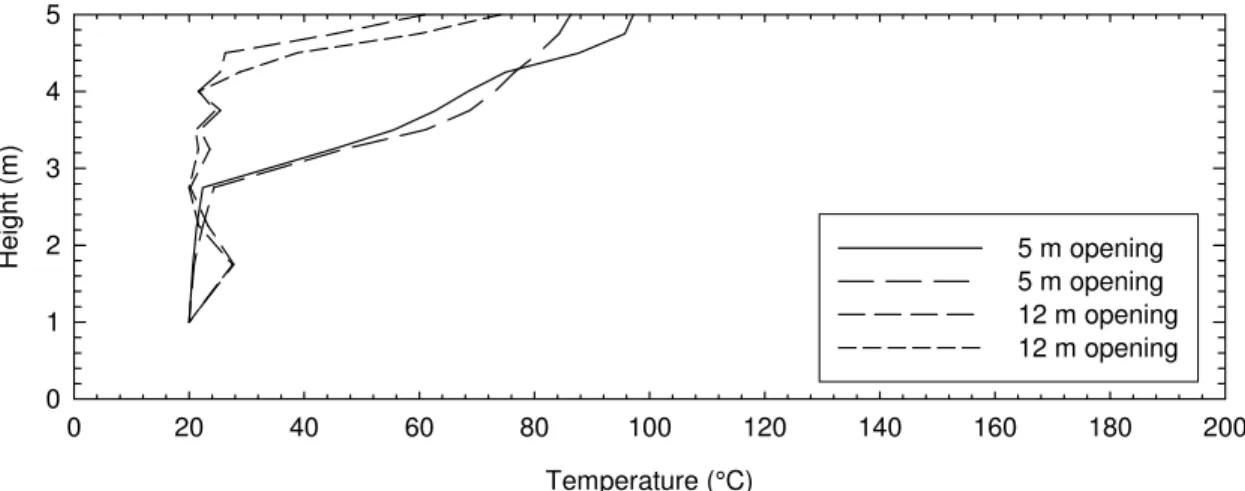
Temperature (°C) 0 20 40 60 80 100 120 140 160 180 200 Height ( m ) 0 1 2 3 4 5 5 m opening 5 m opening 12 m opening 12 m opening
Figure 5. Opening temperature profiles for tests at 500 kW without downstand.
Temperature (°C) 0 20 40 60 80 100 120 140 160 180 200 Height ( m ) 0 1 2 3 4 5 12 m opening 7.5 m opening 5 m opening Downstand
Figure 6. Opening temperature profiles for tests at 500 kW with downstand.
limited variation in the temperatures measured in the compartment opening. Temperature profiles were determined using the average temperature measured at each height between 1000 s and the end of the test.
The results indicated that there was minimal difference in the temperatures measured at the three locations even for tests conducted at 500 kW (Lougheed et al. 2006). This was the smallest heat release rate used for the experiments and would potentially have the largest variation in temperature along the length of the opening. However, the temperatures determined by averaging the results from the North and South tree
was comparable to those measured at the center of the opening. As a result, the temperature profile measured at the center of the compartment opening was assumed to be representative of the temperature profile over the width of the compartment opening. (Lougheed et al. 2006).
Temperature profiles at the center of the opening are shown in Figures 5 and 6 for tests without and with a downstand, respectively. Profiles measured for experiments with higher heat release rates are provided in Lougheed et al. (2006). The results shown in Figures 5 and 6 were corrected for radiation effects using the method provided by Janssens and Tran (1992).
The primary effect of the radiation correction is for the temperature measured at lower elevations with the minimum temperature near the floor reduced to near ambient. There were some secondary radiation effects in some cases, which resulted in elevated temperatures in the cold region for some tests. However, these variations were generally small (Lougheed et al. 2006).
The temperature profiles in the compartment opening varied depending on the compartment geometry: 1. For experiments without a downstand, there was a linear increase in temperature with height above the
smoke layer height with the highest temperature measured near the ceiling (Figure 5).
2. The depth of the smoke layer decreased for wider openings for experiments without a downstand with the depth for the 12 m openings consistent with the depth of the ceiling jet flow (Evans and Klote 2003).
3. For experiments with a downstand (Figure 6), there was a rapid increase in temperature with height below the downstand. The maximum temperature was measured just below the downstand.
Compartment Smoke Layer Height and Temperatures
The compartment and compartment opening temperature profiles were analyzed to determine the smoke layer interface height and the temperature increase. The smoke layer interface was determined using the N-Percent method assuming the temperature rise at the smoke layer interface was 10 percent of the maximum temperature rise occurring in the profile (Cooper et al. 1982). The difference between the maximum and minimum temperature in the profile was used as the temperature increase. The estimated layer heights and temperature differences for all experiments are provided in Lougheed et al. (2006).
A temperature increase of 10-20% has typically been used to define the base of the transition zone between the smoke layer and the cold layer (Cooper et al. 1982). The analysis by Morgan (1986) for horizontal flows indicates that the mass and convective flow through the compartment opening can be determined using analytical relationships, which are dependent on the smoke layer depth. Morgan’s relationships (1986) as well as the integral relationships upon which they were based are used in subsequent sections to estimate the mass and convective flow for the experiments. To maximize the estimated smoke layer depth and thus the mass flow estimates, the 10% temperature increase was used to determine the interface height.
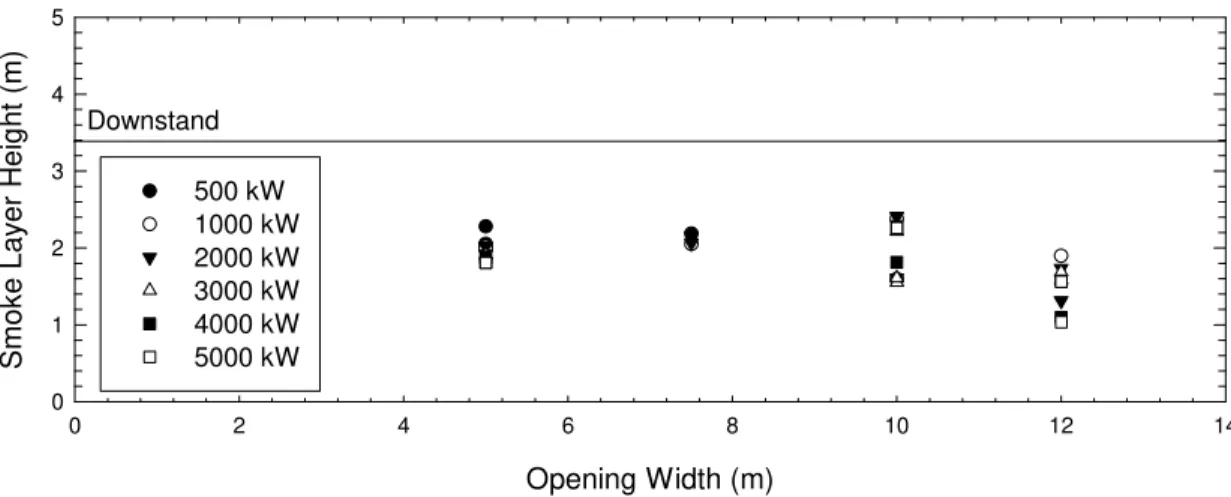
Figures 7 and 8 show the smoke layer height versus the opening width for tests with and without the downstand, respectively.
The smoke layer height (zl) measured in the compartment opening tended to be higher than that
measured inside the compartment (Lougheed et al. 2006). This was attributed in part due to the larger spacing used for the thermocouples on the trees inside the compartment (0.5 m) compared with the 0.25 m used in the opening. Also, the lower thermocouples inside the compartment may have been affected more by both convective flow and radiant heat from the fire. As a result, the transition between the lower cold region and the bottom of the transition zone was not as well defined inside the compartment compared with the compartment opening. The smoke layer levels determined in the compartment opening are more accurate estimates of the smoke layer height.
The maximum temperatures measured in the compartment opening were also higher than those determined inside the compartment (Lougheed et al. 2006). This was most likely due to the same effects, which resulted in the difference in smoke layer heights.
For the tests with the downstand (Figure 7), the results indicate that there were two different regimes for the smoke flow through the compartment opening. For the smaller openings (≤ 10 m), the smoke layer height increased with the increase in the opening width. Also, there was a rapid increase in the temperature starting at the smoke layer height and with peak temperature just below the downstand.
Opening Width (m) 0 2 4 6 8 10 12 14 Smok e La y e r H e ig h t (m) 0 1 2 3 4 5 500 kW 1000 kW 2000 kW 3000 kW 4000 kW 5000 kW Downstand
Figure 7. Smoke layer heights for tests with a downstand.
Opening Width (m) 0 2 4 6 8 10 12 14 Smok e La y e r H e ig h t (m) 0 1 2 3 4 5 500 kW 1000 kW 2000 kW 3000 kW 4000 kW 5000 kW
Figure 8. Smoke layer heights for tests without a downstand.
For the larger widths (≥ 10 m), the smoke layer height decreased for tests with heat release rates ≥ 1000 kW. The smoke layer depth with the 10 m opening depended on whether draft curtains were used under the balcony with a decrease in smoke layer height occurring in the tests without draft curtains. Also, for the tests with decreased smoke layer height, there was also a difference in the temperature profiles in the compartment and in the compartment opening. For these tests, the temperature increased linearly with height inside the compartment. The results suggest that for the wider openings the buoyant pressure above the downstand was sufficient to produce smoke flow through the compartment opening from above the downstand. With the narrower openings, there may be sufficient restriction to the flow through the opening to minimize the effect of the buoyant pressure above the downstand. For these tests, the temperature profiles in the compartment were comparable to that expected for a two-zone model. Further study is required to determine the parameters including the compartment size that affect flow through the opening and produce the two regimes.
For the tests without a downstand, a relatively deep smoke layer was formed under the ceiling for tests conducted with 5 and 10 m openings (Figure 8). The base of the smoke layer determined using the 10% temperature increase was between 50 and 60% of the compartment height. Above this level, there was a linear increase in the temperature profile to the ceiling (Lougheed et al. 2006).
For the limited tests conducted with the 12 m opening and no downstand, the smoke layer height was above 4 m (Figure 8). In this case, the smoke layer depth is consistent with the minimum depth produced by the ceiling jet flow (Evans and Klote 2003).
The results of the tests without the downstand indicate that relatively narrow walls defining a wide opening may restrict the flow through the opening resulting in a deepening of the smoke layer. However,
further research is required to determine the parameters including the compartment size that produce this phenomenon.
FIRE SIZE
Two important assumptions made in the analysis of the experimental results related to the fire size are complete combustion and radiative fraction. Although the propane mass flow rate to the burner system was measured, lack of oxygen in the fire compartment due to narrow compartment openings could cause incomplete combustion. The oxygen depletion method of determining fire heat release rates from gas concentrations in the smoke was intended to act as a check of the actual fire size. However, due to the dynamics of smoke filling in the simulated atrium, gas concentration measurements in the exhaust duct were unsuitable for use in the oxygen depletion method.
All the experiments were conducted with large openings in the fire compartment and the test facility. The smallest opening with the downstand was 5 m wide and 3.4 m high. Assuming a temperature increase of 550°C is required for flashover, only two experiments (Tests 49 and 50) with a 5000 kW heat output approached flashover conditions with temperature increases of approximately 500°C (Lougheed et al. 2006). For the majority of the tests, the temperature increase was less than 350°C. The fire sizes were, therefore, based on the assumption that all of the propane supplied to the burner system burned completely.
The radiative fraction, χ, represents the fraction of the total heat release rate, , which is emitted as
radiation rather than as convective heat to the smoke:
T Q& T c T rad Q Q 1 Q Q & & & & − = = χ (1)
Most correlations involving fire size use the convective heat release rate, , since this quantity
directly affects the smoke flow. Radiative fraction varies primarily with fuel type but is also affected by the completeness of the combustion process and other factors. A radiative fraction, χ, of between 0.30 and 0.35 is typically assumed for propane undergoing complete combustion. A constant value of χ = 0.30 was assumed for the fires used in the experimental program (Lougheed et al. 2006).
c
Q&
CONVECTIVE FLOW THROUGH THE COMPARTMENT OPENING
Morgan (1986) developed equations for the convective heat flow and mass flow through wide openings for horizontal flow of thermally buoyant smoke layers. In developing the equations, it was assumed that the time-averaged buoyancy profiles were geometrically the same at different points in the approach flow and at the virtual vena contracta. Using this assumption, integral equations can be written for the mass and convective flows in the hot layer. The integral equation for the convective flow at the opening is (Morgan (1986)): ∫ ρ θ = ds 0 p co zWv zC zdz Q& ( ) ( ) ( ) (2) where: co
Q& = convective heat flow through the opening (kW);
ds = depth of the smoke layer in the opening (m);
z = height above the neutral plane (m);
W = width of the opening (m);
Cp = specific heat (kJ/kgK);
ρ(z) = density at height z (kg/m3
);
v(z) = velocity at height z (m/s);
θ(z) = temperature increase at height z (°C).
2 1 z 0 o 3 d dz T T C z T g 2 z v ⎟⎟ ⎠ ⎞ ⎜ ⎜ ⎝ ⎛ θ = ( ) ∫ ) ( (3) where: g = gravity (9.81 m/s2); Cd = discharge coefficient; T(z) = temperature at height z (K); To = ambient temperature (K).
Equations 2 and 3 can be combined to give an integral relationship for the convective heat flow through the opening:
(
)
∫ ∫ ⎟⎟ ⎠ ⎞ ⎜⎜ ⎝ ⎛ ′ θ θ ρ = ds 0 2 1 z 0 2 1 o 2 3 d p o co dz dz T T 1 gT 2 WC C Q& (4)Using Equation 4, the experimental temperature profiles in the opening were used to estimate the convective heat flow from the compartment (Lougheed et al. 2006). This assumes that the flow is uniform over the width of the opening. The comparisons between the temperature profile measured at the center of opening and the average of the North and South profiles indicated there was minimal horizontal variation in the temperature at least in the central section of the opening.
The parameter that is not known in Equation 4 is the discharge coefficient, Cd. Morgan (1986) assumed
that the case with a deep downstand was analogous to the flow through a hole in a plate with Cd = 0.6. It
was also assumed that the case without a downstand was analogous to flow through a pipe with Cd = 1.0.
For a steady state flow and assuming energy balance, the convective flow through the opening can be assumed to be approximately equal to the convective heat release rate for the fire. There will be some differences due to conductive losses through the compartment boundaries. However, these boundaries were insulated and under steady state conditions the conductive losses should be minimal. Using this assumption, Equation 4 was used to estimate the discharge coefficient for each experiment. Estimates for
Cd were determined assuming radiative fractions of 20, 30 and 35%.
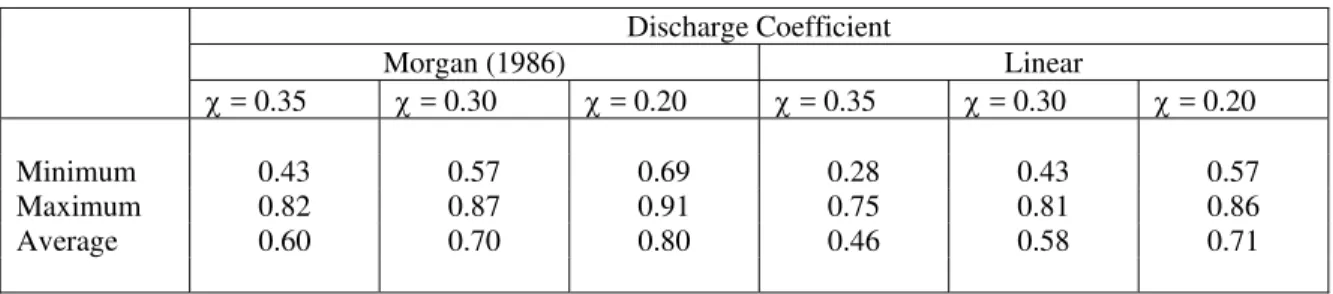
Table 1 gives the minimum, maximum and average discharge coefficients for all the experiments with the balcony. The estimated discharge coefficients are consistent with the 0.6 (Morgan 1986) and 0.7 (Steckler et al. 1983) assumed for a flow through an opening.
Table 1. Variation in discharge coefficient.
Discharge Coefficient Morgan (1986) Linear χ = 0.35 χ = 0.30 χ = 0.20 χ = 0.35 χ = 0.30 χ = 0.20 Minimum 0.43 0.57 0.69 0.28 0.43 0.57 Maximum 0.82 0.87 0.91 0.75 0.81 0.86 Average 0.60 0.70 0.80 0.46 0.58 0.71
Equation 4 is in the form developed by Morgan (1986) with the discharge coefficient, Cd, raised to the
3/2 power. This is different from other equations for estimating mass flow through an opening with a deep downstand (for example, Thomas et al. 1963; Steckler et al. 1983) in which the flow through the opening is assumed to be linear with the discharge coefficient. As used in this paper, the power used for the discharge coefficient in Equation 4 is not important since the parameter was used to provide a fit to the convective heat flow through the opening for use in estimating the mass flow rate. If it were assumed the flow through the opening had a linear dependence on the discharge coefficient, the calculated discharge coefficient would have a lower value equivalent to the 3/2 power of the estimates determined using Equation 4. The effect of assuming a linear dependence for the discharge on the minimum, maximum and average discharge coefficient is shown in Table 1. The results indicate that the average discharge coefficient estimated using χ = 0.3 is consistent with the literature values and the discharge coefficients estimated assuming a
convective heat component of 70% was used to estimate the mass flow rates through the compartment opening.
Comparable discharge coefficients were determined for the tests with and without a downstand in the compartment opening. The estimated discharge coefficient is consistent with the value assumed by Morgan (1986) for the scenario with a downstand. However, the results differ for the flat ceiling scenario. In this case, Morgan (1986) assumed that the flow was equivalent to the flow in a pipe with a discharge coefficient of 1. The present results indicate that by limiting the width of the compartment opening the discharge coefficient was decreased for the flat ceiling scenario. However, discharge coefficients of 1 were estimated for the tests without a balcony extension. These tests simulated a scenario with a fire under a balcony with the smoke flow directly from the fire area into the large volume space.
For all the tests with the balcony added to the fire compartment, the discharge coefficient was < 1. There was no systematic dependence on the test parameters (heat release rate, downstand and draft curtains). The variation in the estimates are most likely due to the variations in the temperature measurements and resulting estimates for the temperature profiles and smoke layer depth used in Equation 4.
The estimated discharge coefficient for experiments conducted without the balcony and the 12 m opening width were ≥ 1. In these tests, the smoke flow directly entered the simulated atrium space. These cases are representative of a fire under a short (12 m long) balcony with an aspect ratio (balcony depth/balcony length) of 0.42.
Without the balcony, the discharge coefficient was higher for the low (500 and 750 kW) heat release rate tests. This would suggest that the assumption of a uniform flow through the opening is questionable for these cases.
The above results suggest that two regimes can occur for scenarios with fires under balconies:
1. For high heat release rates and high balcony aspect ratio scenarios, the smoke flow will be uniform over the length of the balcony. The length of the spill plume entering the large volume space is equivalent to the length of the balcony. As indicated in the discussion of the temperature profiles in the compartment opening, the smoke layer below the ceiling will be comparable to the thickness of the ceiling jet (Evans and Klote 2003).
2. For low heat release rate and low balcony aspect ratio, the smoke flow will be non-uniform over the length of the balcony. With increasing balcony length, there should be a limit to the length of the plume that spills into the atrium.
MASS FLOW THROUGH THE COMPARTMENT OPENING
Morgan (1986) also provided an integral equation for the mass flow through an opening:
(
)
∫ ∫ ⎟⎟ ⎠ ⎞ ⎜⎜ ⎝ ⎛ θ ′ ρ = ds 0 2 1 z 0 2 1 o 2 3 d o e dz dz T T 1 gT 2 WC m& (5) where: em& = mass flow through compartment opening (kg/s);
ds = depth of the smoke layer in the opening (m);
z = height above the neutral plane (m);
W = width of the opening (m);
θ(z) = temperature increase at height z (°C).
g = gravity (9.81 m/s2);
Cd = discharge coefficient;
T(z) = temperature at height z (K);
To = ambient temperature (K);
Equation 5 was used to estimate the mass flow through the opening for the experiments. For these calculations, the discharge coefficient estimated assuming a 70% convective heat flow was used. The estimated mass flow rates through the opening are provided in Lougheed et al. (2006).
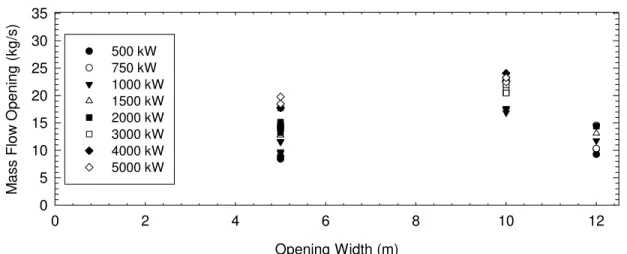
Figures 9 and 10 show the mass flow rate through the opening estimated using Equation 5 for the tests with and without a downstand, respectively. Some general trends are as follows:
1. For most cases, the mass flow rate increases with the width of the opening and with increased heat release rate.
2. Figure 9 includes tests conducted without a balcony (12 m opening) and with the 12 m opening with the balcony added without draft curtains. The estimated flow rate for these cases are comparable to those estimated for the same heat release rate with the 5 m opening.
3. The variation in mass flow rate with increased heat release rate is minimal for tests with the downstand except for tests with the 12 m wide opening (Figure 10).
Opening Width (m) 0 2 4 6 8 10 12 M a s s F low O p en in g (k g /s) 0 5 10 15 20 25 30 35 500 kW 750 kW 1000 kW 1500 kW 2000 kW 3000 kW 4000 kW 5000 kW
Figure 9. Mass flow rate for experiments without a downstand.
Opening Width (m) 0 2 4 6 8 10 12 M a s s F lo w O p e n in g (kg/ s ) 0 5 10 15 20 25 30 35 500 kW 750 kW 1000 kW 1500 kW 2000 kW 3000 kW 4000 kW 5000 kW
Figure 10. Mass flow rate for experiments with a downstand.
Morgan (1986) also integrated Equation 5 assuming a linear smoke layer velocity profile to provide an approximate equation for the mass flow through the opening:
(
)
2 M 3 s o 2 3 d 2 1 o morgan d T W C gT 2 3 2 m = θ ρ κ max max & (6)where:
morgan
m& = approximate mass flow through compartment opening (kg/s);
ds = depth of the smoke layer in the opening (m);
W = width of the opening (m);
θmax = maximum temperature increase in smoke layer (°C).
g = gravity (9.81 m/s2);
Cd = discharge coefficient;
Tmax = maximum temperature increase in the smoke layer (K);
To = ambient temperature (K);
ρo = density of air (kg/m3)
κM = flow coefficient typically 1.3.
The variables in Equation 6 are the width of the opening and the maximum temperature and the maximum temperature difference at the compartment opening. Mass flows through the opening were also estimated using Equation 7 and are provided in Lougheed et al. (2006). The results obtained using the approximate equation were typically comparable to the results obtained by integrating the experimental data. The highest differences were for tests with a high heat release rate, small opening width and with a downstand in the compartment opening (Lougheed et al. 2006).
The differences between the two results may be due to the selection of the flow coefficient, κM, which
is dependent on the temperature profile for the smoke flow. The value ranges from 1 for a flow with uniform temperature to 1.7 for a flow with a linearly increasing temperature. Morgan (1986) suggests a value of 1.3 for intermediate smoke flows that have profiles that initially increase linearly with height
combined with a uniform section at higher elevations. A κM value of 1.3 was used for all the calculations in
Lougheed et al (2006). However, for tests with high heat release outputs and narrow openings, there was a very rapid increase in temperature with height combined with a region of uniform temperature below the
downstand. For these cases, a κM value of 1 would be appropriate.
MODELING MASS FLOW THROUGH THE COMPARTMENT OPENING
There are a number of approaches that can be used to estimate the smoke layer properties and the mass flow through the compartment opening. These include analytical equations, zone and CFD models. In this section, analytical approaches are used to provide estimates for the mass flow through the compartment opening and the results compared with experimental data.
CIBSE Relationship
CIBSE (1995) provides an algebraic relationship that can be used to estimate the horizontal mass flow from an opening in a room containing a fire:
o 3 1 2 c e 009Q W h m& = . (& ) (7) where e
m& = mass flow out of the compartment (kg/s)
c
Q& = convective heat release rate (kW);
W = width of compartment opening (m);
ho = height of compartment opening (m).
Equation 7 was based on data collected by Law and the data from Hansell et al. (1993). The general form of the equation is the same as that used for the balcony spill plume relationships developed by Law (1986; 1995).
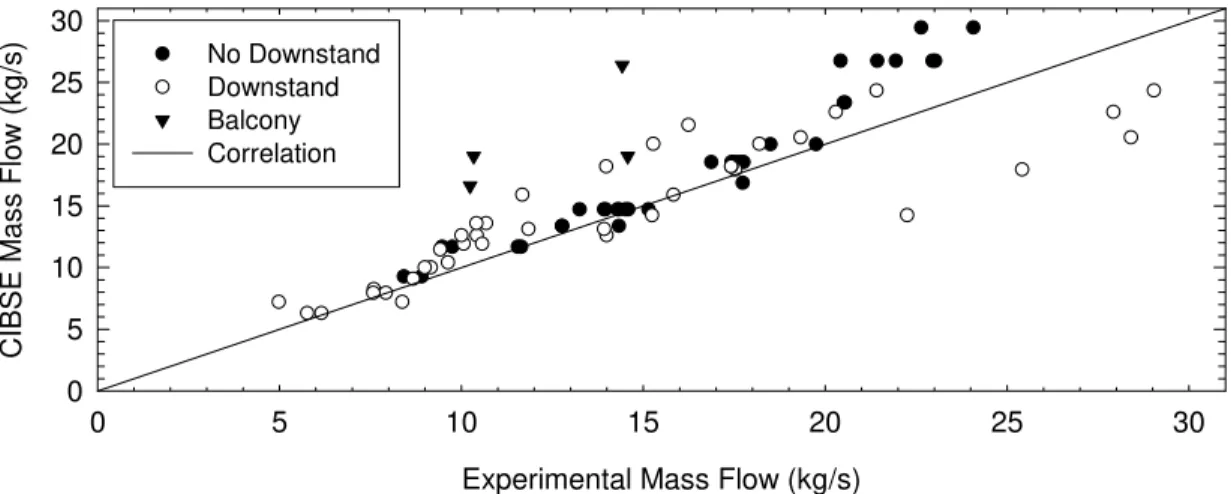
Figure 11 compares the mass flow rates through the compartment opening estimated using Equation 7 with the experimental results. The estimated mass flow rates determined using the CIBSE relationship used
ho = 5 m for the scenarios without a downstand and ho = 3.4 m for the cases with a downstand.
For the tests without a downstand, the CIBSE relationship provides a conservative estimate for the mass flow through the opening. There are only three cases in which the experimental results exceeded the mass flow estimated using Equation 7. All these cases were for tests with a 5 m opening and the highest difference was approximately 6%.
The CIBSE relationship provided the best estimates for low to medium heat release rate scenarios (500 – 2000 kW). The comparisons were not as good for high heat release scenarios.
The CIBSE relationship provided a conservative estimate for most of the tests with the downstand. The major exception was the tests with 12 m opening. In this case, the empirical relationship underestimated the mass flow through the opening. In some cases, the mass flow approached that obtained for the test without a downstand.
Experimental Mass Flow (kg/s)
0 5 10 15 20 25 30 CIBS E M as s Flow ( k g /s ) 0 5 10 15 20 25 30 No Downstand Downstand Balcony Correlation
Figure 11. Comparison of CIBSE mass flow rates with experimental results.
The results for the scenarios with the wide opening are consistent with the earlier discussions on temperature profiles and smoke layer depth. For these cases, there was sufficient buoyant pressure in the upper layer to produce additional smoke flow through the compartment opening.
A comparison for a limited number of experiments is shown for the balcony scenario. In this scenario, the CIBSE relationship overestimates the mass flow by up to 50%.
The CIBSE relationship provided a conservative estimate for the mass flow rate through the opening. However, it did underestimate the mass flow rate for the scenario with a downstand and a wide opening (12 m). It should be used with caution for such scenarios.
BRE Relationship
Morgan et al. (1999) give an algebraic relationship for estimating the mass flow through the compartment opening (Equation 8).
2 3 3 2 e d 3 2 2 3 o e e 2 P C C 1 w Pwh C m ⎥ ⎥ ⎦ ⎤ ⎢ ⎢ ⎣ ⎡ ⎟ ⎠ ⎞ ⎜ ⎝ ⎛ + = & (8) where: e
m& = mass flow rate through the compartment opening (kg/s);
w = width of the compartment opening (m);
ho = height of the compartment opening (m);
P = perimeter of the fire (m);
Ce = entrainment constant with value of 0.19 for large-area rooms in which air will be entrained from
all sides of the fire, 0.21 for large-area rooms in which the ceiling is close to the fire and 0.34 for small rooms in which ventilation is provided primarily through an opening on one side of the
fire (kg/m5/2s);
Cd = flow coefficient for compartment opening with a value of 1 if there is no downstand or 0.6 with
The entrainment coefficient, Ce, accounts for the effects of compartment size on the air entrainment within
the compartment. For smaller compartments, the flow of ventilation air into the compartment can tilt the plume and increase mixing of air into the hot layer resulting in an increased air entrainment (Quintiere et al. 1981; Morgan et al. 1999).
Equation 8 was used to estimate the mass flow through the opening. Two methods were used to estimate the fire perimeter used in the BRE mass flow relationship: 1) the perimeter of the burner used for the test, and 2) a revised perimeter assuming a heat release rate per unit area of 500 kW. For the calculations, the discharge coefficient was 0.6 and 1 for the scenarios with and without downstand, respectively. These were the discharge coefficients assumed in the development of the empirical equation
(Morgan et al. 1999). The entrainment coefficient, Ce, was 0.34 kg/m5/2s for the compartment fire scenario.
This is the value given by Morgan et al. (1999) for small rooms. For the balcony scenario, an entrainment
coefficient of 0.21 kg/m5/2s was used.
For the scenarios without the downstand, Equation 8 provided a conservative estimate of the mass flow through the opening. However, the calculated mass flow rates using the actual burner perimeter were very conservative (>80%) for tests with a low heat release rate density (Lougheed et al. 2006). Revised mass flow rates were calculated using a fire perimeter estimated assuming an effective area for the fire based on
a heat release density of 500 kW/m2. This still provided conservative estimates for the mass flow rate with
the maximum difference between the estimated and experimental results of 42% (Lougheed et al. 2006).
Experimental Mass Flow (kg/s)
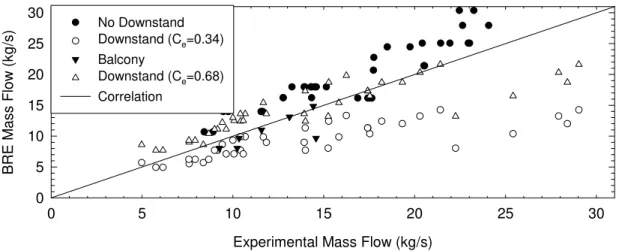
0 5 10 15 20 25 30 BRE M ass F lo w ( k g /s) 0 5 10 15 20 25 30 No Downstand Downstand (Ce=0.34) Balcony Downstand (Ce=0.68) Correlation
Figure 12. Comparison of BRE mass flow rates with experimental results.
Figure 12 shows a comparison of the estimated and experimental mass flow rates using the fire perimeter based on the fire density. For the balcony and no downstand scenarios, the algebraic equation does provide reasonable but conservative estimates of the mass flow rate through the compartment opening. For the balcony scenario, the mass flow rate estimates using Equation 8 used an entrainment coefficient of
0.21 kg/m5/2s, which is the value assumed by Morgan et al. (1999) for a large room with a low ceiling.
Equation 8 does not provide a conservative estimate of the mass flow through the compartment
opening for the scenario with a downstand using an entrainment coefficient of 0.34 kg/m5/2s. As with the
CIBSE relationship, the estimated mass flow rate for the experiments with high heat release rates and wide openings are particularly low compared with the experimental results.
A more conservative estimate of the mass flow rate can be obtained by increasing the entrainment coefficient. A comparison of estimates assuming an entrainment coefficient 0f 0.68 with experimental results is shown in Figure 12. The high increase in the coefficient is required primarily to improve the estimates for the scenario with a wide opening. A more detailed analysis is required to determine the effect of the parameters on air entrainment in the compartment and the mass flow through the opening.
The BRE relationship (Equation 8) provided a conservative estimate for the mass flow rate through the opening for the no downstand and the balcony scenario. However, it underestimates the mass flow rate for the scenario with a downstand using the small compartment entrainment coefficient. A more conservative estimate can be obtained for this scenario using a higher value for this coefficient. However, this empirical equation did not provide a conservative estimate for the scenarios with a wide opening (12 m) and high heat release rates. It should be used with caution for such scenarios.
CONCLUSIONS
There have been a number of concerns regarding the balcony spill plume equations provided in North American standards and codes. These include: lack of verification by full-scale experiments and application of the equation for high atria even though it was developed for low-height atria. As a result of these concerns, ASHRAE initiated a project to evaluate the balcony spill plume equation used in North American codes and standards (RP-1247). The research project included CFD modeling studies to investigate smoke entrainment in the balcony area and smoke entrainment in high atria. However, the primary portion of the research for RP 1247 was a series of full-scale experiments conducted to investigate smoke flow in balcony spill plumes and the resulting mechanical exhaust requirements for an atrium. The full-scale experiments included measurements inside the fire compartment and in the opening between the fire compartment and the balcony area. It also included measurements in a simulated atrium space, which are discussed in Part 2 of this paper (Lougheed et al. 2007).
The balcony spill plume scenario has primarily been investigated using 1/10th scale physical models.
The full-scale experiments conducted for RP-1247 is the first time that an extensive series of full-scale experiments have been used to investigate the effect of the various parameters on air entrainment into a balcony spill plume. These experiments also provided data on the effect of the opening width, the presence or absence of a downstand and the fire size on the conditions within the fire compartment and in the compartment opening.
Most of the experimental data for compartment fires has been developed using facilities with small (0.9 m wide by 2 m high) openings (for example, Steckler et al. 1983). The experiments conducted for this project provide results for wider openings (5 – 12 m) typical of those that are found in commercial buildings.
In this paper, the effects of the three parameters on the temperature and smoke layer height in the compartment and in the compartment opening are summarized. Some of the general trends were as follows: 1. Wider openings result in a lower temperature smoke layer and higher interface height. For low heat
release tests with wide openings, the smoke layer was limited to the upper 1 m (20%) of the compartment. This is consistent with the assumption that the minimum smoke layer depth is approximately 10 - 20% of the compartment height (Evans and Klote 2003; NFPA 2005).
2. For tests without a downstand, the measured temperature profile increased linearly with height. 3. The addition of the downstand resulted in a deepening of the smoke layer and an increase in the smoke
layer temperature. With the downstand, the temperature profile was consistent with the two-zone approximation typically found in compartment fires. For these tests, there was a rapid increase in temperature at approximately mid-height of the compartment.
4. For scenarios with high heat release rate fires, downstand and wide openings, there were experiments in which the temperature inside the compartment increased linearly with height. The results suggest that for the wider opening the buoyant pressure above the downstand was sufficient to produce smoke flow through the compartment opening from above the downstand.
5. An increase in heat release rate resulted in higher smoke layer temperatures and a deeper smoke layer. The temperature profiles measured in the compartment opening were used to estimate the discharge coefficient for the smoke flow through the compartment opening using an integral equation provided by Morgan (1986). The discharge coefficient estimated assuming a convective heat flow of 65 – 70% of the total heat release rate gave average discharge coefficients of 0.6 – 0.7 for the compartment fire scenario with and without a downstand. These values are typical of those found in the literature for flow through an opening with a downstand. However, it is lower than the value of 1.0 that has been typically used for the scenario without a downstand.
For the limited number of tests for a balcony fire scenario in which there was direct smoke flow into the simulated atrium space, the discharge coefficient was ≥ 1.0. The higher values were for experiments with low heat release rate fires for which the assumption that the smoke flow was uniform over the width of the opening is likely not valid.
The experimental discharge coefficients and the temperature profiles in the compartment opening were used with an integral equation developed by Morgan (1986) to estimate the mass flow through the opening.
The experimental mass flow rates were compared with estimates determined using two algebraic equations published by CIBSE and BRE. The CIBSE relationship provided a conservative estimate for the mass flow rate through the opening. However, it underestimated the mass flow rate for the scenario with a downstand and a wide opening (12 m). It should be used with caution for such scenarios.
The BRE relationship (Equation 8) provided a conservative estimate for the mass flow rate through the opening for the no downstand and the balcony scenarios. However, it underestimated the mass flow rate for the scenario with a downstand using the small compartment entrainment coefficient. A more conservative estimate can be obtained for this scenario using a higher value for this coefficient. However, this empirical equation did not provide a conservative estimate for the scenarios with a wide opening (12 m) and high heat release rates. It should be used with caution for such scenarios.
REFERENCES
CIBSE. 1995. Relationships for smoke control calculations, Technical Memoranda TM19:1995, London, UK: Chartered Institution of Building Services Engineers.
Cooper, L., Harkleroad M., Quintiere J. and Rinkinen W. 1982. An Experimental Study of Upper Hot Layer Stratification in Full-Scale Multiroom Scenarios, Journal Heat Transfer, 104, p. 741-749.
Evans, D.H. and Klote, J.H. 2003. Smoke Control Provisions of the 2000 IBC: An Interpretation and Applications Guide, Country Club Hill, IL: International Code Council.
Ghosh, B.K. 1997. Fires in Real Scenarios, International Symposium on Fire Science and Technology, New Trends of Fire Technology towards the 21st Century, Korean Institute of Fire Science & Engineering, Seoul, Korea.
Hansell, G.O., Morgan, H.P. and Marshall, N.R. 1993. Smoke flow experiments in a model atrium. BRE Occasional Paper OP55, Borehamwood, UK: Building Research Establishment.
Harrison, R. 2004. Smoke Control in Atrium Buildings: A Study of the Thermal Spill Plume, Fire Engineering Research Report 04/1, Christchurch, NZ: University of Canterbury.
IBC. 2003. International Building Code. Falls Church, VA: International Code Council, Inc. IBC. 2006. International Building Code. Falls Church, VA: International Code Council, Inc.
Janssens, M.L. and Tran, H.C. 1992. Data Reduction of Room Tests for Zone Model Validation, Journal of Fire Sciences, 10, p. 528-555.
Klote, J.H. and Milke, J.A. 2002. Principles of Smoke Management, Atlanta, GA: American Society of Heating, Refrigerating and Air-Conditioning Engineers.
Ko, Y.J. 2006. CFD Study of the Balcony Spill Plume: Focused on the Balcony Area, Master of Engineering in Civil Engineering Thesis, Ottawa, ON: Carleton University.
Ko, Y.J., Hadjisophocleous, G. and Lougheed, G. 2007. CFD Study of the Air Entrainment of Balcony Spill Plumes at the Balcony Edge, ASHRAE Transactions, to be published.
Law, M. 1986. A Note on Smoke Plumes from Fires in Multi-Level Shopping Malls, Fire Safety Journal, 10, p. 197-202.
Law, M. 1995. Measurements of balcony smoke flow, Fire Safety Journal, 24, p. 189-195.
Lougheed, G.D. 1997. Expected size of shielded fires in sprinklered office buildings, ASHRAE Transactions, 103, (Part 1), p. 395-410.
Lougheed, G.D., Hadjisophocleous, G.V., McCartney, C. and Taber, B.C. 1999. Large-scale physical model studies for an atrium smoke exhaust system, ASHRAE Transactions, 105, (Part 1), p. 676-698. Lougheed, G.D., McCartney, C., Taber, B.C. 2000. Smoke movement for sprinklered fires, ASHRAE
Transactions, 106, (Part 1), p. 605-619.
Lougheed, G.D., McCartney, C., Taber, B.C. 2001. Sprinklered mercantile fires, ASHRAE Transactions, 107, (Part 1), p. 730-743.
Lougheed, G.D., Gibbs, E. and McCartney, C.J. 2007. Balcony Spill Plumes: Full-Scale Experiments, Part 2, ASHRAE Transactions, to be published.
Lougheed, G.D., McCartney, C.J and Gibbs, E. 2006. Balcony Spill Plumes, Final Report Research Project 1247, Ottawa, Ontario: National Research Council.
Madrzykowski, D. and Vettori, R. 1992. A Sprinkler Fire Suppression Algorithm. Journal of Fire Protection Engineering. 4, p. 151-164.
Marshall N. R. and Harrison R. 1996. Experimental studies of thermal spill plumes. Building Research Establishment Occasional Paper, OP1, Borehamwood, UK: Building Research Establishment.