Publisher’s version / Version de l'éditeur:
Vous avez des questions? Nous pouvons vous aider. Pour communiquer directement avec un auteur, consultez la
première page de la revue dans laquelle son article a été publié afin de trouver ses coordonnées. Si vous n’arrivez pas à les repérer, communiquez avec nous à PublicationsArchive-ArchivesPublications@nrc-cnrc.gc.ca.
Questions? Contact the NRC Publications Archive team at
PublicationsArchive-ArchivesPublications@nrc-cnrc.gc.ca. If you wish to email the authors directly, please see the first page of the publication for their contact information.
https://publications-cnrc.canada.ca/fra/droits
L’accès à ce site Web et l’utilisation de son contenu sont assujettis aux conditions présentées dans le site
LISEZ CES CONDITIONS ATTENTIVEMENT AVANT D’UTILISER CE SITE WEB.
Client Report (National Research Council of Canada. Institute for Research in Construction), 2010-05-26
READ THESE TERMS AND CONDITIONS CAREFULLY BEFORE USING THIS WEBSITE.
https://nrc-publications.canada.ca/eng/copyright
NRC Publications Archive Record / Notice des Archives des publications du CNRC : https://nrc-publications.canada.ca/eng/view/object/?id=96f213ec-a2f1-4500-935b-c5f5e7e278a1 https://publications-cnrc.canada.ca/fra/voir/objet/?id=96f213ec-a2f1-4500-935b-c5f5e7e278a1
NRC Publications Archive
Archives des publications du CNRC
For the publisher’s version, please access the DOI link below./ Pour consulter la version de l’éditeur, utilisez le lien DOI ci-dessous.
https://doi.org/10.4224/20375062
Access and use of this website and the material on it are subject to the Terms and Conditions set forth at
Leakage Management for Water Distribution Infrastructure: Results of DMA Experiments in Regina, SK.
N a t i o n a l R e s e a r c h C o u n c i l C a n a d a
Le a k a ge M a na ge m e nt for Wa t e r Dist ribut ion
I nfra st ruc t ure – Re port 1 : Re sult s of DM A
Ex pe rim e nt s in Re gina , SK
O s a m a
H u n a i d i
EXECUTIVE SUMMARY
Leakage in municipal water pipe networks is a significant problem that has economic, environmental, legal, social and political consequences. Most
municipalities need to manage leakage in their pipe networks. The need to do so became more urgent in recent years due to water shortages caused by recent draughts; increasing demand; environmental, social and political pressures; escalating energy cost and looming regulatory requirements.
Leakage management generally involves water audits, leak detection or monitoring, pressure control, and leak location and repair. In extreme cases, it may involve pipe rehabilitation or replacement. Water audit procedures are well
established, e.g., the IWA standard audit which was implemented for Regina in this study using a GIS-based software system. Pressure reduction is rarely used for leakage management in Canada. This will likely not change, at least in the near future, because of concerns about meeting fire fighting requirements; potential revenue loss; high maintenance of pressure control equipment and long-term effectiveness of pressure control. Municipalities are able to locate most leaks successfully using acoustic equipment, e.g., electronic listening devices and correlators that advanced dramatically in recent years.
Most municipalities in Canada that have active leak detection policies utilize periodic acoustic surveys to detect leakage in pipe networks; very few municipalities use district-metered areas (or DMAs) to detect or monitor leakage. In recent years, encouraged by the widespread use and success of DMAs in the United Kingdom, an increasing number of municipalities are considering DMAs. However, it’s not known if present DMA practice is directly applicable to municipal water pipe networks in Canada.
Several important components currently used in DMA flow analysis were based on data collected primarily from water pipe networks in the U.K. and Germany and their applicability to Canadian networks was uncertain. Pipes in Canada are larger in diameter and therefore are expected to have different background losses,
leak frequencies and flow rates. In addition, patterns of night water demand in Canada are believed to be different from European patterns due to differences in population life style and residential plumbing.
The objective of this study was to develop enhanced leakage management methods for municipal water pipe infrastructure in Canada, with emphases on the district metered-area method. The study involved extensive fieldwork in Ottawa and Regina under controlled conditions to determine residential night demand,
background and recoverable leakage rates, and effect of pipe pressure on leakage; and to evaluate analytical procedure(s) for component identification of DMA night flow. Planned fieldwork in Halifax could not be performed due to administrative difficulties at NRC.
Experimental DMAs were set up in two areas in Regina that were
representative of the city’s dominant pipe types. These included: (i) a large ~2100 service connections asbestos-cement pipe DMA in the Whitmore Park/Hillsdale area in the southern part of the city, and (ii) a ~400 service connections PVC pipe DMA in the Gardiner Heights area in the eastern part of the city. Experimental fieldwork was carried out in 2006 and 2007. Following are the main findings and conclusions.
Average residential night water demand was much higher than the estimate of 1.7 L/household/h used in current practice. Demand varied significantly during the night and depended on season and area. In the AC pipe DMA, measured demand was 3.5 to 8 times the current estimate. Average demand was 7.34, 6.05 and 8.8 L/household/h in winter, spring and lawn-watering season, respectively. In the PVC pipe DMA, demand was even higher, 5 to 9 times the estimate used in current practice. Average demand was 9.8 and 12.8 L/household/h in winter and the lawn-watering season, respectively.
High residential night demand was due to widespread use of water softeners in Regina. Variation in night demand was due to lawn watering at night and perhaps the custom of leaving a water tap running slowly to prevent freezing of service connection pipes on very cold nights in winter.
For reliable estimation of leakage levels under Regina’s condition of high and variable night demand, it’s imperative that residential demand be measured using AMR simultaneously with water flow into DMAs.
It was difficult to determine background leakage levels in small AC and PVC pipe areas based the minimum flow rate method as well as the water volume balance method. This was due to high water demand throughout the night by water softeners and due to insufficient resolution of readings of Neptune ProRead meters, which about 5% of residences had.
Still, the background leakage rate was obtained using the water volume balance method for AC pipes and it was 1.21, 1.65 and 2.02 L/connection/h at 28.2, 55 and 69.2 psi average pipe pressure. Best-fit power relationship was
55 . 0 Background 0.1896 P
L = × , where leakage is in L/connection/h and pressure is in psi. The
exponent of this power relationship is significantly lower than the 1.5 exponent used in current practice. Background leakage rates could not be measured reliably for the PVC pipe DMA.
Background leakage rates both in Regina and Ottawa were best predicted by the following equation:
(
)
N1 c p c m 71 P N L 15 C N B L A leakage background Night ⎟ ⎠ ⎞ ⎜ ⎝ ⎛ × × × ÷ + × + × = , in L/hwhere P is average pipe pressure in psi; N1 is equal to 0.55, 1.11, 1.35 and 1.5 for
asbestos cement, ductile iron, cast iron and PVC pipes respectively; Lm is total
length of distribution pipes in km; Nc is total number of service connections; Lp is
average length in metres of service connection pipes between curb stops and customer water meters; and A, B and C are constants equal to 24 L/km/h, 1.5 L/connection/h and 0.4 L/connection/hour corresponding to rates of leakage
components at 71 psi (50 metres) pressure in distribution mains, service connection pipes from mains to curbstops and 15-metre long service connection pipes after
curbstops, respectively. N1 for PVC pipes was not measured in this study but is
Due to high residential demand in Regina and its significant variation during the lawn-watering season, recoverable leakage could only be reliably established from a balance of water volumes of DMA supply, background leakage and AMR measured residential demand. Measurement and analysis procedures are suggested in this study for both temporary and permanent DMAs.
The rate of recoverable leakage in the AC DMA almost followed a square-root
relationship with pipe pressure (N1 was equal to ~0.56). At the average normal
operating pressure of ~62 psi it was ~477 litres per minute. Total leakage level, including losses from background leaks, represented 29% of water supplied to the DMA. Extrapolating the leakage rate measured in the AC DMA in this study to other AC pipe areas in the city, the citywide total leakage level was estimated to be 19.4%, which is close to estimates obtained from recent water audits.
Detailed procedures were presented for setting up either temporary or permanent DMAs to estimate recoverable leakage rate.
Analytical identification of the components of night flow was deemed
unsuitable for conditions in Regina because of the significant variation in residential demand during the night and from night to night because of the widespread use of water softeners in the city. The system of linear equations utilized to analytically identify components of night flow is very sensitive to very small variations in
residential demand and to a lesser degree to N1 exponents.
Fieldwork in Ottawa to compare different leak detection strategies could not be performed. Instead, description of different acoustic leak detection strategies, discussion of their pros and cons, and reported experiences with their performance were presented. In addition, interesting results emerged from acoustic listening and correlation surveys that were undertaken to determine the source of high leakage detected in the cast iron and asbestos-cement pipe DMAs in Ottawa and Regina, respectively.
TABLE OF CONTENTS
Page
EXECUTIVE SUMMARY ... i
ACKNOWLEDGMENTS ... vii
LIST OF TABLES ... viii
LIST OF FIGURES ... x
LIST OF SYMBOLS ... xiii
1 INTRODUCTION ... 1
2 OBJECTIVE ... 4
3 SCOPE ... 4
4 OVERVIEW OF LEAKAGE MANAGEMENT ... 5
5 DESCRIPTION OF TESTS ... 8
Test Sites ... 8
Setup of DMA ... 9
Instrumentation and Software ... 12
Measurement and Analysis Procedures ... 14
6 RESULTS AND OBSERVATIONS ... 18
Residential Night Demand ... 18
Background Leakage ... 20
Recoverable Leakage (May 2006) ... 23
Recoverable Leakage (May 2007) ... 25
Leakage-Pressure Relationship ... 33
Analytical Identification of Flow Components ... 34
7 DISCUSSION ... 34
Residential Night Demand ... 34
Background Leakage ... 36
Recoverable Leakage Rate... 39
Pressure-Leakage Relationship ... 41
Analytical Identification of Flow Components ... 42
TABLE OF CONTENTS (CONT’D)
Page
8 SUGGESTED ESTIMATES AND PROCEDURES ... 47
Residential Night Demand ... 47
Background Leakage ... 48
9 CONCLUSIONS ... 53 REFERENCES ... 59 APPENDIX A: ACOUSTIC LEAK DETECTION STRATEGIES ... 116 APPENDIX B: A GIS-BASED SOFTWARE SYSTEM FOR IWA’S WATER
BALANCE METHOD ... 133 APPENDIX C: CHARACTERISTICS OF DMAs ... 154 APPENDIX D: INTEGRITY TEST METHOD OF BOUNDARY VALVES ... 158 APPENDIX E: ANALYTICAL MODELLING OF MINIMUM NIGHT FLOW
COMPONENTS ... 163 APPENDIX F: FLOW AND PRESSURE NIGHTLINES ... 166 APPENDIX G: THEORETICAL ECONOMIC MODELS OF LEAK
ACKNOWLEDGMENTS
This study was carried out under collaborative research agreements between the Institute for Research in Construction of the National Research Council Canada (NRC-IRC), Communities of Tomorrow Inc. (CT), City of Regina; City of Ottawa, and Halifax Regional Water Commission. CT and NRC-IRC provided funding for the study and the cities contributed in kind.
Darrel Bellows, Randy Burrant and Brian Wirth (City of Regina); and
Mahmoud Halfawy, Paul Kulpate, Wei Peng and Alex Wang (NRC-IRC) participated in this part of the study - their help and cooperation are sincerely appreciated.
LIST OF TABLES
Page Table 1: Average residential night demand based on readings of flow meters
in the AC DMA using AMR ... 62
Table 2: Average residential night demand based on the collective flow measurement method (i.e., average supply minus background leakage) and the individual water meter reading method for the AC
sub-DMA (units are in L/connection/h) ... 63
Table 3: Average residential night demand based on readings of flow meters
in the PVC DMA using AMR ... 64
Table 4: Variation of average residential demand for a group of 500
residences in the AC DMA during the night of 21 April 2006 ... 65
Table 5: Background leakage levels for the AC-sub-DMA estimated using the
water balance method ... 66
Table 6: Background leakage levels for the PVC DMA estimated using the
water balance method ... 67
Table 7: Leakage levels in May 2006 in the AC DMA based on water balance
using total volume method ... 68
Table 8: Leakage levels in May 2006 in the AC DMA based on water balance
using minimum flow rate method ... 69
Table 9: List fire hydrants found to be leaking in the AC DMA ... 70
Table 10: Leakage rates in May 2007 in the AC DMA based on water balance
using total volume method ... 71
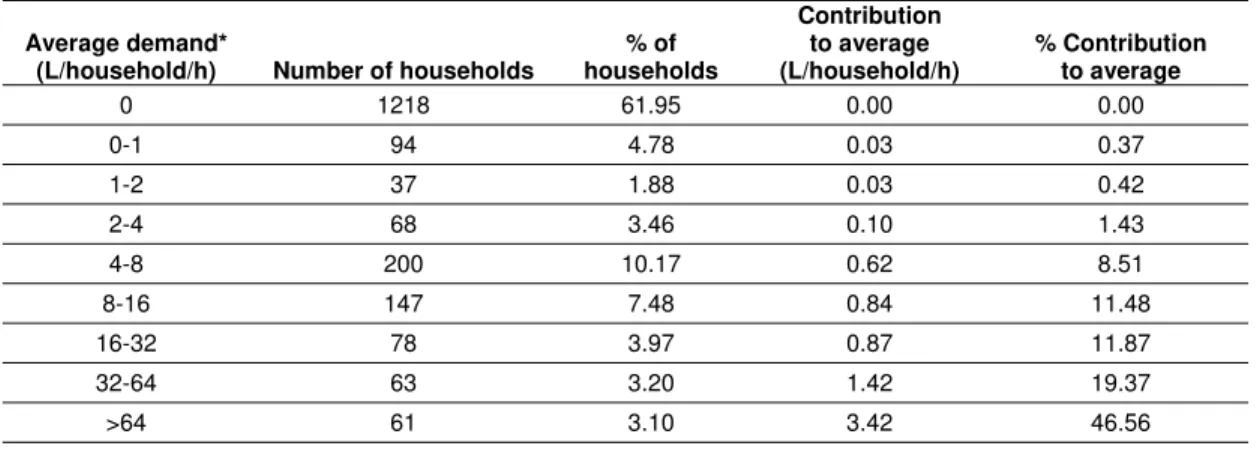
Table 11: Distribution of residential night demand measured in the AC DMA
using AMR on night of 15 February 2006 ... 72
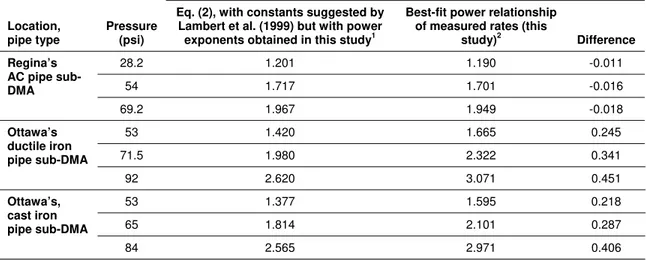
Table 12: Background leakage rates based Eq. (2) used in current practice with constants suggested by Lambert et al. (1999) but with power exponents obtained in this study versus best-fit power relationships obtained in this study for the AC pipe sub-DMA in Regina and ductile
LIST OF TABLES (CONT'D)
Page Table 13: Background leakage rates based on Eq. (2) but with exponents A, B
and C modified to 24 L/km/h, 1.5 L/connection/h and 0.4
L/connection/hour, respectively, and power exponents obtained in this study versus best-fit power relationships obtained in this study for the
ductile and cast iron pipe sub-DMAs in Ottawa and AC pipe sub-DMA ... 74
Table 14: Effect of the exponent of the power relationship between Unavoidable Annual Real Losses (UARL), in L/connection/h, and
LIST OF FIGURES
Page
Figure 1: Aerial view of PVC pipe DMA ... 76
Figure 2: Boundary of PVC pipe DMA ... 77
Figure 3: Aerial view of asbestos cement pipe DMA ... 78
Figure 4: Boundary of asbestos cement pipe DMA ... 79
Figure 5: Boundary of asbestos cement pipe sub-DMA ... 80
Figure 6: Aboveground bypass for water supply at the PVC DMA using 3-inch fire hoses ... 81
Figure 7: Aboveground bypass for water supply at the AC sub-DMA using 3-inch fire hoses ... 82
Figure 8: Aboveground bypass for water supply at the 2000-house AC DMA using 5-inch fire hoses ... 83
Figure 9: Aboveground bypass for water supply at the 2000-house AC DMA using 3 and 5 fire hoses ... 84
Figure 10: Pressure logger at point of average pressure in DMA ... 85
Figure 11: Listening for acoustic noise of passing water at DMA boundary valves ... 86
Figure 12: Reading of residential flow meters remotely using Regina’s AMR system ... 87
Figure 13: Regina’s AMR vehicle ... 88
Figure 14: Flow nightline at 5-seconds interval for the AC pipe sub-DMA at an average normal operating pressure of ~69 psi on the night of 7 May 2006 ... 89
Figure 15: Flow nightline at 5-seconds interval for the AC pipe sub-DMA at average normal operating pressure of ~69 psi on the night of 14 May 2006 ... 90
Figure 16: Flow nightline at 5-seconds interval for the AC pipe sub-DMA at an average normal operating pressure of ~69 psi on the night of 15 May 2006 ... 91
LIST OF FIGURE (CONT'D)
Page Figure 17: Flow nightline at 5-seconds interval for the AC pipe sub-DMA at a
nominal average pressure of 58 psi on the night of 15 May 2007 ... 92
Figure 18: Flow nightline at 5-seconds interval for the AC pipe sub-DMA at a
nominal average pressure of ~29 psi on the night of 16 May 2007 ... 93
Figure 19: Flow nightline at 5-seconds interval for the AC pipe sub-DMA at nominal average pressures of 30 and 55 psi on the night of 18 May
2007 ... 94
Figure 20: Flow nightline at 5-seconds interval for the PVC pipe sub-DMA at an average normal operating pressure of ~69 psi on the night of 10
May 2006 ... 95
Figure 21: Flow nightline at 5-seconds interval for the PVC pipe sub-DMA at
an average nominal pressure of 44 psi on the night of 11 May 2006 ... 96
Figure 22: Flow nightline at 5-seconds interval for the PVC pipe sub-DMA at
an average nominal pressure of 30 psi on the night of 19 May 2007 ... 97
Figure 23: Flow nightline at 5-seconds interval for the PVC pipe sub-DMA at
an average nominal pressure of 55 psi on the night of 20 May 2007 ... 98
Figure 24: Listening for leak acoustic leak noise at fire hydrants ... 99
Figure 25: Locations of hydrants found to be “noisy” in an acoustic listening
survey in the AC DMA ... 100
Figure 26: Flow nightline of the AC pipe DMA during step testing on 17 May
2007 ... 101
Figure 27: Flow nightline of the AC pipe DMA’s southern zone (south of Grant
Road and Drives) during step testing on 22 May 2007 ... 102
Figure 28: Photo of the circumferential break on the bottom half of the 152
mm AC pipe located by step tests and leak noise correlation ... 103
Figure 29: Photo of the broken storm sewer service pipe into which drained water leaking from the nearby circumferential break detected in a 152
mm AC pipe ... 104
Figure 30: Background leakage rate versus pressure for the asbestos-cement
LIST OF FIGURES (CONT'D)
Page Figure 31: Residential night demand measured in the AC DMA using AMR on
the night of 15 February 2006: (a) contribution to average demand by
different demand groups and (b) distribution of night demand ... 106
Figure 32: Result of the correlation of leak noise in the broken pipe section on Logan Crescent obtained in the correlator-based leak survey on the night of 21 May 2007. The correlation was dominated a peak of an out-of-bracket noise that masked the peak (marked by crosshairs)
corresponding to the actual position of the pipe break ... 107
Figure 33: Result of the correlation of leak noise in the broken pipe section on Logan Crescent obtained on the night of 23 May 2007, shown up to FFT average No. 29. The dominant peak corresponds to the actual
position of the pipe break ... 108
Figure 34: Result of the correlation of leak noise in the broken pipe section on Logan Crescent obtained on the night of 23 May 2007, shown at FFT average No. 29. The peak corresponding to the actual position of the pipe break is now masked by a dominant peak corresponding to noise
from water draw that started after FFT average 28 ... 109
Figure 35: Result of the correlation of leak noise in the broken pipe section on Logan Crescent obtained on the night of 23 May 2007, 12 minutes after obtaining the correlation in Figure 34, showing that the interfering peak
had disappeared ... 110
Figure 36: Discharge coefficient, Cd, versus Reynolds number for a 1-mm
diameter orifice (partly reproduced from Lambert, 2001) ... 111
Figure 37: N1 for best-fit power relationship between pressure and UARL calculated using N1 = 1.5 and 0.5 for background and
Unreported/reported leaks, respectively ... 112
Figure 38: Error in ILI due to the assumption of a linear pressure-UARL
relationship ... 113
Figure 39: N1 for best-fit power relationship between pressure and UARL calculated using N1 = 1.5 and 1 for background and
Unreported/reported leaks, respectively ... 114
Figure 40: Variation of infrastructure leakage index with pressure fora system having a service connection density of 80 connections/km and an average service pipe length of 15 metres from curbstop to customer
LIST OF SYMBOLS
° C Degree Celsius
A Constant equal to 20 L/km/h, corresponding to rate of background leakage
at 71 psi pressure in distribution mains
AC Asbestos Cement
AMR Automatic Metre Reading
AWWA American Water Works Association
B Constant equal to 1.25 L/connection/h, corresponding to rate of
background leakage at 71 psi pressure in service connections to from mains to curbstops
c Marginal cost of lost water ($/m3)
C Constant equal 0.5 L/connection/h, corresponding to rate of background
leakage at 71 psi pressure in 15-metre long service connection pipes between curbstops and customer water metres
CARL Current Annual Real Losses
DMA survey
C Cost in dollars of acoustically surveying a DMA
DMA District Metered Area
FFT Fast Fourier Transform
Fo Frequency of unreported leaks per km of pipe per year
GIS Geographic Information System
h Hour
Hz Hertz, unit of frequency defined as the number of cycles per second
ILI Infrastructure Leakage Index
IWA International Water Association
km Kilometre
L Litre
LBackground Background leakage
LDMA Total length of distribution mains in km in a DMA in km
Lm Total length of distribution mains in km
Lp Average length of service connection pipes in metres between curbstops
and customer water metres
Ls Total length of service connection pipes in metres between curbstops and
LIST OF SYMBOLS (CONT’D)
m Metre
N1 Exponent for power relationship between leakage and pressure
Nc Total number of service connections
P Pressure
PRV Pressure Reducing Valve
psi Pressure unit, pounds per square inch
PVC Polyvinyl Chloride
R Average volume of water lost in m3 per year per leak
sub-DMA A small area of a DMA
optimum I
T Theoretically optimum intervention period for acoustic leak surveys
UARL Unavoidable Annual Real Losses
1 INTRODUCTION
Municipal water pipe networks deteriorate naturally with time and subsequently lose their initial water tightness. Deterioration is caused by corrosive environment, soil movement, poor construction practices and workmanship, fluctuation of water pressure, and excessive traffic loads and vibration. Water is lost due to leakage in different components of the networks: transmission pipes, distribution pipes, service connection pipes, joints, valves, fire hydrants, and storage tanks and reservoirs. In addition to physical losses due to leakage, many pipe networks suffer from so called apparent losses. These are caused by customer meter under registration,
accounting errors, and unauthorized water use.
Water loss in municipal water pipe networks is a common problem in Canada. On average, about 20% of the water produced by municipalities in Canada is lost, mostly due to leakage in the pipe network (Environment Canada, 2004). Losses in the United States are reported to range from 15% to 25%, of which about 60% to 75% is recoverable leakage (Vickers, 1999).
Management of leakage in water pipe networks has several potential benefits. In addition to helping municipalities meet water demand, lowering of leakage helps to reduce water quality breaches that may result from the entry of contaminants via leaks. Also, reducing leakage helps to decrease the high cost of energy wasted on treatment and pumping of lost water (Colombo and Karney, 2002). The energy-wasting aspect of leakage is important as significant savings can be realized. Energy to supply water is the second largest cost after labour for water systems in
developed countries, and the cost may easily consume 50% of a municipality’s budget in the developing world (James et al., 2002).
Leakage in municipal water pipe networks has economic, environmental, legal, social and political consequences. Therefore, most municipalities need to manage leakage in their pipe networks. The need to do so became more urgent in recent years due to several factors including:
- Diminishing water resources and subsequent shortages caused by more frequent and prolonged droughts due to climate change. This problem is particularly serious in the Canadian Prairies, e.g., the 1999-2004 episode. The Prairies are likely to face a severe drought within the next couple of decades (CBC, 2006).
- Increasing demand for water due to population growth. - Escalating energy cost.
- Increasing awareness by customers of the environmental and social effects of water loss, e.g., effect on energy usage, contamination, and property damage and disruptions due to emergency repairs.
- Emergence of best practice guidelines and new technologies for effective management of leakage.
- The significant and sustained reduction in the rates of lost water realized by utilities, e.g., those in the U.K., which implemented best practices and new technologies to manage leakage.
- High water losses are being increasingly looked upon as an indicator of inadequate maintenance activity and ineffective utility management. - Looming regulatory requirements to manage leakage.
Leakage management involves water audits, leak detection or monitoring, pressure control, and leak location and repair. In extreme cases, it may involve pipe rehabilitation or replacement. Water audit procedures are well established, e.g., the IWA standard audit which was implemented for Regina in this study using a GIS-based software system. Pressure reduction is rarely used in Canada for leakage management and this will likely not change, at least in the near future. Municipalities are able to locate most leaks successfully using acoustic equipment, e.g., electronic listening devices and correlators that advanced dramatically in recent years.
Most municipalities in Canada that have active leak detection policies rely on periodic acoustic surveys to detect leakage; very few municipalities use
district-metered areas (or DMAs) to detect or monitor leakage. In recent years, encouraged by the widespread use and success of DMAs in the United Kingdom, an increasing number of municipalities are considering DMAs. However, it was not certain if current DMA practice is directly applicable to water pipe networks in Canada.
Several important components currently used in DMA flow analysis were based on data collected primarily from water pipe networks in the U.K. and Germany and their applicability to Canadian networks was not certain. Pipes in Canada are larger in diameter and therefore are expected to have different background losses, leak frequencies and flow rates. In addition, patterns of night water demand in Canada are thought to be different from European patterns due to differences in population life style and residential plumbing. Accurate information about night residential demand, background leakage, and pressure effect is needed in order to reliably determine the rate of recoverable leakage in a DMA.
The following points can be further shortcomings of international leakage methods if applied to North American systems without proper modification: (i) IWA’s model for estimating Unavoidable Annual Real Losses (UARL) does not account for soil type, pipe burial depth and climate – these have significant effects for systems in Canada and Northern United States, (ii) the 500 litres per hour threshold for
technically undetectable leaks is dated – significant advances in acoustic leak detection equipment were made in recent years which dramatically lowered the threshold, and (iii) the UARL model does not account for different leak survey
procedures, e.g., acoustic mapping or correlation-based surveys can detect a larger number of leaks than simple listening surveys. Inaccurate UARL adversely impacts leakage management since it may lead, for example, to underestimates of
2 OBJECTIVE
The objective of this project was to develop enhanced leakage management methods for municipal water pipe networks in Canada. Emphases were on the district metered-area method and included:
(i) Determination of night residential demand.
(ii) Development of an empirical model for estimation of background leakage rates and/or development of analytical procedure(s) that can derive it directly, e.g., analytical modelling of night flow rates measured under different pipe pressures.
(iii) Derivation of relationships between leakage rate and pipe pressure. (iv) Comparison of the performance of different acoustic leak detection
methods.
3 SCOPE
The project involved extensive measurement and analysis of flow and pressure nightlines for several residential district metered areas at two municipal water pipe networks in Canada having different but typical regional characteristics. The selected networks were those of Ottawa and Regina. Planned fieldwork in Halifax could not be performed due to administrative difficulties at NRC.) Two district-metered areas (DMAs) were created in each water pipe network. Experimental fieldwork was
performed under controlled conditions to: (i) measure night residential demand and if possible evaluate indirect statistical procedure(s) for calculation of residential
demand, (ii) measure background and recoverable leakage rates, (iii) establish leakage-pressure relationships, and (iv) evaluate analytical procedure(s) for component identification of night flow. Planned fieldwork in Ottawa to compare different leak detection strategies could not be performed because the city as a result of stretched resources and unexpected heavy workload could not provide the required support. Instead, description of different acoustic leak detection strategies,
discussion of their pros and cons, and reported experiences with their performance are presented in Appendix A.
In this report, findings and conclusions based on fieldwork carried out in Regina are presented and discussed. Details of fieldwork; instrumentation and software; measurement and analysis procedures are also provided. First, however, an overview of leakage management is presented. Findings and conclusions based on fieldwork in Ottawa are presented in a companion report.
4 OVERVIEW OF LEAKAGE MANAGEMENT
Management of leakage consists of the following four main components: (i)
quantifying total water loss; (ii) detection or monitoring of leakage; (iii) locating and repairing leaks; and (iv) pipe pressure management. In extreme situations, leakage management may involve pipe rehabilitation or replacement but this is not
considered here.
The total amount of lost water is quantified by conducting a system-wide water audit, known internationally as water balance. Procedures for conducting water audits were published by the American Water Works Association (AWWA, 2009) and by the International Water Association (Alegre et al., 2000) and (Lambert, 2003).
Like financial audits that account for all the debits and credits of a business, water audits account for all water flowing into and out of a utility’s water delivery system. An audit can be performed over an arbitrary period, but normally is
computed annually over 12 months. Audits provide a valuable overall picture of the various components of consumption and loss, which is necessary for assessing a utility’s efficiency regarding water delivery, finances, and maintenance operations. In addition, water audits are necessary for planning other leakage management
components.
In Regina, the IWA standard water balance was implemented in this study in a GIS-based software system, presented in Appendix B. This system integrates data
from the water network asset inventory, water supply supervisory control and data acquisition (SCADA) records, automated meter reading system (AMR), and other water use data to automatically generate water balance reports, quantify water loss and recoverable leakage, and calculate key water loss performance indicators, including the infrastructure leakage index (ILI).
Leak detection can be achieved using district-metered areas. This involves dividing the pipe network into well-defined areas and monitoring water flow supplied to each area. The boundaries of DMAs can sometimes occur naturally but generally have to be created by closing appropriate valves. The size of a typical DMA can be between 500 and 3000 service connections (Hunaidi & Brothers, 2007a). Night flow rates of DMAs are monitored on quarterly, monthly or continuous basis if data loggers connected to DMA flow meters are equipped with remote communication devices (e.g., cellular modems). Guidelines for setting up, maintaining, and
monitoring the leakage of DMAs were published by UKWIR (1999) and IWA (2007). Leakage in a DMA is suspected if the minimum night flow rate exceeds a certain threshold. The latter is determined as the sum of the flow rate of water used by all nighttime commercial and industrial users in the district, flow rate of water used by all residences based on an estimate of average night flow rate per household, and background leakage rate. DMAs make it possible to quickly and efficiently identify areas of pipe networks that suffer from excessive leakage, which are then targeted for acoustic leakage detection and localization operations. Analysis of night water flow can also be used to refine (or check) the accuracy of water audits.
District metered areas are not commonly used in Canada. Most municipalities that have active leak detection policies rely on periodic acoustic surveys to detect leakage. In these surveys, the water pipe network is checked for leaks from end to end either by listening to or by correlating acoustic noise induced by leaks at various contact points with pipes. All areas of the pipe network are surveyed whether or not leakage is suspected. Municipalities that have active leak detection policies usually survey their pipe networks at a frequency of about two years.
An alternative to periodic acoustic listening or correlation surveys, especially in noisy parts of cities, is the use of acoustic noise loggers. These are compact units composed of a vibration sensor (or hydrophone) and a programmable data logger. Noise loggers are deployed in groups of six or more at adjacent pipe fittings (e.g., fire hydrants and valves 200 to 500 m apart) and left overnight. The units are normally programmed to collect pipe noise data between 2:00 and 4:00 AM. They are collected the following day and recorded data is downloaded to a personal computer before the loggers are deployed at the following location. The data is analyzed statistically, e.g., frequency analysis of leak noise levels, to detect the presence of leaks. Recent models of acoustic noise loggers can be deployed permanently. Leak noise is measured nightly and processed using on-board electronics, the result is stored in memory for later transmission wirelessly to a roaming vehicle or a permanent receiver.
The economic viability and leak detection effectiveness of temporarily or permanently deployed noise loggers is questionable. Van der Klejj and Stephenson (2002) found that both permanently and temporarily deployed loggers are not an economical alternative to skilled and well-equipped leak inspectors. For network-wide coverage, permanent loggers had a minimum payback period of 25 years. When the loggers were used in temporary mode (i.e., moved from one survey area to the next), they were three times less efficient than acoustic surveys. Van der Klejj and Stephenson also reported that the number of leaks found by noise loggers and by general listening surveys were similar; however, the loggers failed to detect approximately 40% of leaks found by detailed listening surveys.
The exact position of a leak is commonly pinpointed using ground microphones and leak noise correlators and sometimes by using non-acoustic methods, such as thermography, ground-penetrating radar, and tracer gas (Hunaidi et al., 2000). Pinpointing leaks can be time consuming. Therefore, in the case of DMAs, leak areas are narrowed down to a few pipe sections before pinpointing them. A procedure known as “step testing” can be used to achieve this. Step testing involves the monitoring of the district meter’s flow rate while successively closing
valves within the DMA, starting with the valve farthest away from the meter. A significant reduction in the flow rate is an indication of leakage in the last shut-off section. Step testing has to be performed at night and can be time consuming and dangerous. Also, closing/opening of valves may lead to water quality problems and sudden pressure fluctuation. In recent years, its use has dwindled in favour of acoustic surveys using noise loggers, acoustic listening tools, or leak noise correlators.
Pipe pressure affects leakage in a number of ways and a substantial reduction in leakage can be realized by pressure reduction (Report 26, 1980) and (Thornton, 2003). Theoretically, the flow rate of a fluid through an opening is proportional to the square root of the pressure differential across the opening,
provided the dimensions of the opening remain fixed. However, the effective area of the opening may enlarge with pressure. Therefore, much greater reductions in
leakage may be realized than predicted by the square root relationship, especially for small leaks from joints and fittings in most pipe types and large leaks in plastic pipes (Lambert, 2001). A linear relationship between pipe pressure and leakage rate is widely used by leakage management practitioners.
Pressure reduction is rarely used in Canada for leakage management and this will likely not change, at least in the near future. Municipalities are usually concerned about meeting fire fighting requirements; potential revenue loss; high maintenance of pressure control equipment and long-term effectiveness of pressure control.
5 DESCRIPTION OF TESTS Test Sites
Measurements of night flow and pressure were performed for two specially created DMAs in Regina, each having a different pipe type, in May 2006 and May 2007. The first DMA was in the Gardiner Heights area in the eastern part of the city (see Figure 1 for aerial view). This DMA had ~4.3 km of distribution pipes constructed in the 1980s and 90s, all of which were made of polyvinyl chloride (PVC). The DMA also
had 394 service connections, all of which are residential (see APPENDIX C for further information). The number of boundary valves needed to completely isolate this DMA was five (Figure 2). The DMA size is small in comparison to that of typical DMAs, which normally have 2000 service connections. However, this was the largest PVC pipe area that could be isolated in Regina’s distribution system.
The second DMA was in the Whitmore Park/Hillsdale area in the south of the city (Figure 3). This area is known to have one of the worst pipe breakage rates in Regina. The DMA had ~26.7 km of distribution pipes constructed in the 1950s and 60s, all of which were made of asbestos-cement (AC). The DMA also had 2095 service connections; most of it is residential (see APPENDIX C for further
information). The number of boundary valves that were needed to completely isolate this DMA was 17 (Figure 4). Flow and pressure were also measured in a small sub-area (sub-DMA) of this DMA that consisted of ~2.7 km of distribution pipes and 222 service connections, all of which are residential (Figure 5).
The above AC and PVC pipe DMAs were representative of pipe types and conditions commonly found in Regina. The city’s water distribution pipe network is comprised of 859 km of distribution pipes, of which 66% is asbestos cement, 32% is PVC, and 2% is steel and other types. The network has 58,000 service connections and it services 188,000 people. Average pipe pressure in the network is 61.1 psi. Average volume of water pumped into the network is 73.8 ML/day and the marginal
cost of water is ¢17.9/m3. The pipe network is assumed to be in good condition.
Current leakage management strategy is passive. Setup of DMAs
District metered areas were isolated at night by temporarily closing all boundary valves of the selected areas between approximately 10:00 PM and 6:00 AM. Water was supplied to the isolated areas via an aboveground bypass by running a fire hose (up to 150 m) between a hydrant outside the DMA and another inside it. A 3-inch diameter hose was used for the PVC DMA and AC sub-DMA (Figure 6 and Figure
significant pressure loss it was changed to a 5-inch diameter hose, and finally 3 and 5-inch diameter hoses were used in parallel (Figure 8 and Figure 9). This helped to reduce pressure losses that resulted from high flow velocities because of a
significantly higher than expected night water demand.
Fire hoses were connected to a mobile rig that included a flow meter,
pressure reducing valve (PRV) and a pressure gauge (Figure 7). Pipe pressure was recorded at a fire hydrant near a point where pressure was equal to the average of pressure in the whole DMA (Figure 10).
The integrity of boundary valves, i.e., their water tightness, was checked by city staff prior to the setup of DMAs. Initially, it was planned to use the zero pressure method to test valve integrity. However, new regulations in Saskatchewan stipulated that if pressure in water pipes drops below 20 psi, the affected area should be taken out of service and super chlorinated. This made the traditional valve integrity test method potentially costly and disruptive. City staff, in collaboration with Turner Consulting of Winnipeg, developed a special procedure to ensure that pressure remained above a selected minimum value while checking valve integrity (APPENDIX D).
A few boundary valves failed the integrity check, i.e., they were found to pass water while in the closed position. Seats and discs of valves that failed initial checks were scoured by creating high-velocity flows. This helped to restore tight seating of all valves except for one, which was subsequently excluded by adjusting the
boundary of the affected DMA.
During flow measurements and while pressure inside DMAs was reduced below that in surrounding areas by 20 to 30 psi, the integrity of boundary valves was re-checked acoustically. This was done by using an electronic listening device to listen for sound on a solid valve key placed on the valves (Figure 11). A valve that is not tightly seated creates a hissing sound under differential pressure. All valves in the PVC DMA were found to be tightly seated based on acoustic listening. However, a valve at McPherson Av. and Hillsdale St. in the AC DMA was heard to be slightly
passing water at an estimated flow rate of no more than 5 litres per minute, based on the intensity of “hissing” sound.
A small section on McPherson Av. was isolated to estimate the rate of water passing through the valve at McPherson Ave. and Hillsdale St. by closing valves near the intersections of Knowles St. and Cowan Cr. with McPherson Av. The fire hydrant near the intersection of was opened fully. An acoustic check revealed that the non-boundary valve on McPherson Av. near Cowan Cr. was also passing (it had a much louder noise than the boundary valve at the intersection of McPherson Av. and Hillsdale St.). Flow at the fire hydrant from the two passing valves was roughly 50 L/minute at a differential pressure of ~57 psi (equal to ~62 psi operating pressure in adjacent areas minus 5 psi corresponding to height of the hydrants vertical pipe). At most, half of this rate was assumed to be due to water passing through the
boundary valve at the intersection of McPherson Av. and Hillsdale St. Subsequently, using a square-root relationship, water passing through this valve was at most 15.5 L/minute (corresponding to a pressure differential of 25 psi between the DMA and surrounding areas). This passing rate was considered insignificant and hence the boundary of the DMA was not altered.
Water flow and pipe pressure were recorded at 5-second long intervals
between approximately 11:30 PM and 5:30 AM. Recorded flow information was used to determine minimum, average and maximum flow rates for stationary 1-mintute long intervals. Recorded pressure information was averaged over stationary 1-minute long intervals. 60-1-minute moving averages of flow rate and pressure were also determined based on 1-minute averages. The register of the flow meter was read manually at the beginning and end of the period over which flow information was recorded and totals based on recorded flows and manual readings were compared to check accuracy; differences were always very small.
Instrumentation and Software
All instrumentation and software that were used for measuring, recording and analyzing flow and pressure were off-the-shelf and commercially available. Water flow into DMAs was measured using one or more of the following flow meters:
- 3/4-inch Neptune T-10 positive displacement flow meter having a pulse factor of 17.07 pulses per litre; low flow rate of 1 litre per minute at 95% accuracy; and normal operating range between 2.8 and 114 litres per minute at 100% accuracy (±1.5%)
- 1-inch Sensus SR II positive displacement flow meter having a pulse factor of 4.04 pulses per litre; low flow rate of 2.5 litres per minute at 95%
accuracy; and normal operating range between 11.7 and 183.3 litres per minute at 100% accuracy (±1.5%)
- 2-inch Neptune T-10 positive displacement flow meter having a pulse factor of 1.98 pulses per litre; low flow rate of 3.83 litres per minute at 95% accuracy; and normal operating range between 9.5 and 606 litres per minute at 100% accuracy (±1.5%)
- 3-inch Neptune high performance turbine flow meter having a pulse factor of 0.148 pulses per litre; normal operating range between 19 and 1703 litres per minute at 100% accuracy (±1.5%); and maximum intermittent flow rate of 2120 litres per second
Calibration of flow meters was checked at the city’s meter shop by city staff prior to field measurements. Magnetic drive signals of flow meters were digitized and recorded using MeterMaster’s strap-on magnetic sensor and data logger model 100. Data files were exported from the logger to Microsoft Excel spreadsheets for analysis and graphing.
A 1-½ inch pressure reducing valve with a low flow stabilizer (Singer model 106-PR) was used to control pipe pressures in DMAs. Unfortunately, the PRV used in May 2006 did not function properly and hence it was bypassed. Instead, pipe
pressure in the AC sub-DMA and PVC DMA was controlled by manually throttling a 2-inch ball valve but this resulted in significant pressure oscillations. For the AC DMA, significant pressure drop occurred because of friction losses due to high flows in the flow meter and the long fire hose used for the water supply bypass. Pressure was controlled by changing the size of the fire hose and flow meter (in one case using two sets of fire hoses and flow meters in tandem). In May 2007, pressure in the AC sub-DMA and PVC DMA was controlled using a 1-inch pressure reducing valve with a low flow stabilizer (Singer model 106-PR). Pressure in the AC DMA was controlled by throttling a 3-inch gate valve after the flow meter.
The city’s drive-by wireless automatic meter reading (AMR) system
manufactured by Sensus Metering Systems was utilized in this study to measure night water demand (Figure 12 and Figure 13). It took ~70 minutes to read the 2095 residential water meters in the AC DMA and ~6 and 14 minutes to read all meters in the AC sub-DMA and PVC DMA, respectively. Almost all residential water meters
were 5/8 inch in size ⎯ about 95% were new Sensus meters having an AMR reading
error that ranges between 0 and 1.
The remaining meters were old Neptune meters with ProRead registers. For
5/8 and ¾ inch meters, the ProRead register encodes readings with a 100 litres
resolution, i.e., readings are xxxxx000, xxxxx100, xxxxx200 … xxxxx900 litres. The Sensus AMR system converts the third digit to zero if it’s 2,1,0,9,8 or to five if it’s 3,4,5,6,7. In other words, the AMR system reads Neptune residential meters with ProRead registers only as xxxxx000 or xxxxx500 litres. Subsequently, the Neptune ProRead water meters have an AMR reading error that ranges between –1000 and +200 litres. Water volume based on the difference between two AMR readings have an error range of ±1 and ±1200 litres for Sensus and Neptune ProRead meters, respectively. Therefore, the reading resolution of the Neptune meters is insufficient for water balance purpose if the number of meters is small. Total error from a large sample of meters will be close to zero because of the randomness of individual flow meter reading errors.
Measurement and Analysis Procedures Residential night demand
Residential night water demand was to be established based on the following two methods:
(i) Measurement of water demand using individual residential water meters, and
(ii) Measurement of water demand by a group of 250 to 400 residences collectively.
Residential flow meters were read at the beginning and end of a nominal two-hour period during several nights in February, April and May 2006 and in May 2007. Flow meters were read between 12:00 and 4:00 AM using Regina’s AMR system. It took ~70, 6, 14 and 20 minutes to collect flow meter readings in the AC DMA, AC sub-DMA, PVC DMA, and the group of 500 residences in the AC DMA, respectively. Readings were downloaded to spreadsheets to calculate individual and average residential night water demand per service connection per hour.
Night demand for each residential service connection was calculated by dividing the difference between meter readings at the beginning and end of the 2-hour period by the difference between actual times of the two meter readings. Residential night demand based on these measurements includes losses from residential plumbing beyond residential flow meters. Average residential demand was calculated as the sum of demand rates of all connections with Sensus flow meters divided by the number of these connections. Connections with Neptune flow meters equipped with ProRead registers were excluded because of their insufficient reading resolution, as noted earlier.
Average residential night demand was also determined over several periods during one night in April 2006, which was outside the lawn-watering season. This was done to observe the variation of demand during the night. Average demand was
determined from AMR readings of water meters of 500 residences in the AC DMA. AMR readings were collected at 30-minute intervals between 12:00 and 3:30 AM.
In the collective measurement method, average residential night water demand was estimated as the hourly flow rate (calculated over a 2-hour period) in the small AC sub-DMA and PVC DMA minus the corresponding background leakage rate divided by the number of residences in the test area. Residential night demand based on these measurements excludes losses from residential plumbing beyond residential flow meters. Subsequently, the latter may be estimated by subtracting residential demand based on the collective measurement method from that based on the individual water meter reading method.
Background leakage
Background leakage rate was to be established based on measurements of water flows supplied to areas comprised of a small number of service connections. In small areas, it is very likely that there would be several short intervals in the flow nightline with no water being consumed by residences (except for plumbing losses).
Therefore, in the absence of any detectable leakage, background leakage rate would correspond to the minimum measured flow rate.
Supply flow rates of the AC sub-DMA and PVC DMA, comprised of 220 and 394 service connections, respectively, were measured in May 2006 and May 2007 for several nights between approximately 11:30 PM and 5:30 AM. Prior to conducting these measurements, leak detection surveys were undertaken. There were no leaks detected in the PVC DMA and only a fire hydrant leak was detected in the AC sub-DMA, which was promptly repaired prior to flow measurements.
Initially, it was planned to measure supply flow rates of the AC sub-DMA and PVC DMA twice: (i) while residential curbstops were open and (ii) while residential curbstops were closed but the latter was unfeasible because of operational
components corresponding to distribution mains and service connection pipes before and after curbstops.
Recoverable leakage
Recoverable leakage rate in the AC DMA was to be estimated based on the following two water balance methods:
- Total volume of water supplied to the DMA minus total volume of water consumed by residences and businesses in the DMA determined from AMR readings of flow meters at the beginning and end of the water balance period.
- Minimum of the moving 60-minute average water flow rate supplied to the DMA minus average rate of residential demand.
For conducting a water balance of total volumes, residential water meters were read using AMR at 2-hour intervals while measuring water supply to test areas. AMR readings were downloaded to spreadsheets and used to determine the total volume of water consumed by all residences and businesses (if any) in the test area over a selected water balance period. Readings of both Sensus and Neptune
ProRead flow meters were included.
It was not possible to read all water meters simultaneously with Regina’s drive-by AMR system. Therefore, it was not possible to perform a true water balance because of the time delay between readings of residential water meters and the meter at the inlet of the DMA. However, the resulting error is believed to be minor. Statistical estimation of residential night demand
Residential night water demand was also to be estimated by statistical analysis of 1-week long (or more) high-resolution measurements of DMA flow nightlines. The principle behind this method is that unless there are significant fluctuations in pressure, water demand due to leakage in DMAs remains almost constant at night. Therefore, fluctuations in the flow nightline of a DMA will be fully attributable to
demand from residences in the district (assuming commercial and industrial use is insignificant or can be accounted for entirely). In this statistical method (Creasey et al., 1996), residential demand is assumed to be dominated by a known short fixed-volume event, e.g., toilette flush, and that the average total demand is constant.
The measurement period is divided into equal short intervals 1 to 5 minutes in length and the measurement period should be long enough to have at least 250 intervals (preferably 500). Total flow volume measured in each interval is converted into an equivalent number by dividing it by the average volume of a toilette flush (or whatever the dominant fixed volume event is). The number of fixed-volume events in each interval is assumed to follow a Poisson distribution. The mean of this type of distribution is equal to its variance.
Since night flow fluctuation is attributed to residential demand only, the mean number of events corresponding to the latter is taken equal to the variance of the total flow expressed in number of events per interval. Residential night demand is equal to the mean number of events multiplied by the average event volume.
Leakage level is estimated by subtracting mean residential demand from mean total demand. This analysis was not feasible for Regina because residential night demand is dominated by the regeneration of water softeners, which have different water use patterns, depending on their make.
Assessment of night flow components using analytical formulation
It was also planned to assess background and recoverable leakage rates and residential night demand analytically from DMA night flow measured under significantly different pipe pressures. Background and recoverable leakage
components respond differently to variation in pressure. If residential night demand is not dependent on pipe pressure (e.g., due to fixed volume toilette flushes), a model can be established to separate these components (Appendix E).
Variation of leakage rate with pipe pressure
The relationship between leakage level and pipe pressure was to be derived from DMA supply flow measurements during at least 3 different pipe pressures (e.g., 80, 60, 40, psi), before/after leak detection and repair. This was not always possible due to operational restrictions.
6 RESULTS AND OBSERVATIONS Residential Night Demand
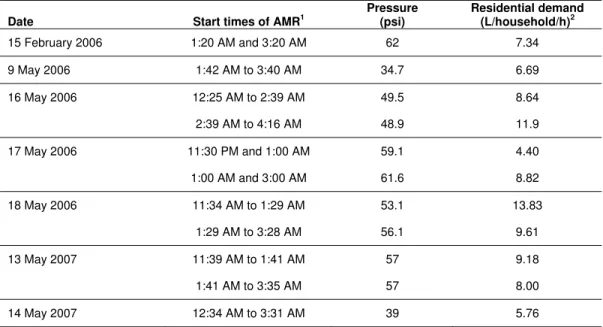
Average residential night demand based on readings of residential flow meters using AMR in the AC pipe DMA, AC pipe sub-DMA and PVC pipe DMA are presented in Table 1, Table 2 and Table 3, respectively. Results include demand rates for the night of 15 February 2006 during winter, as well as rates for several nights in May 2006 and May 2007 during the lawn-watering season. Average residential demand measured for a group of 500 residences in the AC DMA over several periods during the night of 21 April 2006, which was outside the lawn-watering season, is presented in Table 4.
In determining average residential demand, service connections with Neptune ProRead water meters were excluded because of their insufficient reading
resolution, as noted earlier. Start and end times of the periods in Table 1 to Table 3 and Table 4 are the average of corresponding AMR reading times of all water meters.
Residential demand in the AC sub-DMA determined using the collective flow measurement method is compared in Table 2 with demand determined from the individual water meter reading method. It was not possible determine residential demand in the PVC DMA using the collective flow measurement method because of difficulties with measurement of background leakage in this area.
The following observations can be made regarding residential night demand in the AC and PVC pipe DMAs based on the results presented in Table 1 to Table 4:
1. In general, during the month of May, which fell in the lawn-watering
season, demand increased over night. However, outside the lawn-watering season in April, demand did not vary significantly over night.
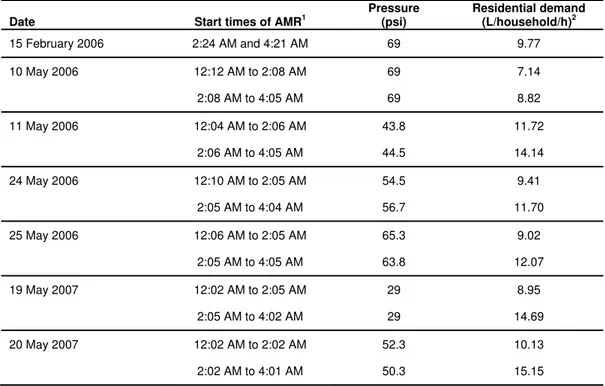
2. Over the same night period, demand varied significantly from night to night in May. For example, average demand in the PVC DMA over 2:00 to 4:00 AM on the night of 11 May 2006 was 14.14 L/household/h compared to 8.82, 11.7 and 12.07 L/household/h on 10, 24 and 25 May 2006,
respectively. Most likely, this was a result of lawn watering at night during May, which fell during the lawn-watering season. This is supported by the observation that demand did not vary significantly from night to night outside the lawn-watering season, e.g., demand in the AC DMA on 15 February and 21 April 2006.
3. Average residential night water demand varied depending on the season and was much higher than the estimate of 1.7 L/household/h used in current practice, which is based on flow measurements in the 1990s in the U.K. and Germany (Report E, 1994). In the asbestos-cement pipe DMA, measured demand was 3.5 to 8 times the currently used estimate. In the PVC pipe DMA, demand was even higher ⎯ 5 to 9 times the estimate used in current practice. This high night demand is due to the widespread use of water softeners in Regina, as discussed later.
4. As expected, night demand was highest during the lawn-watering season. Over the nominal period of 1:00 to 3:00 AM, average demand in the AC DMA was 7.34 and 6.05 L/household/h in during winter (February) and spring (April), respectively. During the lawn-watering season, average demand was 8.8 L/household/h (based on readings on 17 and 18 May 2006 and 13 May 2007). The higher demand rate in February compared to April was most likely due to the common practice of leaving a water tap running slightly during the coldest months in winter in order to prevent
service connection pipes from freezing (temperature was −30° C on the night of 15 February 2006).
5. Night demand in the PVC pipe DMA was significantly higher than demand in the AC pipe DMA. Over the nominal period of 2:00 to 4:00 AM, average demand in the PVC DMA was 9.8 L/household/h during winter (February). During the lawn-watering season, average demand was 12.8 L/connection /h (based on readings on 10,11,24 and 25 May 2006 and 19 and 20 May 2007).
6. Residential demands in the AC sub-DMA obtained using the collective and individual metering were generally close but in few instances, they varied by up to 3.3 L/household/h. This discrepancy could be due to inaccurate measurement of total supply due to a passing boundary valve that could not be detected acoustically; or due to underestimation of demand using the individual AMR metering method because of the exclusion of Neptune ProRead meters. The latter may be significant due to the small size of the test area.
Background Leakage
Flow nightlines measured in the AC sub-DMA are presented in Figure 14 to Figure 19; and those measured in the PVC DMA are presented in Figure 20 to Figure 23. It can be seen from these nightlines that there were virtually no intervals that were long enough, e.g., greater than 30 seconds long, over which the minimum flow rate
remained more or less constant. The only exception was in the flow nightline of the AC sub-DMA measured at average pressure of 54 psi on the night of 15 May 2007 (Figure 17). There was a long enough interval in this nightline between
approximately 1:30 and 1:37 AM over which the flow rate was minimum and remained almost constant. Average flow rate over this period was 1.65 L/connection/h.
An alternative method to estimate background leakage level was to conduct a water balance over periods between AMR readings of residential water meters. Background leakage is determined as supplied water volume registered at the inlet of the test area minus total water volume consumed by all residences in the test area. As discussed later, it was difficult to determine background leakage level using this method due to the insufficient reading resolution for Neptune ProRead flow meters that ~5% of residences in the city had.
Because of possible inaccurate AMR reading of Neptune ProRead meters, background leakage rate based on the water balance method was considered reliable if it did not vary significantly between water volume balances over two
different periods, e.g., 12:00 to 2:00 AM and 2:00 to 4:00 AM. Under this condition, it is most likely safe to assume that no Neptune ProRead meters were active during water balance periods; or if some were active, their AMR readings must have been reasonably accurate.
Results of water volume balances over several night periods in May 2006 and May 2007 are presented in Table 5 and Table 6 for the AC sub-DMA and the PVC DMA, respectively. It can be seen that estimated background leakage rates varied from period to period on almost all nights, thus making them unreliable estimates. On one night, estimated leakage levels were even negative. The only exceptions were background leakage rates obtained for the AC sub-DMA on the nights of 7 May 2006 and 16 May 2007.
On 7 May 2006, background leakage rates were 1.9 and 2.16 L/connection/h over the periods from 11:39 PM to 2:02 AM and from 2:02 AM to 4:04 AM,
respectively. The corresponding average background leakage rate was 2.02 L/connection/h at an average pressure of 69.2 psi. On 16 May 2007, background leakage rates were 1.15 and 1.28 L/connection/h as obtained from water balances over the periods from 12:00 AM 0 to 2:06 AM and from 2:02 AM to 4:04 AM and from 2:06 AM to 3:58 AM, respectively. The corresponding average background leakage rate was 1.21 L/connection/h at an average pressure of 28.2 psi.
The N1 exponent was equal to 0.55 for the best-fit power relationship between
average background leakage rates and pressure measured in the AC sub-DMA (1.21, 1.65 and 2.02 L/connection/h at 28.2, 55 and 69.2 psi, respectively). This exponent is much lower than the 1.5 value used in current practice for background leakage. An exponent close to 0.5 implies that the effective area of leak openings varies little with pipe pressure and an exponent of 1.5 implies that the effective area varies linearly with pressure.
In addition, background leakage rates determined in the AC sub-DMA based on water balance were generally higher than rates that would be estimated using current practice for a system in good condition. Background leakage rate is estimated in current practice using the following equation based on background leakage at 71 psi (50 metres) reference pipe pressure (Lambert et al., 1999) and a power leakage-pressure relationship with an exponent equal to 1.5 (Lambert, 2001):
Eq. (1):
(
)
1 N c p c m 71 P N L 15 C N B L A leakage Background ⎟ ⎠ ⎞ ⎜ ⎝ ⎛ × × × ÷ + × + × = , in L/h or Eq. (2): 1 N s d 71 P L 15 C B c A leakage Background ⎟ ⎠ ⎞ ⎜ ⎝ ⎛ × ⎟⎟ ⎠ ⎞ ⎜⎜ ⎝ ⎛ × ÷ + + = , in L/connection/hwhere P is average pipe pressure in psi; N1 is 1.5, Lm is total length of distribution
mains in km; Nc is total number of service connections; cd is connection density in
number of connections per km of distribution main; Lp is average length of service
connection pipes in metres between curbstops and customer water metres; and A, B and C are constants corresponding to rates of background leakage components at 71 psi pressure in distribution mains, service connections to from mains to curbstops and 15-metre long service connection pipes between curbstops and customer water metres equal to 20 L/km/h, 1.25 L/connection/h and 0.5 L/connection/h, respectively.
If diurnal pressure fluctuation is insignificant, i.e. head losses are small, which is the case for a distribution system with large pipes, daily background leakage rate is equal to:
Eq. (3):
(
)
1 N c p c m 71 P N L 15 C N B L A 24 leakage Background ⎟ ⎠ ⎞ ⎜ ⎝ ⎛ × × × ÷ + × + × × = , in L/dayFor systems in average and poor conditions, background leakage rates estimated using current practice are two and three times that estimated for a system in good condition, respectively.
Background leakage levels for the AC sub-DMA obtained using Eq. (2) for a system in good condition and having service connection density of 81.5 connections per km and average service connection pipe length of 15 metres are: 0.5, 1.32 and 1.92 L/connection/h at 28.2, 54 and 69.2 psi, respectively. The difference between these predicted rates and the ones determined in this study could be attributed to the assumption that the system is in good condition. However, this is unlikely because the ratio between measured and predicted levels varied significantly with pressure. Recoverable Leakage (May 2006)
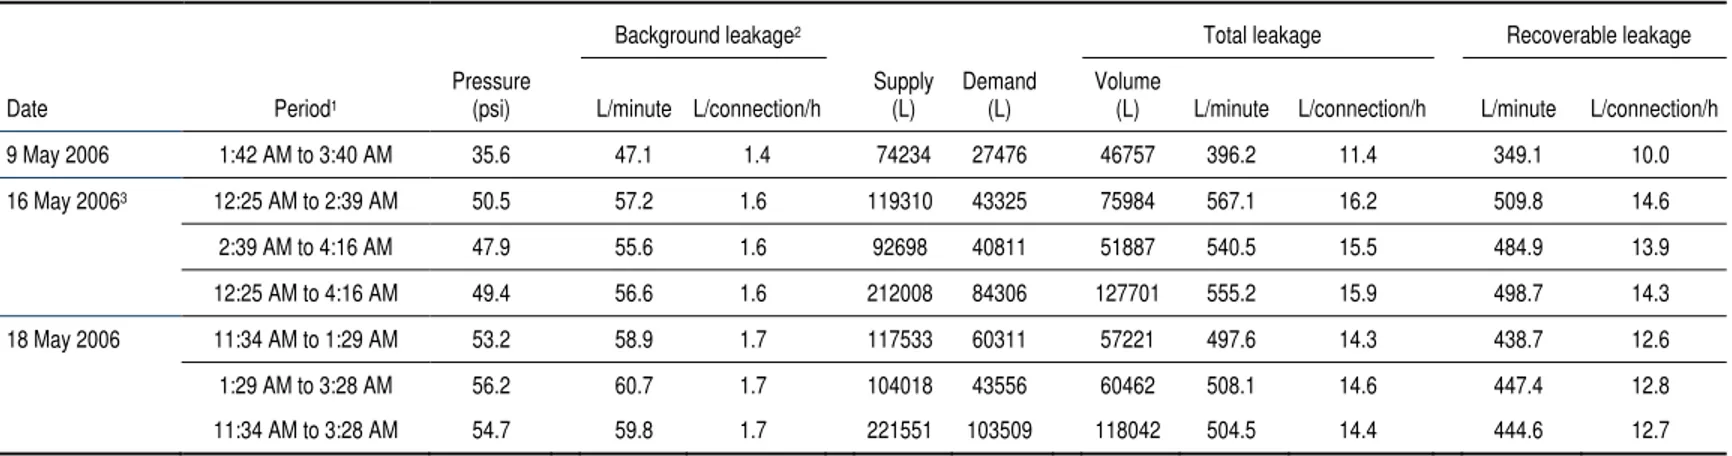
Recoverable leakage rates for the AC DMA obtained from flow measurements over three nights in May 2006 are presented in Table 7 and Table 8. These rates were obtained from water balance over one or more periods using both the total volume and flow rate methods described earlier. Recoverable leakage rate was determined as total leakage rate minus the background leakage rate obtained from the best-fit power relationship between pressure and background leakage rates measured in this study in the AC pipe sub-DMA.
Recoverable leakage rates obtained using the flow rate balance method were significantly lower and more variable from period to period than those obtained using the total volume balance method. Lower rates are due to the use of minimum 60-minute average supply flow rate. The variation of rates obtained with the flow rate balance method can be attributed to the variation of residential demand during the night due to the widespread use of water softeners in Regina. Leakage rates
obtained with the total volume method varied only slightly from period to period over the same night despite the time lag (up to about 35 minutes) between readings of
residential flow meters and the DMA’s inlet meter. This indicates that recoverable leakage rates based on the total volume method are more accurate than rates obtained with the flow rate balance method. Hence, the latter were not considered further.
It can be seen from Table 7 that the recoverable leakage rate on 18 May 2006
was lower than that on 16 May 2006 although pipe pressure on the 18th was higher
by approximately 5 psi. This was due to a leak that developed in the packing of the boundary valve near the intersection between Grant and Gordon roads as observed halfway through flow measurements on the night of 16 May 2006. This valve was replaced prior to flow measurements on 18 May 2006. Therefore, leakage levels on
the 16th were discarded.
As seen in Table 7, recoverable leakage rates over the longest water balance period, which are believed to be more accurate than rates obtained over shorter balance periods, were 349.1 L/minute at 35.6 psi and 444.6 L/minute at 54.7 psi on the nights of 9 and 18 May 2006, respectively. These leakage rates almost follow a
square-root relationship with average pipe pressure (N1 = 0.563). This implies that
the majority of leaks in the AC DMA have almost fixed areas, e.g., corrosion holes or improperly closed fire hydrant valves, etc.
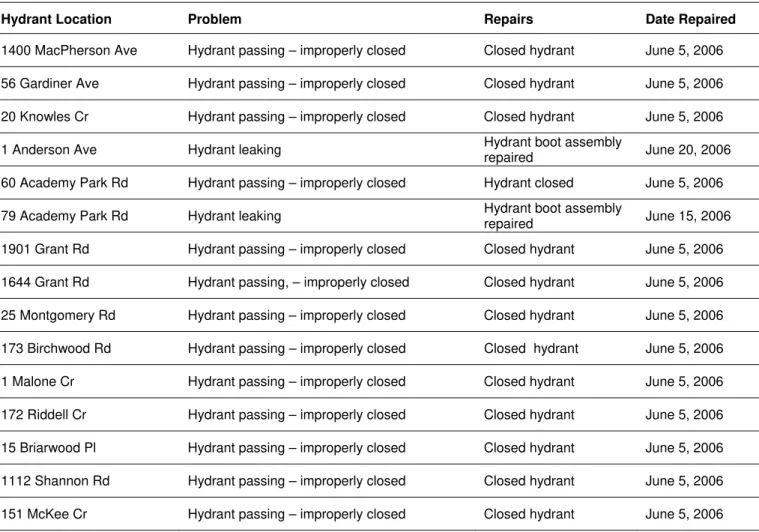
A subsequent leak listening survey of fire hydrants carried out in June by city staff using a Fuji-Tecom LD-7 amplified acoustic listening device (Figure 24)
revealed 15 “noisy” hydrants that were suspected to be leaking (see locations in Figure 25). As noted in Table 9, 13 of these hydrants were found to be leaking because of improperly closed valves; and only 2 hydrants required repair. Due to operational restrictions in the city, night flow in the DMA was not re-measured after hydrant repair until the following year.
Recoverable leakage rate in the AC DMA at the average normal operating pressure of ~62 psi was ~477 L/minute (or 13.67 L/connection/h). For this estimate,
it was assumed that a leakage-pressure power relationship with exponent N1=0.56