Development, Perceptual Evaluation, and Acoustic Analysis of
Amplitude-based FO control in Electrolarynx Speech
by MASSACHUS TS NSUTE
OF TECr'HNLOG
Yoko Saikachi
OCT
0 2 2009
B.A. French Literature, University of Toyo, 1999
LBRARE
LIBRARIES
M.S. Health Science, University of Tokyo, 2002
MSc Speech and Language Processing, University of Edinburgh, 2003
Submitted to the Harvard-MIT Division of Health Science and Technology in partial fulfillment of the requirements for the degree of
DOCTOR OF PHILOSOPHY
IN SPEECH AND HEARING BIOSCIENCE AND TECHNOLOGY AT THE
MASSACHUSETTS INSTITUE OF TECHNOLOGY
SEPTEMBER 2009
ARCNE8
© Yoko Saikachi. All rights reserved.
The author hereby grants MIT permission to reproduce and to distribute publicly paper and electronic copies of this thesis document in whole or in part.
Signature of Author:
Certified by:
Certified by:
Accepted by:
Harvard-MIT Di(ision of Health Sciences and Technology
/ August, 20,2009
e
Robert E. Hillman, Ph.D., CCC-SLP Associate Professor of Surgery, Harvard Medical School Thesis co-supervisor
f-f"
/\" VV/-- , "- r
Kenneth N. Stevens Clarence J. LeBel Professor of Electrical Engineering and Computer Science Professor of Health Sciences and Technology Thesis co-supervisor
Ram Sasisekharan, PhD Edwin Hood Taplin Professor of Health Sciences & Technology and Biological Engineering Director, Harvard-MIT Division of Health Sciences and Technology
Development, Perceptual Evaluation, and Acoustic Analysis of Amplitude-based FO control in Electrolarynx Speech
By
Yoko Saikachi
Submitted to the Harvard-MIT Division of Health Sciences and Technology Speech and Hearing Biosciences and Technology Program on August, 2009 in Partial Fulfillment of
the Requirements of the Degree of Doctor of Philosophy in Speech and Hearing Bioscience and Technology
ABSTRACT
An Electrolarynx (EL) is a battery-powered device that produces a sound that can be used to acoustically excite the vocal tract as a substitute for laryngeal voice production.
ELs provide laryngectomy patients with the basic capability to communicate, but current EL devices produce a mechanical speech quality which has been largely attributed to the lack of natural fundamental frequency (FO) variation. In order to improve the quality of EL speech, the present study aimed to develop and evaluate an automatic FO control scheme, in which FO was modulated based on variations in the root-mean-squared (RMS) amplitude of the EL speech signal. Recordings of declarative sentences produced by two male subjects before and after total laryngectomy were used to develop procedures for calculating FO contours for EL speech, and perceptual experiments and acoustic analyses were conducted to examine the impact of FO modulation on the quality and prosodic function of the EL speech. The results of perceptual experiments showed that modulating the FO of EL speech using a linear relationship between amplitude and frequency made it significantly more natural sounding than EL speech with constant FO, but also revealed some limitations in terms of communicating linguistic contrasts (distinction between question vs. statement and location of contrastive stress). Results are interpreted in relation to the acoustic characteristics of FO modified EL speech and discussed in terms of their clinical implications and suggestion for improved algorithms of FO control in EL speech.
Thesis Co-Supervisor: Robert Hillman, Ph.D., CCC-SLP
Title: Co-Director and Research Director, Center for Laryngeal Surgery and Voice Rehabilitation, MGH; Associate Professor of Surgery, HMS; Professor of Communication Sciences and Disorders, Massachusetts General Hospital Institute for Health Professions; HST Faculty
Thesis Co-Supervisor: Kenneth N. Stevens
Title: Clarence J. LeBel Professor of Electrical Engineering, Emeritus, Department of Electrical Engineering and Computer Science, MIT; Professor of Health Sciences and Technology, Emeritus, MIT
ACKNOWLEDGEMENTS
I would like to thank so many people for their support during my six years at MIT, but first and foremost, I would like to thank my thesis co-supervisors, Professor Robert Hillman and Professor Kenneth Stevens for their patient and continued encouragement, assistance, and invaluable advice and support. It was really fortunate to work as their
students during my entire time for Ph.D. and I will always remember this time period with great appreciation and a lot of meaning. I would also like to thank my thesis
committee chair, Professor Adam Albright, whose perceptive and encouraging comments were precious in achieving the goal of this study.
I am also thankful to many people whom I met in the course of the research. In particular, I am grateful to Geoff Meltzner and Harold Cheyne for being always available for technical issues and spending a lot of time and energy reading though the draft of the grant application and journal paper. I also want to thank the current and former members of the speech communication group at MIT and members of Center for Laryngeal
Surgery and Voice Rehabilitation at MGH, especially, Jennifer Bourque, Anatoly Goldstein, Marie Jett, James Heaton, Jim Kobler, Yoshihiko Kumai, Arlene Wint,
Stefanie Shattuck-Fufnagel, Seth Hall, Satra Ghosh, Hiroya Sadao, Janet Slifka, Helen Hanson, Takayuki Arai, and Joe Perkell for all of their assistance in recruiting
participants for perceptual experiments and learning the hardware and software used in the lab. I am also deeply grateful to the Japan-US Educational Commission and Mizuho Iwata for their support.
I would also like to give special thanks to graduate students in speech and hearing program and graduate members of the Research Laboratory of Electronic's Speech Communication Group and Center for Laryngeal Surgery and Voice Rehabilitation at MGH, especially Xuemin Chi, Elisabeth Hone, Xiaomin Mou, Julie Yoo, Sherry Zhao, Nancy Chen, Tony Okobi, Steven, Lulich, Cara Stepp, Daryush Mehta, Asako Masaki, Brad Buran, and Prakash Srinivasamurthy Ravi. I am also indebted many friends who have always been supportive throughout my life at MIT and in my projects, particularly Koichi, Rong, Yu, Tor, Shioulin, Ai, Edward, Ji-Eun, Manshi, Natsuko, Matt, and Yuki. And lastly, I owe many, many thanks for the love and support that my family and friends in Japan gave me over the years.
TABLE OF CONTENTS T itle Page ... ... 1 Abstract ... ... 3 Acknowledgements ... ... 4 Table of Contents ... 5 List of Figures...9 L ist of T ables ... 16 1. Introduction ... ... ... 19
1.1. Laryngectomy and alaryngeal speech ... 19
1.2. Electrolarynx speech ... 19
1.2.1. Electrolarynx ... 20
1.2.2. Acoustic deficits in EL Speech ... ... 20
1.2.3. Importance of FO in EL Speech... 22
1.2.4. Previous work on controlling FO in EL speech ... 23
1.3. Current Study ... ... ... 24
1.3.1. Overall goals of the dissertation ... ... 24
1.3.2. Outlines of the dissertation ... 26
2. Development and perceptual evaluation of FO control in EL Speech ... 27
2.1. M ethods... ... 27
2.1.1. Speech recordings ... 27
2.2. Perceptual evaluation ... ... 32
2.2.1. Generation of speech stimuli ... ... 32
2.2.2. Listeners ... ... 35
2.2.3. Experimental procedures ... 35
2.2.4. Data analysis ... 36
2.3. Results ... ... .. 37
2 .4 . D iscu ssion ... .. 39
3. Prosodic control in EL speech: intonation and contrastive Stress...41
3 .1. Introduction ... .. 4 1 3.1.1. General goals of the study ... 41
3.1.2. Prosody in EL speech... 41
3.1.3. C urrent study ... . 43
3.2. Methods ... ... 45
3.2.1. Sentence m aterials ... 45
3.2.2. Participants and recording procedures ... 46
3.2.3. FO settings for EL devices... 50
3.2.4. Generating the perceptual testing stimuli from the recorded material...50
3.2.4.1. Selecting the best tokens in EL speech with manual FO control...50
3.2.4.2. Generating amplitude-based FO control tokens ... 52
3.3. Assessment of linguistic contrasts in FO modified EL speech ... 55
3.3.1. Listeners ... 55
3.3.2. Experimental procedures... 55
3.4. Results... 57
3.4.1. Listener reliability ... 57
3.4.2. Perception of contrastive stress ... ... 57
3.4.3. Statistical analysis of perception of contrastive stress ... 60
3.4.4. Perception of intonation ... 63
3.4.4. Statistical analysis of perception of intonation ... 65
3.5. Discussion...69
4. Acoustic characteristics of the linguistic contrast in FO Modified EL Speech...73
4.1. Introduction ... 73
4.2. Methods...75
4.2.1. Speakers and speech materials ... 75
4.2.2. Acoustic analyses ... ... 76
4.2.2.1. Duration ... 76
4.2.2.2. FO peak ... 77
4.2.4. Reliability of acoustic measures ... .... 78
4.3. Acoustic characteristics in normal speech ... 78
4.3.1. Speech rate ... ... 79
4.3.2. Duration in normal speech ... 80
4.3.3. FO peak in normal speech ... 81
4.3.3.1. Statements: initial stress (version A) vs. final stress (version B).82 4.3.3.2. Question: initial stress (version C) vs. final stress (version D)...83
4.3.3.3. Question vs. statement... ... 83
4.4. Relationship between listener perception and acoustic characteristics in EL
sp eech ... ... 8 5
4.4.1. Contrastive stress... ... 85
4.4.1.1. Constant FO condition... 85
4.4.1.2. Manual FO control condition ... 88
4.4.1.3. Amplitude-based FO control condition ... 95
4.4.2. Intonation ... 99
4.4.2.1. Question vs. statement in sentences with final stress... 100
4.4.2.2. Question vs. statement in sentences with initial stress...03
4.5. D iscussion ... ... 105
4.5.1. Acoustic characteristics and perception of contrastive stress ... 105
4.5.2. Acoustic characteristics and perception of intonation ... 108
5. Summary and discussion ... 109
5.1. Summary of the findings ... 109
5.2. Limitations of the current study ...111
5.3. Future perspectives ... 112
Appendix. Synthesizing EL Speech Using the Klatt Formant Synthesizer ... 117
List of Figures
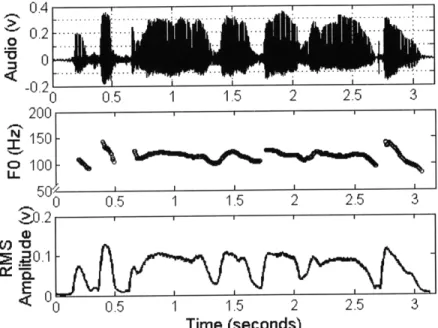
Figure 2.1 Audio waveforms, FO, and RMS amplitude over time for sentence 1, "His sister Mary and his brother George went along, too" recorded before
laryngectomy (pre-laryngectomy laryngeal speech) by speaker 1...29
Figure 2.2 Audio waveforms, FO, and RMS amplitude, and FO over time for sentence 1, recorded by speaker 1 using an EL after laryngectomy. ... 29
Figure 2.3 FO versus RMS amplitude and linear regression for sentence 1 produced by speaker 1. Correlation coefficients and regression coefficients are
show n at the bottom ... . .. 31
Figure 2.4 Measured original FO and amplitude-based estimates of FO as a function of time for sentence 1 produced by speaker 1...32
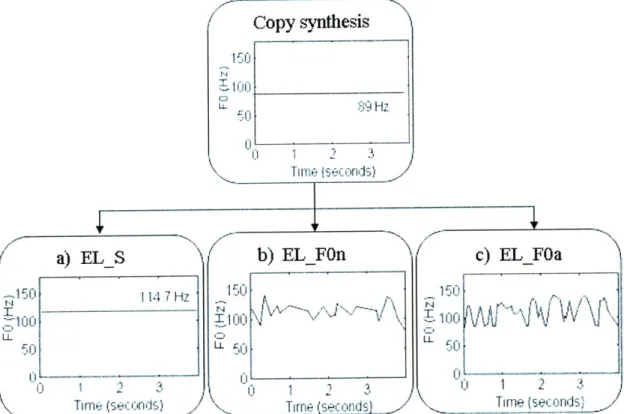
Figure 2.5 FO synthesis contours for sentence 1 and speaker 1 that were used to generate the EL speech stimuli for the perceptual experiments. "EL S"
corresponds to copy-synthesized EL speech with constant FO. "EL f0n"
and "EL"fOa" are the EL speech with FO modulations based on the pre-laryngectomy FO contour and EL speech amplitude respectively ... 34
Figure 3.1 Spectra of voicing sources directly recorded from Sola-Tone EL and
Tru-Tone EL. ... ... 47
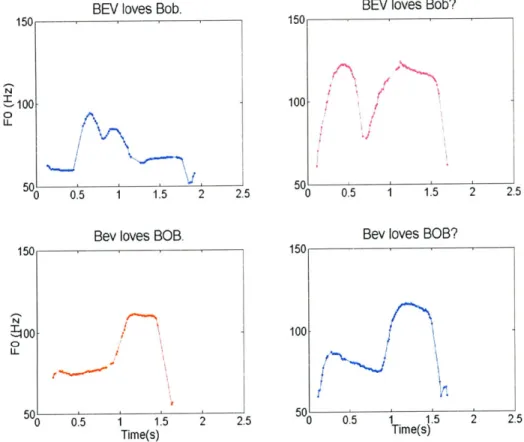
Figure 3.2 FO contours of four sentences, each per sentence type by one reference normal female speaker. Words assigned contrastive stresses are indicated by capitalized letters. ... 49
Figure 3.3 Left: FO contours of five repetitions by one of the male speakers, ml, produced with Tru-Tone EL with manual FO control. Right: FO contours for three repetitions by one of the male speakers, ml, produced with his normal voice. The utterance was sentence 1 (s 1) in statement with initial stress (BEVloves bob.) ... 52 Figure 3.4 FO contours of selected manual FO tokens four sentences for sentence 1,
each per sentence type by one of the male speakers, ml. Words assigned contrastive stresses are indicated by capitalized letters ... 52 Figure 3.5 Examples of computed FO contours based on the amplitude on the right
panel and its original constant FO on the left panel for sentence 1 in sentence with initial stress (BEV loves bob.) and final stress (Bev loves BOB) produced by speaker m l ... 54 Figure 3.6 Percentage of correct responses averaged across two sentences and four
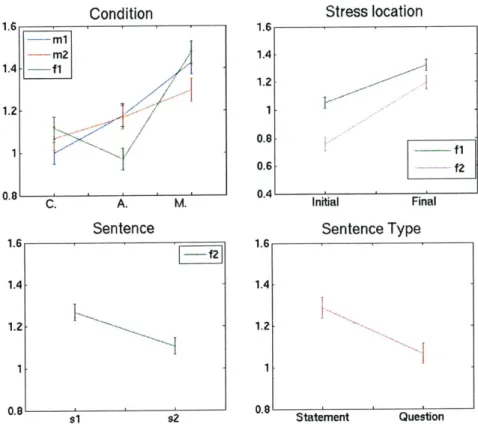
speakers for each performance as a function of condition (C.: Constant FO, A.: Amplitude-based FO, and M.: Manual FO control) ...58 Figure 3.7 Percentage of correct responses of contrastive stress for each speaker
averaged across two sentences as a function of condition ... 59 Figure 3.8 Mean and standard error of transformed percentage of correct responses of contrastive stress for each speaker ... 61 Figure 3.9 Mean and standard error of transformed percentage of correct responses of contrastive stress for each condition depending on the location of stress.62 Figure 3.10 Percentage of correct responses of intonation for each speaker averaged
Figure 3.11 Figure 3.11: Mean and standard error of transformed percentage of correct responses of intonation for each speaker for main effects ... 66 Figure 3.12 Mean and standard error of transformed percentage of correct responses of intonation for each condition depending on the sentence type...67 Figure 3.13 Mean and standard error of transformed percentage of correct responses of
contrastive for each condition depending on the location of stress and sentence type ... 68 Figure 4.1 Speech waveforms and broad-band spectrograms are shown of the
sentences produced by speaker ml (EL speech with constant FO). Word boundaries are indicated by vertical lines drawn below the
spectrogram s ... ... 76 Figure 4.2 A speech waveform, spectrogram and FO contour (in blue line) is shown
of the sentence 1 produced by speaker ml (EL speech with manual FO control). FO peaks for initial, second and final words are marked by red circles . ... 77 Figure 4.3 Mean speech rate (syllable/second) averaged over two sentences for each
speaker as a function of the condition ... 79 Figure 4.4 Mean duration in normal speech for the initial and final words, averaged
across two sentences and four speakers. The sentence versions are shown in T able 4.2 ... 80 Figure 4.5 Average FO peaks in normal speech for the four sentence versions. Each
peak represents the average for two sentences spoken by two male and female speakers. The sentence versions are described in Table 4.2. ... 82
Figure 4.6 Mean duration in EL speech with constant FO for the initial and final words, averaged across two sentences and four speakers. The sentence versions are shown in Table 4.2 ... 86 Figure 4.7 Mean percentage increase in word duration due to contrastive stress for
each speaker as a function of word position. Each point represents the average percentage across two sentences for each speaker ... 87 Figure 4.8 Percent correct for contrastive stress versus percentage increase in word
duration. Each point represents the average percentage across two
sentences for each speaker ... ... .. 88
Figure 4.9 Mean duration in EL speech with manual FO control for the initial and final words, averaged across two sentences and four speakers. The
sentence versions are shown in Table 4.2 ... 89 Figure 4.10 Average FO peaks in EL speech with manual FO control for the four
sentence versions. Each peak represents the average for two sentences spoken by two male and female speakers. The sentence versions are described in Table 4.2 ... 91 Figure 4.11 Mean and standard error of transformed percentage of correct responses of contrastive stress in EL speech with manual FO condition ...92 Figure 4.12 Percent correct for perception of contrastive stress in EL speech with
manual FO condition for speaker f2. The sentence versions (A, B, C, and D) are described in Table 4.2 ... ... 92 Figure 4.13 Word duration in EL speech with manual FO control for the initial words
Figure 4.14 Figure 4.15 Figure 4.16 Figure 4.17 Figure 4.18 Figure 4.19 Figure 4.20 Figure 4.21 4 .2 ... 9 3
FO peaks in EL speech with manual FO control for sentence version C (question with initial stress) for each sentence for speaker f2 ... 93 Percent correct for perception of contrastive stress in EL speech with manual FO condition for speaker m2. The sentence versions (A, B, C, and D) are described in Table 4.2. ... 94 Word duration in EL speech with manual FO control for the initial and final words for sentence 1 for speaker m2. The sentence versions are shown in
Table 4.2 ... ... ... 94 FO peaks in EL speech with manual FO control for sentence version D
(question with final stress) for sentence 1 for speaker m2 ... 94 Average FO peaks in EL speech with amplitude-based FO control for the
four sentence versions. Each peak represents the average for two sentences spoken by two male and female speakers. The sentence versions are described in Table 4.2 ... ... ...95
Average FO peaks in EL speech with amplitude-based FO control for each the four words. Each point represents the average for four sentence
versions for each speaker ... 96 Percent correct for perception of contrastive stress in EL speech with amplitude-based FO condition for speaker m2. The sentence versions (A, B,
C, and D) are described in Table 4.2 ... 97 FO peaks in EL speech with amplitude-based FO control for the initial (I.)
Figure 4.22 Figure 4.23 Figure 4.24 Figure 4.25 Figure 4.26 Figure 4.27 Figurer 4.28 Figure 4.29
and final (F.) word positions for each sentence version. The sentence versions are described in Table 4.2 ... 98 FO peaks in EL speech with amplitude-based FO control for the initial and
final words for sentence 1 (s 1) produced by speaker m2. The sentence versions are described in Table 4.2 ... 98
First formant (F 1) frequencies measured at the mid-point in vowel /a:/ in 'Bob' in sentence 2 for EL speech with amplitude-based FO control and in normal speech produced by speaker m2. The sentence versions are
described in Table 4.2 ... 99 Percent correct for perception of intonation in EL speech with manual FO control condition for speaker m l ... ... 99 FO contours in normal speech for sentence 2 for sentence version C (question with initial stress) on the right and for version D (question with final stress) produced by speaker ml ... 100 FO contours in EL speech with manual FO control for sentence version D (question with final stress) for sentence 1 (on the left) and sentence 2 (on the right) produced by speaker m2 ... 101 FO contours in EL speech with manual FO control for sentence version B (statement with final stress)... 101 FO contours in EL speech with manual FO control for sentence version B (statement with final stress) ... ... 102 FO contours in normal speech for sentence version B (statement with final stress) ... ... 102
Figure 4.30 FO contours in EL speech with manual FO control condition for sentence version C (question with initial stress) which achieved relatively low performance: (a) FO contour produced by speaker fl with accuracy of 30%,
(b) FO contour produced by speaker m2 with an accuracy of 50%...103 Figure 4.31 FO contour in EL speech with manual FO control condition for sentence
version C (question with initial stress) which achieved relatively higher performance (90%) produced by speaker f2 ... ... 104 Figure Al: Comparison of spectra obtained at mid-vowel in EL speech. The original
/E/ (top left) vs. synthesized /e/ in "Mary" (bottom left). The original /u:/ (top right) vs. synthesized /u:/ (bottom right) in "too" (sentence 1, speaker 1)... ... 119
List of Tables
Table 2.1 Values of intercept, slopes, and correlation coefficients for the different speakers and sentences ... ...31 Table 2.2 Number and percentage of responses showing preference for the first
token listed in each paired comparison ... 38 Table 2.3 Overall paired comparison and visual analog scale values ... 38 Table 3.1 Mean percentage accuracy of identification of stress and intonation
contrasts in normal and EL speech (from Gandour, Weinberg, &
Kosowsky, 1982)... 42 Table 3.2 Vocal tasks recorded that vary intonation and contrastive stress...46 Table 3.3 Sentence stimuli to investigate intonation and contrastive stress used in
chapter three and chapter four. Target sentences were preceded by prompt sentences and contrastive-stressed words in target sentences were printed in large capital letters and underlined. In addition, a semantic context was enclosed within parentheses ... 48 Table 3.4 FO (Hz) settings of EL devices ... 50 Table 3.5 The FO range (Hz) for selected manual FO tokens and regression
coefficients used to calculate the FO contour based on the RMS amplitude contour for each speaker ... 53
Table 3.6 Mean of percent correct depending on the condition for each speaker averaged over two sentences... 58 Table 3.7 Results of ANOVAs of the stress performance for each speaker
Table 3.8 Mean of percent correct depending on the condition for each speaker averaged over two sentences... 64 Table 3.9.a Results of ANOVAs of the intonation performance for each speaker
(m ain effects)(p<.001) ... 65 Table 3.9.b Results of ANOVAs of the intonation performance for each speaker
(interactions)(p< 0.001) ... 65 Table 3.10 Results of Pairwise comparisons of the intonation performance for
statement with stress on final word for each speaker (p< 0.001)...69 Table 4.1 Speech rate (syllable / second) averaged across two sentences for
condition (values in parentheses are standard deviations) ... 79 Table 4.2 Mean duration (ms) of words in normal speech averaged across two
sentences produced by four speakers (values in parentheses are standard deviations) ... 80 Table 4.3 Mean fundamental frequency (Hz) of each word in normal speech
averaged across two sentences for two male and two female speakers (values in parentheses are standard deviations) ...81 Table 4.4 Mean duration (ms) of words in EL speech constant FO averaged across
two sentences produced by four speakers (values in parentheses are standard deviations) ... 86 Table 4.5 Mean percentage increase in duration due to the contrastive stress
averaged over two sentences and four speakers ...86 Table 4.6 Mean duration (ms) of words in EL speech with manual FO control
averaged across two sentences produced by four speakers (values in parentheses are standard deviations) ... 89 Table 4.7 Mean fundamental frequency (Hz) of each word in EL speech with
manual FO control averaged across two sentences for two male and two female speakers (values in parentheses are standard deviations) ... 90 Table 4.8 Mean fundamental frequency (Hz) of each word in EL speech with
amplitude-based FO averaged across two sentences for two male and two female speakers (values in parentheses are standard deviations) ... 95 Table 4.9 Mean Fl frequency (Hz) measured at mid-point of vowel /a:/ in 'Bob' in
sentence 1 in EL speech with amplitude-based FO control and in normal speech for speaker m2 ... ... ... 99 Table 4.10 Difference in FO (semitone) and time as well as FO slope between the
beginning of the FO rise and peak during the final word in normal speech and in EL speech with manual FO control for speaker f2. FO (semitone) was calculated by taking the FO value at the beginning of the FO rise as the base frequency ... .. 103 Table 4.11 Percent correct for perception of intonation and contrastive stress for
sentence version C (Question with initial stress) for each speaker and sentence ... ... ... ... 103
Chapter 1
Introduction
1.1. Laryngectomy and Alaryngeal Speech
Laryngectomy, usually necessitated by laryngeal cancer, involves the surgical removal of the entire larynx. This also causes the respiratory tract to be separated from the vocal tract, including the oral and nasal cavities. Consequently, breathing now occurs via the tracheostoma, an opening that is created by attaching the trachea to the skin in the neck. Due to the loss of larynx and the vocal folds, laryngectomy patients are no longer be able to produce normal voice. However, the vocal tract and articulators are still intact and it is possible to replace phonation by an alternative voicing source in order to speak. The speech produced by the alternative voicing source is called alaryngeal speech and there are three main types; esophageal, tracheo-esophageal (TE), and Electrolarynx (EL). The focus of this dissertation is on enhancement of speech produced by EL. This chapter will therefore introduce basic background related to main acoustic deficits associated with EL speech, followed by a summary of the previous studies on the enhancement of the quality of EL speech. Lastly, the general objectives and overview of the dissertation will be presented.
1.2.1. Electrolarynx
EL is a battery-powered device that produces a sound that can be used to acoustically excite the vocal tract as a substitute for laryngeal voice production. In the United States, the prevalence of EL use among patients is as high as 85% at one-month post-laryngectomy (Hillman, Walsh, Wolf, Fisher, & Hong, 1998), with multiple studies reporting longer term use of an EL as a primary mode of communication by more than half of laryngectomy patients (Gray & Konrad, 1976; Hillman et al., 1998; Morris, Smith, Van Demark, & Maves, 1992). Two ELs are currently available for use by laryngectomy patients: the neck-type (transcervical or trancutaneous) and mouth-type (transoral or
intraoral). The current study focused on a neck-type device because this is by far the most commonly used type of EL.
1.2.2. Acoustic deficits of EL speech
ELs provide laryngectomy patients with the basic capability to communicate verbally (using oral speech production), provided conditions are sufficiently favorable
(e.g., there is minimal competing noise, the listener has normal hearing and is familiar with EL speech). However, EL speech contains persistent acoustic deficits that result in reduced intelligibility and contribute to its "mechanical" or "non-human" (robotic) speech quality that often draws undesirable attention to the user. EL users have a particularly difficult time communicating with individuals who are unfamiliar with EL speech, which can make telephone use especially problematic. The main acoustic deficits associated with EL speech are (a) lack of normal fundamental frequency (FO) variation (Ma, Espy-Wilson, & MacAuslan, 1999; Meltzner & Hillman, 2005; Uemi, Ifukube,
Takahashi, & Matsushima, 1994); (b) the presence of the directly radiated signal (i.e., the buzz from the EL that is not filtered by the user's vocal tract but radiates directly to the
listener) (Cole, Stridharan, Moody, & Geva, 1997; Espy-Wilson, Chari, MacAuslan, Huang, & Walsh, 1998; Liu, Zhao, Wan, & Wang, 2006; Niu, Wan, Wang, & Liu, 2003; Pandey, Bhandarkar, Bachher, & Lehana, 2002; Pratapwar, Pandey, & Lehana, 2003):
and (c) an improper source spectrum (Qi & Weinberg, 1991; Weiss, Yeni-Komshian, & Heinz, 1979).
The contributions of precise FO control in natural speech to prosodic and segmental contexts (i.e., signaling stress, syntactic and emotional information) are not possible with current EL technology. External placement of the EL and its interface with the neck contribute a direct-path signal to the intended speech signal that is transmitted via the vocal tract. The last deficit, an improper source spectrum, arises from a
combination of the EL transducer design and the properties of the neck tissue. Existing EL transducers use a piston hitting a plastic disk to produce a mechanical "buzz". For example, the waveform generated by the Servox EL consists of a train of sharp impulses followed by highly damped oscillations (Qi & Weinberg, 1991). The spectrum of this signal is characterized by a broadband output with a spectral maximum around 2 kHz, and a substantial deficit in energy below 400-500Hz. This impulse-train-like signal then passes through the neck tissue transfer function, characterized by Meltzner et al. (2003) as low-pass, with a constant maximum gain between 100 Hz and a corner frequency in the range 200-400 Hz, then rolling off with a slope about -9 dB/octave until 3000 Hz where the magnitude becomes constant until 4000 Hz. Meltzner et al. (2003) also showed that other important properties may contribute to the poor quality of EL speech both in
terms of the improper acoustic characteristics and location of the voicing source
provided by the EL transducers, and modifications in vocal tract transfer functions due to the impact of the laryngectomy operation on the upper airway.
1.2.3. Importance of FO in EL speech
Several studies have demonstrated that significant improvements in EL speech could be accomplished by adding appropriate control of FO. Some of the work has illustrated the linguistic deficits caused by a lack of FO control (Gandour & Weinberg,
1983, 1984; Weinberg & Gandour, 1986). For example, Gandour and Weinberg (1983) conducted perceptual experiments in order to determine the degree to which EL speakers were able to achieve intonational contrasts. Results showed that users of the electrolarynx were generally unable to achieve intonational distinctions with a flat FO contour,
indicating the critical role of FO modulation. It has been also indicated that FO cues may be useful for signaling segmental information. Recent work has shown that speech intelligibility was significantly better with variable intonation produced by a laryngectomy patient using an EL with manual FO control (Tru-Tone, Griffin laboratories) than it was with either the resynthesized flat intonation or the fixed-frequency intonation (Watson & Schlauch, 2009).
Lack of adequate FO control has been shown to be even more detrimental to the intelligibility of EL users who speak tone languages such as Thai, Mandarin, and Cantonese (Gandour, Weinberg, Petty, & Dardarananda, 1988; Liu, Wan, Wang, & Lu, 2006; Ng, Gilbert, & Lerman, 2001), where FO contours contributed most to the
amplitude contour) (Ng et al., 2001). More recent work has examined the impact of aberrant acoustic properties on the quality of EL speech. Meltzner and Hillman (2005) demonstrated that the addition of normal FO variation was associated with the largest
improvements in the "naturalness" of EL speech, as compared to other acoustic enhancements (compensation for low frequency deficit and reduction of noise radiated directly from the device). Ma et al. (1999) developed a post-processing scheme in which a cepstral-based method was used to replace the original FO contour of EL speech with a normal FO pattern and showed that adding FO variation clearly improved naturalness of EL speech. Although this post-processing technique was promising, its practical applications are limited because it requires pre-recording EL speech and cannot be implemented in real-time.
1.2.4. Previous work on controlling FO in EL speech
Adding the proper FO variation to EL speech in real-time is very challenging because it would require the means to estimate what pitch the speaker intends to use (i.e.,
access to underlying linguistic and/or neural processes), or utilization of alternative signals or control sources (e.g., Kakita & Hirama, 1989; Sekey & Hanson, 1982; Uemi et al., 1994). In one such approach, Uemi et al. (1994) used air pressure measurements obtained from a resistive component placed over the stoma to control the fundamental frequency of an EL, but only 2 of 16 subjects were able to master control of the device. Other work has demonstrated the potential feasibility of accessing laryngeal neuromotor signals post-laryngectomy to use in controlling the onset, offset, and FO of an EL.
effective in all EL users (Goldstein, 2003; Goldstein, Heaton, Kobler, Stanley, & Hillman, 2004; Heaton et al., 2004).
Other possibilities for controlling FO in EL speech include implementing a fixed FO contour (van Geel, 1982; Secom MYVOICE). For example, MYVOICE (Secom) produces a high FO frequency when the switch of the EL is turned on, and the FO then falls. This is more natural than a flat FO, but as the FO variation pattern is fixed, the device cannot be used with the intention of adding various intonation patterns, and it may lead to confusion of the speaker's intent (e.g., a question with declarative prosody). There have been attempts to include manual control of FO in the design of some EL devices (Choi, Park, Lee, & Kim, 2001; Galyas, Branderud, & McAllister, 1982; Kikuchi & Kasuya, 2004; Takahashi, Nakao, Kikuchi, & Kaga, 2005; Tru-Tone, Griffin
Laboratories), but there is considerable skepticism that manual control (e.g., pushing a button with a finger) can successfully approximate the very precise and rapid adjustments in FO that occur during normal speech production. Furthermore, learning to effectively control FO manually may be particularly difficult for the majority of laryngectomy patients due to their advanced age.
1.3. Current Study
1.3.1. Overall goals of the dissertation
This dissertation describes one approach that we have been developing to automatically control the FO of EL speech. We are proposing to modulate the FO of EL utterances based on variation in the root-mean-squared (RMS) amplitude of the EL
speech signal. In previous acoustic studies of the speech of patients before (laryngeal speech) and after (EL speech) total laryngectomy, we found significant fluctuations in the amplitude of EL speech (Saikachi, Hillman, & Stevens, 2005). In particular, there was a gradual decrease of amplitude during vowels at the end of declarative utterances, which was similar to what we observed in the corresponding pre-laryngectomy speech.
Furthermore, there were generally positive correlations between FO and amplitude in pre-laryngectomy (laryngeal) speech (i.e., the shape of the amplitude-time curves were similar to the FO-time curves). Based on these observations and previous finding, we hypothesized that the amplitude variations in EL speech could be used as a basis for effectively predicting, and ultimately controlling, the FO of EL speech in close to real-time.
This work is motivated by a long-term goal to develop a real-time speech
processing technology to remedy the acoustic deficits in EL speech and thereby improve EL communication, and the quality of life, for laryngectomy patients. Enabling users to automatically control FO may improve communication efficiency, improve social interaction, and enhance overall communication satisfaction. Furthermore, the findings obtained from this study may provide the basis for developing intervention strategies that improve prosodic control capabilities for communicative function. The overall goal of this investigation was to evaluate the viability of the proposed approach by: 1)
developing procedures for estimating FO based on the amplitude variations in EL speech, 2) evaluating the impact of amplitude-based modulation of FO on the quality of EL speech in perceptual experiments, 3) determining the limitations of the developed
approach in communicating linguistic contrast, and 4) determining the acoustical basis of the perceptual characteristics of FO modified EL speech.
1.3.2. Outlines of the dissertation
To achieve these general research goals, the experiments reported on in the different chapters concentrate on the development and evaluation of FO control scheme. The dissertation is organized as follows:
The first part of Chapter two describes the motivations and procedures for developing the amplitude based FO control scheme. The second part evaluates the developed control scheme in terms of improvement in overall naturalness using formal perceptual experiments.
Building on the results reported in Chapter two, Chapter three and four will more fully examine the ability and limitation of amplitude based FO control in prosodic aspects. More specifically, Chapter three will examine the impact of FO modulation on
communicating linguistic contrast. Chapter four will examine the acoustic basis of the perceptual results obtained in Chapter three and the relationship between perceptual results and acoustic analysis will be discussed.
Chapter five will summarize overall results and discuss clinical implication and limitation of the current study followed by future research perspectives.
Chapter 2
Development and Perceptual Evaluation of FO
Control in EL Speech
2.1. Methods
2.1.1. Speech Recordings
In the present study, two declarative sentences from the "Zoo passage" produced by two male subjects (referred to as "speakers 1 and 2" hereafter) before and after total laryngectomy (pre-laryngectomy speech vs. EL speech) were selected from the
recordings made for the Veterans Administration Cooperative Study # 268 (VA-CSP 268). Recording of subjects from this data set who had acceptable pre-laryngectomy voice quality have been particularly useful for assessing the acoustic differences between normal (laryngeal) and EL speech, and for providing acoustic "targets" to improve EL speech (Goldstein et al., 2004; Heaton et al, 2004; Meltzner, 2003; Meltzner & Hillman, 2005). Sentence 1 was "His sister Mary and his brother George went along, too." And sentence 2 was "You can see that they didn't have far to go." These declarative sentences were chosen because each one terminated with vowels in which amplitude decreased
consistently in both the pre-laryngectomy and EL speech of the two speakers (Saikachi et al., 2005).
The two speakers were chosen because they used EL speech as their primary mode of communication, the level of interference due to directly radiated EL noise was relatively low in their post-laryngectomy recordings, and their pre-laryngectomy speech was found to have relatively normal voice quality (tumor location minimally affected voice production). The two speakers both used a neck-placed Servox EL, but were
recorded at different VA hospitals. Of the several post-laryngectomy recordings that were made for each speaker, only the final EL speech recordings were used in this study (30 months post-laryngectomy for speaker 1 and 12 months post-laryngectomy for speaker 2). All recordings were made in a quiet environment using a Marantz model 220 recorder and a Radio Shack model 33-1071 microphone, situated 6 to 12 inches from the speakers (Hillman et al., 1998). An audio signal acquisition and editing software package
(Syntrillium Software's Cool Edit 2000) was used to digitize the speech at 32 kHz. For this study, the speech was appropriately low pass filtered and downsampled to 10 kHz.
2.1.2. Amplitude based FO estimation
Figures 2.1 and Figure 2.2 show representative data from pre-laryngectomy and EL speech respectively, including the audio waveform, FO contour, and RMS amplitude as a function of time during sentence 1. FO was estimated using autocorrelation analysis (Markel & Gray, 1976). Both FO and RMS amplitude were calculated every 5 ms over 40 ms intervals. Note that there is a fluctuation in amplitude over the whole utterance in both the pre-laryngectomy and EL speech.
0)
( .1
E
00 0.5 1 1.5 2 2.5 3
Time (seconds)
Figure 2.1: Audio waveforms, FO, and RMS amplitude over time for sentence 1, "His sister Mary and his brother George went along, too" recorded before
laryngectomy (prelaryngectomy laryngeal speech).
200 150 10C ,- 5 5C
a 0.2
0.1 < 0 0.5 1 1.5 2 2.5 Time (seconds) 3 3.5 4Figure 2.2: Audio waveforms, FO, and RMS amplitude over time for sentence 1, "His sister Mary and his brother George went along, too" recorded after
laryngectomy (using an EL) by speaker 1.
0 0.5 1 1.5 2 2.5 3 3.5 4
S0.5 1 1.5 2 2.5 3 3.5 4
The relationship between FO and RMS amplitude in pre-laryngectomy speech served as the basis for using the amplitude variation of EL speech to generate an FO contour. More specifically, for each sentence and each speaker, the linear regression coefficients (intercept and slope) between FO and amplitude were calculated for the pre-laryngectomy sentences in order to model FO as a function of RMS amplitude. Only the voiced parts in the sentences were included for the computation. FO values that were miscalculated by the autocorrelation methods (either halved or doubled) were also excluded from the analysis.
Figure 2.3 shows FO plotted against RMS amplitude for a pre-laryngectomy recording of speaker 1 producing sentence 1. Also shown in Figure 2.3 is the straight line that best fits the data, which clearly reflects the positive relationship between RMS amplitude and FO. Table 2.1 summarizes the regression coefficients and Pearson r
correlation coefficients for both sentences produced by each of the two speakers. FO and RMS amplitude were significantly correlated in each sentence (p<.001), and the
regression coefficients varied depending on the speakers and sentences.
FO contours for the EL speech were then derived from the RMS amplitude variation in EL speech using the following equation for each sentence and speaker:
Estimated_FO = kl + k2 x RMS_amplitude (1)
where kl and k2 are respectively the intercept and slope of the regression coefficients obtained from analyzing the pre-laryngectomy speech. Figure 2.4 shows an example of an amplitude-based estimate of an FO contour superimposed on the original FO contour for sentence 1 produced by speaker 1 using an EL.
0.02 0.04 0.06 0.08
RMS amplitude (v)
0.1 0.12 0.14
Figure 2.3: FO versus RMS amplitude and linear regression for sentence 1 produced by speaker 1. Correlation coefficients and regression coefficients are shown at the bottom.
Subject 1 Subject 2
Sentence 1 Sentence 2 Sentence 1 Sentence 2
Intercept (Hz) 91.2 102.6 92.0 91.4
Slope (Hz/Volts) 294.8 262.4 190.5 182.2
Correlation coefficients: R2 .57* .44* .39* .38*
Table 2.1: Values of intercept, slopes, and correlation coefficients for the different speakers and sentences (*p < .001).
160 140 F 20 F 80- 60- 40- 20-* o * -R2 = .57 y = 91.2 + 294.8x 1 I
200 150 N C-LL. 100 Original FO 0 0.5 1 1.5 2 2.5 3 3.5 4 Time (seconds)
Figure 2.4: Measured original FO and amplitude-based estimates of FO as a function of time for sentence 1 produced by speaker 1.
2.2.
Perceptual Evaluation
A perceptual experiment was conducted in order to determine whether the
proposed approach for controlling FO based on amplitude could significantly improve the naturalness of EL speech, and whether this approach was comparable to synthesizing EL speech with an FO contour based on pre-laryngectomy speech.
2.2.1. Generation of speech stimuli
The first step in generating stimuli (speech tokens) to perceptually evaluate the impact of amplitude-based FO modulation on the quality of EL speech was to synthesize EL speech using the Klatt formant synthesizer (KLSYN). KLSYN is a well established formant synthesizer that allows for direct control of both source and filter characteristics,
and it has been shown to have the capability of producing high quality copy synthesis for normal speech (Hanson, 1995; Klatt, 1980; Klatt, Chapter 3; Klatt & Klatt, 1990) as well as for pathological voices (Bangayan, Christopher, Alwan, Kreiman, & Gerratt, 1997). The motivation behind using this method is that synthesis can provide a tool through which the characteristics of EL speech and pre-laryngectomy speech can be compared at
the level of the synthesis parameters, i.e., analysis-by-synthesis. After being
parameterized, EL speech can be modified via individual or combinations of parameters to examine the resulting quality of the modified EL speech. The procedures for
synthesizing EL speech are included in the Appendix. Once copy-synthesis of the original EL speech samples was accomplished, the FO synthesis parameter was manipulated to produce EL stimuli with the desired FO contours.
The overall scheme for generating speech tokens is shown in Figure 2.5. For each sentence-speaker condition, three versions of each sentence were generated from the copy-synthesized EL speech by simply modifying the FO synthesis parameters:
(a) EL speech with constant FO (EL_S);
(b) EL speech with FO modulation based on the FO contour of pre-laryngectomy speech (EL_fOn);
(c) EL speech with FO modulation based on the amplitude of the EL speech (EL fOa).
This resulted in 6 sentences per speaker, or a total of 12 sentences. The constant FO values for the EL_S sentences were set to the average FO of the pre-laryngectomy versions of the sentences, to minimize any confounding factor that could be related to differences in average FO when comparing different stimuli. For the EL_f0a sentences,
the FO was derived from the linear relationship between FO and amplitude in the pre-laryngectomy speech samples as described previously using Eq. (1). The computed FO was normalized such that the mean and variance of the FO were matched to those in the pre-laryngectomy versions of the sentences.
Copy synthesis
170
100
I0I
C) 1 2 3
a) ELS
Krj~'
b) EL_Fn 1s'x 'rJi ) //" c) ELF0aLL I L C
501 0 50
S 20 0 1 2 u 1 2 3
T...
Time se,:,,:t... ) . Tle¢Sf~lf3 \ i- eoidsTime ,
Figure 2.5: FO synthesis contours for sentence 1 and speaker 1 that were used to generate the EL speech stimuli for the perceptual experiments. "EL_S" corresponds to copy-synthesized EL speech with constant FO. "EL_fOn" and "EL"fOa" are the EL speech with FO modulations based on the pre-laryngectomy FO contour and EL speech amplitude respectively.
For the EL_f0n sentences, adding the pre-laryngectomy FO contours involved two steps. First, the pre-laryngectomy and EL sentences were time aligned using the
Pitch-Synchronous Overlap-Add (PSOLA) algorithm (Moulines & Charpentier, 1990), such that the phones of both sentences had the same onset times and duration. The FO contours
obtained from the time-scaled pre-laryngectomy versions of the sentences were then used to set the FO synthesis parameters to generate the EL_fOn versions of the sentences.
2.2.2. Listeners
A group of 12 normal hearing graduate students recruited from MIT and the MGH Institute of Health Professions (six females and six males) served as listeners.
2.2.2. Experimental procedures.
The synthesized stimuli were perceptually evaluated using a combination of two approaches: the Method of Paired Comparisons (PC) (Meltzner & Hillman, 2005; Torgerson, 1957) and visual analog scaling (VAS).
Perceptual judgments were carried out within each of the four speaker-sentence conditions (2 speakers x 2 sentences = 4 conditions). Within each speaker-sentence condition, all combinations of pairs of the 3 synthesized speech tokens (3 pairs) were presented twice to listeners to total 6 paired-comparisons per condition. Thus, a total of 24 pairs of speech stimuli were presented to each listener (3 pairs x 2 repetitions x 4 conditions = 24), which resulted in a total of 288 listener responses for the entire study (24 stimulus pairs x 12 listeners = 288).
Before judgments were made within each of the four speaker-sentence conditions, all three speech tokens (EL_S, EL_fOa, EL_fDn) for that condition were played to the listeners to familiarize them with the quality of the different stimuli. The
pre-laryngectomy speech sample associated with the condition being evaluated was also played as a reference for the perceptual judgments. This allowed the pre-laryngectomy
version of each sentence to act as an anchor so that all listeners would have a common frame of reference to make their judgments.
Each listener was seated in a sound-isolated booth and was instructed to indicate on a computer screen which of the two tokens in each pair sounded most like normal, natural speech. Then the listener was asked to rate how different the chosen token was from normal natural speech using a VAS on the computer screen. The VAS was 10 cm long, with the left end labeled Not At All Different and the right end labeled Very
Different. The presentation order of four speaker-sentence conditions was randomized for
each listener. Participants were allowed to listen to the pre-laryngectomy speech token associated with each condition (anchor) as often as they wanted during both PC and VAS components of the experiment.
22.4. Data analysis
The PC data were first analyzed by conducting binomial testing in order to test the significance of the results. The PC data were also converted to scale rankings using Thurstone's Law of Comparative Judgment (Thurstone, 1927), in which speech tokens that were most consistently judged to sound more like normal, natural speech across all listeners were given a higher scale value (Meltzner & Hillman, 2005). The data from the VAS procedure were analyzed by computing the distance in centimeters from the left end of the VAS. These distances were used to calculate a mean distance for each speech type and taken as an estimate of how different a listener judged a speech token to be from natural, normal speech.
2.2.
Results
The reliability of listeners was evaluated by calculating the percentages of agreement in preference judgments made by each listener in response to the repeated presentation of all token pairs. The average intralistener agreement across all four speaker-sentence conditions (speaker 1-sentence 1, speaker 1-sentence2, speaker2-sentencel, & speaker2-sentence2) for the PC task was 80.0 ± 16.1% (the range was
50-100%), using an exact agreement statistic (Kreiman, Gerratt, Kempster, Erman, & Berke, 1993). Intralistener agreement across all four conditions for the VAS task was evaluated
using Pearson's r and was .83 ± .16 (the range was .52-.99).
The PC response data are summarized in Table 2.2. Shown are the total number and percentage of times that listeners judged each of the three different speech tokens to
sound more normal or natural than the other two tokens in paired comparisons. The binomial test showed that there was a significant overall preference by the listeners for
the FO modulated EL speech (EL_fOa and EL_fOn tokens) as compared with the EL speech having constant FO (ELS tokens) (p<0.01). The exception was the EL_f0a vs. EL_S token pair for sentence 2 produced by Speaker 1. Conversely, there was no significant preference for the EL_f0n tokens over EL_fOa tokens.
Table 2.2: Number and percentage of responses listed in each paired comparison (*p < .01).
showing preference for the first token
A summary of the overall results obtained using the PC and VAS procedures across all four speaker-sentence conditions is shown in Table 2.3. Note that speech types judged to be closer to normal speech received higher PC scale values and lower VAS
values. The rankings of the speech types by the two scaling procedures were identical. EL speech with amplitude-modulated FO ("EL_f0a") was judged to sound better than EL speech with constant FO ("EL_S"), but not quite as good as EL speech produced with the pre-laryngectomy FO contour ("EL_f0n").
PC VAS
Speech Type Rank Scale Value Rank Rating Sm. N
EL f0n 1 1.63 1 6.5 0.17 117
EL f0a 2 1.37 2 6.9 0.18 107
EL S 3 0.0 3 7.3 0.09 13
Table 2.3: Overall paired comparison and visual analog scale values
Paired Comparison Subject 1 Subject 2 Overall
sl s2 sl s2 EL fDa vs. EL S 95.8% 70.8% 95.8% 95.8% 89.6% 23/24* 17/24 23/24* 23/24* 86/96* EL fOn vs. EL S 88.0% 91.0% 92.0% 100.0% 96.0% 21/24* 20/22* 22/24* 23/23* 89/93* EL fOn vs. EL f0a 56.5% 62.5% 29.2% 75.0% 55.8% 13/23 15/24 7/24 18/24 53/93
2.3. Discussion
In this chapter, an approach for amplitude-based control of FO in EL speech was developed and its impact on the quality of EL speech was examined. The approach utilized the positive linear relationship that was observed between FO and amplitude in the pre-laryngectomy speech of EL users. The results of both PC and VAS experiments demonstrated that EL speech with amplitude-based FO-modulation was judged to sound more natural than EL speech with constant FO, thus lending preliminary support for using this simple linear relationship to compute an FO contour for EL speech. Furthermore, analysis of the PC data using the binomial testing showed that there was no significant preference for the pre-laryngectomy FO contour over amplitude-based FO-modulation implying that the listeners found these two types of stimuli relatively similar to each other. The scale values computed by analyzing the PC data also indicate that the perceptual distance between these two types of stimuli was relatively small. Compared to previously implemented FO control methods using a finger-controlled button (Choi et al., 2001; Galyas, et al., 1982; Kikuchi & Kasuya, 2004; Takahashi et al, 2005; Tru-Tone) or stoma air pressure measurements (Sekey & Hanson, 1982; Uemi et al., 1994), the proposed FO control scheme does not require access to alternative signals or control sources and may not require the extensive experience or training. Furthermore, this approach has the potential to be implemented with relative ease in close to real-time using a prototype (portable) DSP-based
hardware platform. Possible configurations will be discussed in Chapter 6.
the naturalness of declarative sentences. As described in chapter 1, the FO contour is important not only for the perceived naturalness of the EL speech but also for communicating linguistic contrasts such as intonation (e.g., declarative vs. interrogative) and contrastive stress. For example, interrogative sentences are associated with a maximal rise in FO at the terminal portion of the utterance, while declarative versions are associated with a fall in the FO during the terminal portion (Atkinson, 1973, 1976; Eady & Cooper, 1986). It has been also shown that stressed words have higher FO values than when they are unstressed (O'Shaughnessy, 1979). Furthermore, in stress-accent languages, such as American English and Dutch, stress and accent were separate linguistic constructs and both have unique phonetic
correlates (Okobi, 2006; Sluijter, 1995; Sluijter, Heuven, & Pacilly, 1997). More specifically, in these languages, FO movement and overall intensity are acoustic correlates of pitch accents but not of stress, which is characterized by the longer duration and high-frequency emphasis. The next two chapters investigated the capabilities of amplitude-based control of FO in different prosodic contexts by
Chapter 3
Prosodic Control in FO modified EL Speech:
Intonation and Contrastive Stress
3.1. Introduction
3.1.1. General goals of the study
Based on the results of chapter 2, the study described in this chapter more fully evaluated the algorithms for FO control. More specifically, formal perceptual evaluations of the FO-modified EL speech were conducted to investigate the prosodic control abilities of amplitude-based FO control. Prosody refers to aspects of the speech signal that mark stress, rhythm, intonation, and pause structure (Lehiste, 1976). Acoustic parameters associated with prosody include FO, amplitude, duration, and segmental quality (Cooper, Eady, & Mueller, 1985; Eady & Cooper, 1986; Fry, 1958; Morton & Jassem, 1965; Shattuck-Hufnagel & Turk, 1996). Prosodic cues supplement the linguistic structure of the spoken message (Kent & Read, 2001), indicate the speaker's emotional state (Williams & Stevens, 1972), and are important for distinguishing between grammatical forms such as questions and statements (cf. Eady & Cooper, 1986).
As mentioned in Chapter one, a series of studies have investigated prosody in EL speakers. The prosodic functions that were investigated concerned perception and production of noun-verb contrasts ("OBject" versus "obJECT") (Gandour, Weinberg, & Garzione, 1983; Gandour, Weinberg, & Petty, 1986), minimally distinguished noun compounds and noun phrases ("BLACKboard" versus "black Board") (Gandour, Weinberg, & Kosowsky, 1982; Gandour & Weinberg, 1986), as well as contrasts on sentence level (question versus statements, and contrastive stress) (Gandour & Weinberg,
1982, 1983, 1984). The latter contrasts concerned sentences such as "Bev loves Bob", which could be produced as question or statement, and in which either name could be contrasted ("BEV" versus "Bev", and "BOB" versus "Bob").
Group Intonation Contrastive Lexical Stress Syntactic Stress
stress
Normal 99.7 97.7 94.4 98.8
EL 54.0 79.9 82.8 81.8
Table 3.1: Mean percentage accuracy of identification of stress and intonation contrasts in normal and EL speech (from Gandour, Weinberg, & Kosowsky, 1982).
The summary of the results of these perceptual experiments is shown in Table 3.1., which revealed that listeners were able to identify the intended stress contrasts with relatively high accuracy in the EL speakers even without FO variations. Acoustic analysis further showed that alaryngeal speakers using the EL marked contrastive stress
effectively by increasing the duration of stressed syllables and by increasing the duration of pauses adjacent to stressed syllables (Gandour & Weinberg, 1984). On the other hand, Gandour and Weinberg (1983) showed that without FO variation (FO was constant
question and statement, emphasizing the critical role of FO as an acoustic cue for the perception of intonation.
3.1.3. Current study
The first goal of the current study was set to determine the impacts of amplitude-based control of FO on the ability of EL users to produce linguistically meaningful contrasts on sentence level. More specifically, the ability of the FO contour, as derived from the linear relationship of amplitude and FO, to convey the distinction between question and statement intonation was evaluated using a perceptual identification task. We also explored whether the amplitude control of FO could further increase the ability of EL users to produce linguistically meaningful contrastive stress. FO control scheme which adversely affects the communication of linguistic contrasts may not be desirable even though the same control scheme can improve the overall naturalness of the EL speech. Furthermore, determining the exact feasibility and limitation from different perspectives may suggest the way in which the algorithm can be improved and help develop an efficient training protocol in using the proposed control scheme.
Considering the different mechanics in speech production between EL speech and normal speech, however, several limitations are expected for the amplitude-based FO control. In normal speech, voice production is dependent on the finely balanced
relationship between the laryngeal configuration and respiration. The similarity of the FO and amplitude patterns observed in normal speech in Chapter two can be explained by the fact that an increase in subglottal pressure increases the frequency of vocal cord vibration as well as the pressure of the sound wave (Fant, 1970). Intonation may be correlated with
particular patterns of change in subglottal pressure and this would give corresponding changes in both FO and amplitude of the speech wave.
In EL speech, however, the amplitude of voicing source is essentially kept constant, so the amplitude fluctuation in EL speech output wave may be largely due to the supraglottal movement. As the quality of the sound changes from phoneme to
phoneme, amplitude varies depending on the degree of mouth opening which is related to the segmental context. Producing linguistic contrasts using the amplitude-based FO
control is, therefore, expected to be more difficult compared to normal speech production, where the voicing source amplitude and the segmental aspects could be controlled
relatively independently. For example, for the same segmental contexts, it was expected to be difficult to produce higher FO values for stressed word compared to unstressed words in order to communicate the contrastive stress with amplitude-based FO control. Communicating question intonation would be also limited, because the amplitude-based FO contour is expected to fall at the end of utterances irrespective of the prosodic contexts, although FO may need to be raised at the end in order to communicate question.
The second specific aim of this study was to evaluate the ability to convey linguistic contrasts with amplitude-based FO control in comparison with the other FO control scheme where the FO is manually controlled (Tru-Tone, Griffin laboratories). In this type of device, a pressure sensor is built into a push button, and the FO is controlled by the force (finger pressure) with which this button is pressed. In these products, there is a direct correspondence between operating amount and FO, so the FO can be varied as desired with increasing practice. However, there have been no objective data examining the efficiency of manual FO control approach in terms of communicating linguistic
contrasts and comparing different control schemes may further delineate the advantages and disadvantages of different control schemes.
In the manual control scheme, it was expected to see the differences in
performance depending on the speaker's skill to control the finger pressure and achieve the desired FO contour for a particular prosodic context. It was also expected to see the dependence of performance on particular types of sentences. For example, difficulties in providing intonational contrasts are expected, because vibration On/Off is determined by a threshold value which is set relative to the operating amount and speech cannot be started or ended with a desired FO frequency.
In order to investigate the specific goals described in this section, we collected speech samples from normal four speakers, prepared and manipulated the FO contours of utterances, and administered a perceptual listening task completed by normal hearing listeners using original and manipulated utterances as stimuli.
3.2. Methods
3.2.1. Sentence materialsThe vocal tasks were similar to that used by Gandour and Weinberg (1983), and consisted of sentence quadruplets containing two declarative sentences and two
interrogative sentences, with the location of contrastive stress differing within the statement/question pairs (Table 3.2). The four versions of each sentence were thus identical in their segmental composition and differed only with respect to where they
contained a focused word (on the initial or final word) and whether the intonation pattern was statement or question.
Version Sentence type Focus position S1s1 s2
A Statement Initial BEV loves Bob. WE were away.
B Statement Final Bev loves BOB. We were A WA Y.
C Question Initial BEV loves Bob? WE were away?
D Question Final Bev loves BOB? We were A WAY?
Table 3.2 Vocal tasks recorded that vary intonation and contrastive stress.
The sentences were short (three words) so they could be easily spoken in a single breath, to prevent the speakers from inserting pauses in the speech and to ensure they maintain the closed glottis condition. The first sentence ("Bev loves Bob") was chosen because it (a) is composed solely of monosyllabic words, a feature which eliminates word-level stress effects; (b) contains only voiced consonants; and (c) facilitates results comparisons with the data from previous studies (Atkinson, 1973, 1976; Gandour and Weinberg, 1982, 1983, 1984). The other sentence was chosen to have only vowels and semivowels, to make production of the EL speech as easy as possible.
3.2.2. Participants and recording procedures
The participants were four speech-language pathologists (2 female (fl, f2) and 2 male speakers (ml, m2)) who work with laryngectomy patients and are very experienced in training patients to optimize EL use. Vocal tasks were recorded digitally onto
computer hard disk (Fs = 48 kHz) while the participants were seated in a sound-isolated booth. The recordings were calibrated for sound pressure level (SPL). The microphone was placed about one inch from the right corner of the speaker's mouth for EL speech
(EL device was placed against the left side of the neck) and about six inch from the center of the speaker's mouth for normal voice recording.
Sola-Tone Sola-Tone Tru-Tone Sola-Tone Tru-Tone Tru-Tone Male: Female: w ~1
0
I
"I i'M I01 ,
:V
4
HQ ! ,,,, Ui" 't9,r
, i
; I
~lOW (ll
Figure 3.1: Spectra of voicing sources directly Tone EL.
recorded from Sola-Tone EL and
Tru-Each participant recorded a standard set of speech tasks under three different conditions. In the first condition, subjects used their natural voices. The second condition involved producing the speech material using a Sola-Tone neck-placed EL (Griffin Laboratories) set at a constant FO. For the third condition, subjects produced the speech tasks using the manual control feature of the Tru-Tone EL (Griffin Laboratories) to vary
FO. The acoustic and perceptual characteristics of voicing sources of Sola-Tone EL and Tru-Tone EL were similar to each other and the spectrums obtained directly from the two ELs (not filtered by the user's vocal tract) are shown in Figure 3.1. The difference
between these two devices was thus confined to the presence of manual FO control