Publisher’s version / Version de l'éditeur:
Vous avez des questions? Nous pouvons vous aider. Pour communiquer directement avec un auteur, consultez la première page de la revue dans laquelle son article a été publié afin de trouver ses coordonnées. Si vous n’arrivez pas à les repérer, communiquez avec nous à PublicationsArchive-ArchivesPublications@nrc-cnrc.gc.ca.
Questions? Contact the NRC Publications Archive team at
PublicationsArchive-ArchivesPublications@nrc-cnrc.gc.ca. If you wish to email the authors directly, please see the first page of the publication for their contact information.
https://publications-cnrc.canada.ca/fra/droits
L’accès à ce site Web et l’utilisation de son contenu sont assujettis aux conditions présentées dans le site LISEZ CES CONDITIONS ATTENTIVEMENT AVANT D’UTILISER CE SITE WEB.
Concrete under Severe Conditions: Environment and Loading. Proceedings of the 6th International Conference on Concrete Under Severe Conditions
(CONSEC'10), Merida, Yucatan, Mexico, 7-9 June 2010, 2, pp. 145-158, 2010-06-07
READ THESE TERMS AND CONDITIONS CAREFULLY BEFORE USING THIS WEBSITE.
https://nrc-publications.canada.ca/eng/copyright
NRC Publications Archive Record / Notice des Archives des publications du CNRC :
https://nrc-publications.canada.ca/eng/view/object/?id=4c5affc5-7d1e-4e89-94f2-77ab25d57bd3 https://publications-cnrc.canada.ca/fra/voir/objet/?id=4c5affc5-7d1e-4e89-94f2-77ab25d57bd3
Archives des publications du CNRC
This publication could be one of several versions: author’s original, accepted manuscript or the publisher’s version. / La version de cette publication peut être l’une des suivantes : la version prépublication de l’auteur, la version acceptée du manuscrit ou la version de l’éditeur.
Access and use of this website and the material on it are subject to the Terms and Conditions set forth at Improving performance prediction of corroding concrete bridges with field monitoring
I m proving pe rform a nc e pre dic t ion of c orroding c onc re t e bridge s w it h fie ld m onit oring
N R C C - 5 3 2 4 5
C u s s o n , D . ; D a i g l e , L . ; L o u n i s , Z .
J u l y 2 0 1 0
A version of this document is published in / Une version de ce document se trouve dans: 6th International Conference on Concrete under Severe Conditions, Environment & Loading (CONSEC'10), Mérida, Yucatán, Mexico, June 7-9, 2010, pp. 145-158
The material in this document is covered by the provisions of the Copyright Act, by Canadian laws, policies, regulations and international agreements. Such provisions serve to identify the information source and, in specific instances, to prohibit reproduction of materials without written permission. For more information visit http://laws.justice.gc.ca/en/showtdm/cs/C-42
Les renseignements dans ce document sont protégés par la Loi sur le droit d'auteur, par les lois, les politiques et les règlements du Canada et des accords internationaux. Ces dispositions permettent d'identifier la source de l'information et, dans certains cas, d'interdire la copie de documents sans permission écrite. Pour obtenir de plus amples renseignements : http://lois.justice.gc.ca/fr/showtdm/cs/C-42
Improving performance prediction of corroding concrete bridges
with field monitoring
D. Cusson, Z. Lounis, L. Daigle
National Research Council Canada, Institute for Research in Construction, Ottawa, Ontario, Canada
ABSTRACT: Continuous monitoring of critical aging bridges has become necessary due to increased traffic loads, changing environments, extreme shocks, which can re-duce their load-bearing capacities, modify their failure modes, and increase their risks of failure. Implementation of monitoring programs can provide valuable information on physical health of bridges and their risks of failure. Prediction models updated with monitoring data can help decision makers optimize inspection, maintenance, and reha-bilitation of bridges, thus extending their service life and reducing their life-cycle costs. This paper provides an approach based on the monitoring of life cycle performance of concrete bridges exposed to chlorides, and demonstrates its application in a case study. It is first shown that some of the data, which are commonly used by engineers as input values into service life prediction models, can be different from actual field values, be-cause these parameters vary widely in space and time. It is then demonstrated that ser-vice life predictions can be improved by updating the models with field monitoring data.
1 INTRODUCTION
Most highway bridges in Canada and Northern USA are short and medium span bridges that exhibit serious corrosion-induced deterioration due to the use of de-icing salts on roads during winter. Many of these bridges were built in the 1950’s, 1960’s and 1970’s and are now considered deficient in terms of structural capacity and functionality as a result of aging, increased traffic volume and loads, deterioration, changing environmen-tal conditions, and more stringent bridge design codes. In Canada, investments in bridges have been under the levels required to hold their average age constant, which is a proxy used to estimate their physical condition. According to Statistics Canada, their average age rose from 21.3 years in 1985 to 24.5 years in 2007 with a mean service life of 43.3 years, suggesting that Canada’s bridges have exhausted 57% of their useful life on average (Gagnon et al. 2008). In the U.S., 27.5% of highway bridges are either struc-turally deficient or functionally obsolete, and the bridge investment backlog is estimated at US$65.2 billion (U.S. DOT et al. 2007).
Bridges may fail due to inadequate design of materials and structural systems, in-creased traffic loads, exposure to severe environments and/or extreme shocks, as well as inadequate inspection, maintenance and rehabilitation. The consequences of such fail-ures can be serious, and may include fatalities, reduced level of service, increased main-tenance and user costs, and significant socio-economic and environmental impacts. The prohibitive costs needed to upgrade highway bridges require the development of effec-tive decision support tools that will help bridge owners and engineers manage their large portfolios of aging bridges. Such tools will enable them to assess the condition of their structures, predict future performance and allocate the limited funds to better optimize
their maintenance and rehabilitation in order to reduce the risk of failure and minimize the life cycle costs.
The widespread deterioration and the recent bridge collapses (Inaudi et al. 2009) have highlighted the importance of developing effective bridge inspection and monitoring approaches to ensure their safety and extend their service life. Currently, most bridges are inspected at regular intervals through visual inspections of the deck, superstructure and substructure, which are usually followed by mapping the observed damage to a qua-litative condition rating scale. More detailed and in-depth inspections using
non-destructive evaluation methods are conducted less frequently to supplement the data ob-tained from visual inspection, especially for critical elements to assess the level of cor-rosion, fatigue, delamination, etc.
Structural health monitoring (SHM) strategies have been developed recently to identi-fy structural problems before they become critical, endanger public safety, and reduce serviceability. The implementation of monitoring strategies can help optimize in-depth inspection, maintenance, repair, rehabilitation and replacement of bridges and can be an effective tool for monitoring the life cycle performance of critical highway bridges to minimize their risks of failure, which can be quite significant in terms of fatalities, inju-ries, service losses and economic impacts. The use of service life prediction models, ca-librated with field monitoring data, can allow an accurate assessment of performance with respect to different limit states, including safety and serviceability (Wenzel 2009). The objectives of this paper are twofold: (i) to present an approach for the efficient use of structural health monitoring to assess life cycle performance of concrete highway bridge structures built in corrosive environments; and (ii) to demonstrate the effective use of data obtained from field monitoring for improving the accuracy of service life prediction models. A case study of the monitoring of a concrete highway bridge barrier wall is presented and used to illustrate the approach.
2 STRUCTURAL HEALTH MONITORING
2.1 Proposed strategy
Structural health monitoring, either with embedded sensors or by actual field testing, is an evolving technology that can be used to monitor the condition of existing or new civ-il engineering structures. Depending on the risk of faciv-ilure of the structure, avaciv-ilable budgets and monitoring objectives, three major types of SHM can be adopted:
(i) occasional monitoring (e.g. a few hours or days), to confirm design assumptions, to
moni-tor the structural behaviour during a planned exceptional event, or to help in the planning of a more complex form of monitoring. Field testing, or sensor-based monitoring with a portable system are best suited for this task;
(ii) periodic monitoring (e.g. once a year), to monitor parameters that are mainly influenced
by cyclic events. Periodic non-destructive field testing, or sensor-based monitoring with a portable installation may be used; and
(iii) continuous monitoring, to assess the performance at all stages in the life of a critical struc-ture, including parameters that are influenced by static and dynamic events (Braunstein et al. 2002). In this case, sensor monitoring with a permanent installation (with or without remote communication) is best suited for this task. Continuous remote monitoring may be less expensive in the long term than conducting frequent field testing considering labour cost, safety and risk of failure.
The implementation of SHM, as an essential part of the initial structural design and con-struction, will be one of the keys to the development of the next generation of long life and smart bridges. Intelligent sensing systems may be composed of five main elements:
(i) sensors collecting data (e.g. applied loads, long-term static and short-term dynamic
struc-tural performance data, durability parameters, and weather data);
(ii) actuators taking corrective actions in environments of interest;
(iii) network for the transmission of data and control signals;
(iv) systems for data management, visualization, and reporting (incl. alarms); and
(v) specific analysis and decision-making applications.
Figure 1 illustrates the concept of SHM. The selection of the required types and number of sensors located at discrete and critical points on a given bridge structure relies on the type of bridge and the experience of the bridge engineers and their knowledge of the physical, chemical and mechanical damage mechanisms, and on the budget allocated for SHM. In a larger context, monitoring data can be considered similar to quality assurance and acceptance sampling, since it is not realistically feasible to monitor all physical pa-rameters in all sections of an entire bridge (Frangopol et al. 2008). In-depth information on the design of SHM systems and specific bridge applications can be found elsewhere (Mufti 2001, Braunstein et al. 2002, Glisic & Inaudi 2007).
Figure 1. Concept of structural health monitoring of bridge structures.
Cardini & Dewold (2009) recently developed an approach that provides warnings of major changes in the structural integrity of a bridge or some of its load-bearing ele-ments. Their approach includes the monitoring of long-term deformations of the struc-tural elements of a bridge, the identification of significant changes in the behaviour, and the determination of damage indicators. More specifically, the following indicators, de-termined from monitored strain data, were successfully demonstrated on a multi-girder steel composite bridge (Cardini & Dewold 2009):
(i) load distribution factors for the bridge girders, from which an envelope curve is used to
detect damage in the girders or deck;
(ii) dynamic peak strains for each of the bridge girders, which can be used to assess the
rela-tive magnitude of truck loads passing on the bridge deck, to detect changes in girder strength, and to assess their fatigue in the long term; and
(iii) neutral axis location, which can provide information about the condition of the deck as it deteriorates over time.
The above approach could easily be supplemented with a second approach consisting in the long-term monitoring of critical durability parameters in order to improve the pre-diction of the remaining service life of an existing bridge. For the case of reinforced concrete (RC) highway bridges exposed to chlorides from de-icing salts or seawater, four main parameters have strong influences on their service life, namely:
(i) surface chloride content of concrete, which may increase over time and vary in space due
to the continual use of de-icing salts on roads, precipitation, and drainage;
(ii) chloride diffusion coefficient of concrete, which may decrease over time due to
continu-ing cement hydration resultcontinu-ing in decreascontinu-ing concrete porosity, and may vary in space; (iii) chloride threshold of the reinforcement, which is highly uncertain since it depends on
va-riables related to the properties of concrete and steel and on environmental conditions, and may vary in time and space; and
(iv) corrosion rate of rebars and deterioration rate of structure, which are highly variable. The considerable uncertainties associated with these parameters governing the service life of RC bridges highlight the need for calibrating and updating existing service life prediction models with SHM data, and for the use of probabilistic analysis methods. This approach will be demonstrated later in a case study on a highway concrete bridge structure. In addition to the high variability and uncertainty of these parameters, this problem is compounded by the fact that just a few of these key parameters can actually be monitored by the use of remote sensors. Although some analog sensors may be used to determine the chloride threshold (indirectly) and the corrosion rate of the reinforce-ment, no commercial sensors are currently available to remotely determine the chloride content and chloride diffusion in concrete. There is therefore a strong need for the de-velopment of new sensors for durability monitoring in order to reduce the frequency of required field testing, including the use of destructive testing (such as taking concrete cores for the determination of chloride profiles in a structure).
2.2 Risk assessment and management using structural health monitoring
The implementation of effective inspection techniques, such as non-destructive evalua-tion and structural health monitoring will provide more reliable informaevalua-tion on the risk of failure of highway bridges. Such information is critical to decision makers as it will help them prioritize bridges for preservation actions in order to reduce the risks to ac-ceptable levels given the available funds. The benefits of SHM can be summarized as follows:
(i) Improvement of public safety – SHM can enable bridge owners to monitor the perfor-mance of their structures from a central site via Internet, thereby reducing the number of site visits for visual inspections and destructive- and/or non-destructive testing. Therefore, SHM can provide key information on structural performance (e.g. excessive deformations and stresses, yielding, foundation settlement) and for durability assessment (e.g. concrete cracking, reinforcement corrosion, freeze-thaw damage), allowing timely decisions on corrective measures before problems become critical and dangerous. Safety-critical bridges should be monitored to ensure the likelihood of failure of critical load-bearing elements is kept very low, especially for bridges in major urban centres, and non-redundant bridge systems, for which failure can have catastrophic consequences.
(ii) Development and calibration of service life prediction models – The vital
informa-tion acquired by SHM can foster a better understanding of damage initiainforma-tion and damage accumulation in bridge structures (Cusson et al. 2006, Butcher & New-hook 2009) and calibration of service life prediction models (Cusson et al. 2009). In addition to the scarcity of field data available from full-size structures, many key parameters used in service life prediction models are highly variable and un-certain, which may adversely affect the reliability of predictions. The continuous updating of service life prediction models with monitored field data can have a strong influence on intervention planning.
(iii) Safer design and rehabilitation of concrete structures – Another benefit of SHM is to
help re-assess the live loads and environmental loads on bridge structures. This will help identify any major variations from the values assumed in bridge design codes, thus reduc-ing the uncertainty of critical design parameters. This is becomreduc-ing an important issue giv-en the growing concerns with climate change and its potgiv-ential impact on the safety and serviceability of bridge structures due to increases in wind loads, flooding, thermal gra-dients, freeze-thaw cycles, de-icing salt use, etc. Structural health monitoring can also be used to ensure the structural integrity of the bridge during the sequential rehabilitation or replacement of damaged load-bearing elements (Carrion et al. 2009).
(iv) Continuous security monitoring of critical bridges – A continuous video camera
surveil-lance system can monitor critical bridges and their immediate surroundings in order to identify and respond to potential threats to the bridges and their components. Various types of activities can be monitored depending on the type of bridge, such as car and truck traffic, movement of people, as well as boats, ships and aircraft activities. Computer
sion and pattern recognition technology can also be used to allow computers to process recorded images, watch for danger signs, and send alarms to security officers. Such tech-nologies require high-speed communication systems to deliver the information to remote security offices for analysis, response, reporting and archiving purposes (FHWA 2009).
(v) Faster development and acceptance of new construction technologies – SHM can provide
a structured approach to assess the performance of emerging technologies applied in demonstration projects, whether they are conducted on old structures or new construction. Research on bridges involves the use of sensors and data logging systems for the conti-nuous monitoring of selected performance parameters (Tennyson et al. 2001, Cusson et al. 2006). Sensors can provide detailed knowledge of: (i) conditions under which the structure is being tested, including: applied loads, imposed displacements, and ambient environment; and (ii) selected performance parameters, which could provide insights on the performance of newly-developed concrete technologies, or the changes in the beha-viour of the structure as a result of strengthening or repair.
3 MODELING OF SERVICE LIFE OF RC BRIDGES EXPOSED TO CHLORIDES
Figure 2 presents the different stages of corrosion-induced damage developing in a typi-cal reinforced concrete bridge exposed to chlorides, which identifies a three-stage ser-vice life model, i.e. (i) early-age cracking; (ii) corrosion initiation; and (iii) corrosion propagation, which is a modified version of Tuutti’s simplified model (1982). With time, each stage develops into higher levels of damage, which include: (i) early-age cracking of concrete due to restrained shrinkage (if any); (ii) initiation of reinforcement corrosion after a relatively long period of chloride diffusion through concrete; (iii) inter-nal cracking around the reinforcing bars due to the build-up of corrosion products; (iv) surface cracking due to further progression of corrosion-induced cracks; (v) delamina-tion or spalling of the concrete cover, depending on the slab reinforcement design; and finally (vi) failure of the concrete deck, depending on the amount of concrete damage that can be tolerated by the bridge owner before deck rehabilitation or replacement is considered.
Figure 2. Schematic description of service life model.
D am a ge l eve l Time Early-age cracking Rebar corrosion Internal cracking Surface cracking Delamination or spalling Failure Service life
Corrosion initiation stage Propagation stage
E ar ly-ag e c rac k in g s ta ge Cl-Cl- Cl- Cl -Cl -Shrinkage cracking Corrosion and stress generation Concrete damage Chloride diffusion
3.1 Prediction of chloride ingress into concrete
In uncracked concrete, the chloride ingress can be determined by using Crank’s solution of Fick’s second law of diffusion (Crank 1975):
5
where C(x,t) = chloride concentration at depth x after time t; Cs = apparent surface chlo-ride concentration; erf = error function, and Dc = apparent chloride diffusion coefficient. The use of the above model assumes that diffusion is the main mechanism of chloride ingress into concrete. In porous solids such as concrete, chlorides can penetrate into concrete via different physical mechanisms, such as: diffusion, capillary absorption, electrical migration, and permeation due to hydraulic pressure heads, depending on the exposure condition and moisture content (Kropp 1995). The lack of accuracy of Fick’s model has been recognized for a long time, since it has been used with the so-called “apparent” values of the surface chloride concentration and chloride diffusion coeffi-cient, which are obtained by calibrating the Fickian model with available field data. However, this model has gained wide acceptance due to its simplicity and practicality (Bamforth 1998, Tang & Gulikers 2007).
3.2 Prediction of corrosion initiation and concrete spalling
In order to predict the time of corrosion initiation (ti), Equation 1 can be rearranged by setting C(x,t) equal to the chloride threshold (Cth), at which steel corrosion is expected to initiate a d x equal to the effective cover depth of the reinforcement (d, n c), as follows:
t
D CC (2)
The accumulation of corrosion products over time generates contact pressure between the rebar and the surrounding concrete. The mechanical behaviour of the concrete cover surrounding the corroding rebar can be modelled as a thick-walled cylinder subjected to a uniformly distributed internal pressure (pi), assuming that concrete is a homogeneous elastic material, and that corrosion products are equally distributed around the perimeter of the reinforcing bars (Bažant 1979, Tepfers 1979). The radial displacement and tan-gential stress generated in the concrete cover by the corrosion products can be estimated using the thick-wall cylinder model (Fig. 3, Timoshenko 1956).
Figure 3. Uncracked and cracked thick-wall cylinder models of corroding RC bridges:
(a) Tensile stresses developing in concrete around bar; (b) Propagation of internal cracks in thick-wall cy-linder; (adapted from Lounis & Daigle 2008).
Corrosion products
σ
r+d
σ
rσ
rσ
tσ
tσ
t=f’t(a)
(b)
Corrosion productsσ
r+d
σ
rσ
rσ
tσ
tσ
t=f’t Corrosion productsσ
r+d
σ
rσ
rσ
tσ
tσ
t=f’t Corrosion productsσ
r+d
σ
rσ
rσ
tσ
tσ
t=f’t(a)
(b)
This model allows the calculation of the increases in the rebar diameter (Δd) related to different stages of corrosion-induced damage by calculating the radial displacements at the inner surface of the cylinder, as follows (assuming that the external pressure induced by external loads on the structure is relatively small or negligible):
∆ 1 (3)
where d = bar diameter, dc = concrete cover, ν = Poisson's ratio of concrete, Ec = effec-tive elastic modulus of concrete taking into account the effect of creep (Bažant 1979).
The corrosion propagation times (tp), corresponding to the onset of internal cracking, surface cracking, and delamination/spalling, respectively, can be determined as a func-tion of th c rese or ponding increase in rebar diameter as follows:
t S
where S = rebar spacing; jr = rust production rate per unit area (Bažant 1979); ρr = den-sity of corrosion products (assumed at 3600 kg/m3 for Fe(OH)3); ρs = density of steel (7860 kg/m3); and α = molecular weight ratio of metal iron to the corrosion product (as-sumed at 0.52).
The service life (ts) can be defined as the total time to reach a given corrosion-induced damage level, which is the sum of the early-age cracking time (tcr, defined in Cusson et
al. 2009) c si i
ponding v l
, orro on initiat on time (ti) and the corrosion propagation time (tp) corres-to the gi en evel, as follows:
t t t t
3.3 Prediction of service life
Several different estimates of service life can be obtained by using the developed analyt-ical damage initiation and accumulation models presented in this paper depending on the selected failure criteria. The service life of a concrete highway bridge structure is generally defined as the time to reach critical damage levels, in terms of delamination or spalling (e.g. AASHTO 2002, Lounis & Daigle 2008). In this paper, the service life of a concrete bridge structure is defined as the time to onset of delamination or spalling (whichever comes first).
Service life predictions may be obtained through a simple deterministic analysis, neg-lecting the variability and uncertainty of parameters governing the deterioration me-chanisms. Deterministic analyses are based on mean or characteristic values of the va-riables and can only predict the times to reach the different stages of corrosion initiation and corrosion-induced damage caused by an average condition. In order to account for the variability and uncertainty of the input parameters, service life predictions should be obtained through a reliability-based analysis, with the key input parameters expressed in terms of mean values and coefficients of variation (COV). For simplicity, the following case study will be conducted using a simple deterministic analysis, which will be suffi-cient for the demonstration.
4 CASE STUDY: LIFE CYCLE PERFORMANCE PREDICTION OF A CONCRETE
BRIDGE BARRIER WALL USING STRUCTURAL HEALTH MONITORING The purpose of this section is to illustrate the benefits of SHM in improving the relia-bility of service life predictions and, more specifically, to point out that some of the in-put data, which are commonly used in service life prediction models, can be somewhat different from reality, as some parameters can vary widely in time and space and can al-so be highly uncertain.
4.1 Description of bridge and experimental program
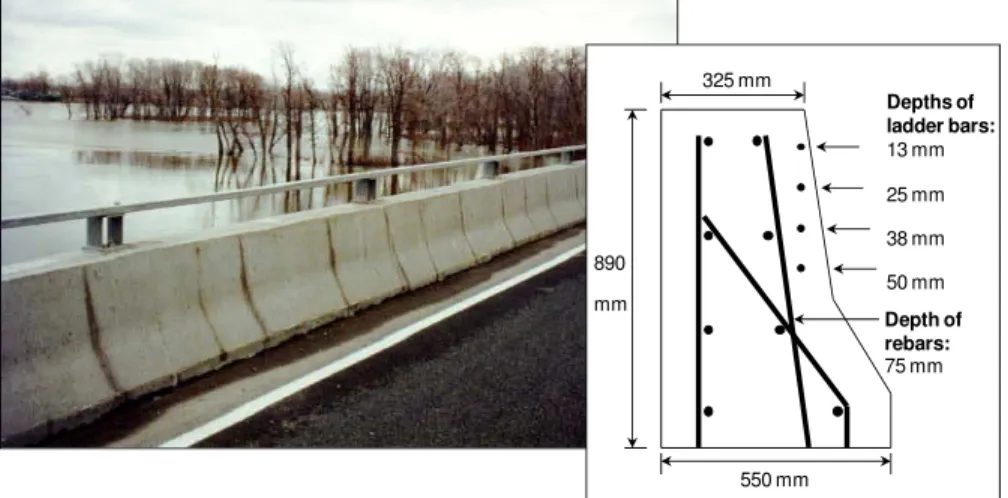
In 1996, the Ministry of Transportation of Québec undertook the rehabilitation of the Vachon bridge, which is a major highway bridge in Laval (near Montréal), Canada. Part of the rehabilitation consisted of rebuilding the severely corroded concrete barrier walls, of which ten 34-m spans were selected for the application and evaluation of different corrosion inhibiting systems. The barrier wall reinforcement consisted of 15-mm diame-ter bars, with eight longitudinal bars distributed in the cross-section, and transverse rein-forcement spaced at 230 mm (Fig. 4).
325 mm 550 mm 890 mm Depths of ladder bars: 13 mm 25 mm 38 mm 50 mm Depth of rebars: 75 mm
Figure 4. Cross-section of reconstructed RC bridge barrier wall (Vachon bridge, Laval, Canada).
The concrete had a water-cement ratio (w/c) of 0.36 (selected to obtain low
permeabili-ty), a cement content of 450 kg/m3, and 28-day strength of 45 MPa. On-site corrosion
surveys of the barrier wall were performed annually from 1997 to 2006, including mea-surements of corrosion potential and corrosion rate of the reinforcement, and concrete electrical resistivity in the barrier wall, of which the concrete cover was 75 mm. For ear-ly detection of corrosion, sets of rebar ladders were embedded during construction. The ladder bars had concrete cover thicknesses of 13 mm, 25 mm, 38 mm, and 50 mm (Fig. 4), allowing additional corrosion measurements to be taken. The chloride concentration at different depths in the concrete was measured on concrete cores taken from the bar-rier wall. More details can be found in Cusson & Qian (2009).
4.2 Measurement and prediction of chloride ingress into concrete
Concrete cores were taken from the bridge barrier walls after 1, 2, 4, 5, 8 and 10 years of exposure to de-icing salts in order to test several parameters, including chloride centration. Of the 10 spans of barrier wall under study, three of them had identical con-crete formulations and concon-crete surface conditions (referred to as Spans 12, 19 and 21 according to bridge construction drawings). Figure 5 presents the profile of the total chloride content measured in the concrete after 10 years of exposure to de-icing salts (each data point is a mean obtained from two cores). The best-fit curve presented in Figure 5 was obtained by linear regression analysis using Crank’s solution of Fick’s 2nd law of diffusion (Equation 1) and the field data corresponding to mean depths ≥ 18 mm.
0 5 10 15 20 0 10 20 30 40 50 60 70 8 Tot al c h lor ide c on ten t ( k g/ m 3) Depth (mm) 25 0 10-year exposure to deicing salts
Field data (measured on 3 test spans)
Best fit of field data
Predictions based on best Cs& Dcfrom literature
Apparent Cs
Figure 5. Measured and predicted profiles of total chloride content after 10 years.
From the field data obtained over 10 years, a mean apparent surface chloride content of 22.7 kg/m3 and a mean apparent chloride diffusion coefficient of 0.63 cm2/year were found. In reality, the highest near-surface chloride content was measured to be at least 16.5 kg/m3 in the barrier wall (Fig. 5), which is already higher than the maximum value
of 8.9 kg/m3 suggested by Weyers (1998) for geographical regions with severe
expo-sures to de-icing salts (Table 1).
Table 1. Severity classification of corrosive environments (Weyers 1998). Severity Apparent surface chloride content
Low (e.g. Kansas) 0.0-2.4 kg/m3
Medium (e.g. Florida) 2.4-4.7 kg/m3 High (e.g. West Virginia, Iowa) 4.7-5.9 kg/m3 Severe (e.g. New-York) 5.9-8.9 kg/m3
These guidelines were developed for bridge decks located in USA and may not apply to Canada and other northern countries, where more de-icing salts are used over longer winter periods. Similarly, the apparent chloride diffusion coefficient of 0.63 cm2/year determined after 10 years in the concrete barrier wall was found to be much larger than those obtained from the literature for a similar concrete. For example, Figure 5 shows the predicted chloride profiles using Equation 1 with Cs = 8.9 kg/m3, as suggested by Weyers (1998) for severe exposure conditions, and (a): Dc = 0.21 cm2/year based on da-ta provided by Dhir et al. (1990) on a concrete similar to that used in this case study, or (b): Dc = 0.38 cm2/year determined with the empirical model of Boulfiza et al. (2003) for concrete with w/c = 0.36 containing no supplementary cementing materials.
It can be seen that the chloride profiles are largely underestimated when compared to the measured field data, even for a short period of 10 years. These discrepancies can be explained by the large fluctuations of many factors influencing chloride ingress into concrete, including concrete mixture formulation, hydration and curing characteristics, temperature and humidity conditions, and surface chloride concentrations. It can be concluded that determining the chloride profile for a given concrete structure using care-fully-selected literature values, even from similar concretes tested under similar envi-ronments, may result in inaccurate estimates, leading to poor and potentially unsafe pre-dictions of the remaining life of the structure.
Figure 6 presents the variation of the apparent surface chloride concentration meas-ured over time, where it is shown to increase significantly up to a maximum value of 22.7 kg/m3 after 10 years of exposure to de-icing salts. Figure 6 also presents the time variation of the apparent chloride diffusion coefficient, where it is observed to decrease by a factor of 2 from Year 2 to Year 10. This reduction could be explained in part by the continuing cement hydration and corresponding reduction in concrete porosity.
Figure 6. Apparent surface chloride content & apparent chloride diffusion coefficient measured for 10 yrs. 0.0 0.5 1.0 1.5 2.0 2.5 0 5 10 15 20 25 0 2 4 6 8 10 12 A p p . C l d if fu si on c oef fi ci ent ( c m 2/y r) A p p . s u rf ace C l c o n ten t ( k g/ m 3) Time (years) Best fit of apparent Cs Best fit of apparent Dc
Each point is an average of 6 test results
Knowing that most chloride diffusion prediction models use constant values of Cs and
Dc from the literature or short-term field data, the above observations suggest that pre-diction models may possibly give inaccurate prepre-dictions if input values of Cs and Dc are not regularly updated with field monitoring data. The time variation of the chloride con-centration was estimated for carefully selected constant values of Cs and Dc from the li-terature for a similar concrete. Table 2 gives the values used in this comparative analy-sis.
Table 2. Values of apparent surface chloride contents and apparent chloride diffusion coefficients used in comparative analysis.
Parameter Selected data from literature Selected data from field measurements (Fig. 6)
Cs 8.9 kg/m3 22.7 kg/m3
Dc 0.21-0.38 cm2/yr 0.63 cm2/yr
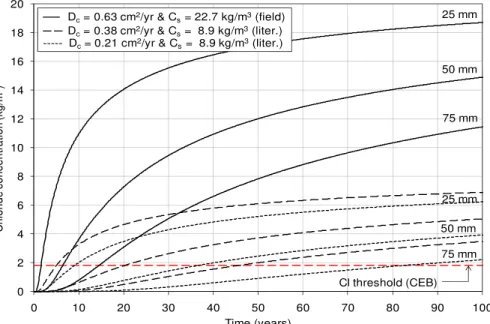
Figure 7 presents the estimated chloride concentrations at different concrete depths over time, where the best-assumed values of Cs and Dc were selected from the literature for a similar concrete in a similar environment. For example, depending on the selected value of Dc, a chloride concentration of 2 kg/m3 would take 20 to 35 years to accumulate in concrete at a 50 mm depth, or 45 to 80 years at a 75 mm depth.
Figure 7. Predictions of chloride profiles (with Cs and Dc selected from literature and field data). 0 2 4 6 8 10 12 14 16 18 20 0 10 20 30 40 50 60 70 80 90 10 C h lo rid e c o nc e nt ra tio n ( kg/ m 3) Time (years) 25 mm 50 mm 75 mm Cl threshold (CEB) 0 ── Dc= 0.63 cm2/yr & Cs= 22.7 kg/m3(field)
─ ─ Dc= 0.38 cm2/yr & Cs= 8.9 kg/m3(liter.)
--- Dc= 0.21 cm2/yr & Cs= 8.9 kg/m3(liter.)
25 mm
50 mm
75 mm
Figure 7 also presents predicted chloride concentrations at different concrete depths over time with the models updated with field data measured at 10 years. It can be clearly seen that the predictions based on the Year-10 field data and the best assumed values found from the literature are quite different. The above analysis clearly illustrates the need for field monitoring (including structural health monitoring) to update current pre-diction models for which the accuracy of the prepre-dictions rely on the quality of the input data.
4.3 Observation and prediction of corrosion initiation and concrete spalling
Figure 8 presents a sensitivity analysis of corrosion initiation and concrete spalling times (using Equations 1 to 5), depending on cover thickness, chloride threshold, and corrosion rate. At the 75 mm depth (location of main reinforcing bars in case study), the prediction indicates a time to corrosion initiation between 11 and 15 years based on threshold values suggested by ACI (2001) and CEB (1992), respectively. No significant corrosion was in fact observed on sections of 75-mm deep rebars cut from the barrier wall at 10 years (Cusson & Qian 2009).
Figure 8. Sensitivity analysis of time to rebar corrosion and time to concrete spalling.
0 5 10 15 20 25 30 35 40 45 50 55 0 1 2 3 4 5 6 7 8 9 10 11 1 T ime (y ears ) Chloride Threshold (kg/m3) - Corrosion initiation (from measured Dc& Cs)
- Spalling (Icor=0.25μA/cm2)
- Spalling (Icor=0.50μA/cm2) 60 2 ACI 2001 CEB 1992 Rebars at 75 mm: Bars at 25 mm: - Spalling (Icor=0.25μA/cm2)
- Spalling (Icor=0.50μA/cm2) Field observations after 10yrs
at 75mm: - no app. corrosion; at 25mm: - light corrosion,
- spalling not seen.
- Corrosion initiation (from measured Dc& Cs)
The literature shows a strong disagreement amongst researchers on the range of values to use for the chloride threshold of conventional reinforcing steel in concrete. For exam-ple, the following values have been reported: 0.6-4.9 kg/m3 (Stratfull et al. 1975), 0.7-5.25 kg/m3 (Vassie 1984), 6.3-7.7 kg/m3 (Lukas 1985), 0.87 kg/m3 (West & Hime
1985), and 1.05-1.75 kg/m3 (Henriksen 1993). There are many reasons explaining these
differences, including the variability of several concrete properties and exposure condi-tions, such as pH level, w/c, type and content of cementing materials, temperature, rela-tive humidity (Tuutti 1993), as well as the ambiguity associated with the definition of chloride threshold (Alonso et al. 2000).
Another factor affecting the prediction accuracy is the high variability of the corro-sion rate, which depends on many factors, including the location on the reinforcement relative to a crack, and the yearly variations of ambient temperature, oxygen content and ambient relative humidity (Shiessl & Raupach 1990). Over a year, the corrosion rate may be expected to reach maximum values during the warm season and minimum val-ues during the cold season, and possibly negligible valval-ues if the concrete is frozen. At a depth of 75 mm in the barrier wall, the models predicted concrete spalling to oc-cur after 16 to 20 years of exposure (Fig. 8), based on the moderate corrosion rate of
0.50 μA/cm2 (Cox et al. 1997) and on the ACI and CEB chloride threshold values,
re-spectively. In fact, the mean corrosion rates measured after 10 years in the bridge barrier
walls (near cracks) were 0.25 μA/cm2 for the 75-mm deep reinforcement and 0.30
μA/cm2
for the 25-mm deep test bars. With this field data, and assuming a minimum chloride threshold of 1.9 kg/m3, the models predict the onset of spalling after at least 25 years for the 75-mm deep bars.
5 DISCUSSION
The above case study showed that some of the input data that are commonly used in service life prediction models (e.g. surface chloride content, chloride diffusion coeffi-cient, chloride threshold, and corrosion rate) could be very different from actual field values, because these parameters vary widely in time and space and are highly uncer-tain. Although the case study is on a bridge barrier wall, the lessons learned also apply to other parts of steel-reinforced concrete bridge structures, like RC bridge decks, as long as they show bare concrete surfaces exposed to similar chloride levels.
In order to deal with the high variability and uncertainty of prediction models and their input data, two approaches could be used in combination. As mentioned before, structure health monitoring is one approach that can continuously provide valuable in-formation on several key parameters simultaneously. For example, field measurements of corrosion rate are usually conducted during the summer time for convenience, result-ing in higher than yearly-average corrosion rates. This could result in overly conserva-tive predictions of service life. On the other hand, remote monitoring of the corrosion rate with embedded instrumentation on a daily basis could provide a meaningful value of the yearly average. The second approach is the use of probabilistic models accounting for this variability using mean values and coefficient of variations of key parameters. Such models are more robust than deterministic models, and can be calibrated with SHM data.
6 SUMMARY AND CONCLUSIONS
The deterioration of highway bridges can have serious consequences in terms of reduced safety, serviceability and durability. Structural health monitoring (SHM), either with embedded sensors or actual field testing, is an evolving technology that allows monitor-ing the health of existmonitor-ing or new bridges. SHM can benefit the owners and users of bridge structures by ensuring public safety, optimizing bridge inspection and mainten-ance, extending service life, and reducing the risk of failure. SHM can help assess the performance of new construction/rehabilitation technologies, the development and cali-bration of service life prediction models, and the updating of loading data for use in the design of bridges. This paper provided an approach for monitoring the life cycle per-formance of critical concrete bridges built in corrosive environments, presented the
efits, and demonstrated its application in a case study. It was shown that some of the key input data that are commonly used in service life prediction models could be very dif-ferent from reality, because these parameters vary widely in time and space and are highly uncertain. It was also shown that service life predictions could be improved sig-nificantly by updating the models with field monitoring data. Future research and field projects are needed to develop and demonstrate integrated strategies that combine (i) cost-effective structural health monitoring, including the identification of critical bridges and components and key parameters to monitor in a bridge system, and the effective management and interpretation of SHM data, and (ii) improved service life modeling, using more realistic input data and model updating techniques.
7 REFERENCES
AASHTO, 1998, Rev. 2002, Guide for Commonly Recognized (CoRe) Structural Elements, American As-sociation of State Highway and Transportation Officials.
ACI, 2001, Protection of Metals in Concrete Against Corrosion, American Concrete Institute, ACI Report 222R-01, Farmington Hills.
Alonso, C., Andrade, C., Castellote, M. & Castro, P. 2000, Chloride threshold values to depassivate reinforcing bars embedded in a standardized OPC mortar, Cement and Concrete Research, 30(7): 1047-1055.
Bamforth, P.B. 1998, Spreadsheet model for reinforcement corrosion in structures exposed to chlorides, in: Concrete under Severe Conditions: Environment and Loading, Vol. 1, O.E. Gjørv, K. Sakai & N. Banthia, editors, E & FN Spon, London: 64-75.
Bažant, Z.P. 1979, Physical model for steel corrosion in concrete sea structures – theory, Journal of the
Structural Division, ASCE, 105(ST6): 1137-1153.
Boulfiza, M., Sakai, K., Banthia, N. & Yoshida, H. 2003, Prediction of chloride ions ingress in uncracked and cracked concrete, ACI Materials Journal, 100(1): 38-48.
Braunstein, J., Ruchala, J. & Hodac, B. 2002, Smart structures: Fiber-optic deformation and displacement monitoring, 1st International Conference on Bridge Maintenance, Safety and Management, IABMAS, Barcelona, Spain.
Butcher, A.M. & Newhook, J.P. 2009, Long term monitoring of the confederation bridge, 4th Internation-al Conference on StructurInternation-al HeInternation-alth Monitoring of Intelligent Infrastructure (SHMII-4), Zurich, Swit-zerland.
Carrion, F.J., Lopez, J.A., Quintana, J.A. & Orozco, P.R. 2009, Structural monitoring of cable stayed bridge during rehabilitation, 4th International Conference on Structural Health Monitoring of Intelli-gent Infrastructure (SHMII-4), Zurich, Switzerland.
CEB, 1992, Design guide for durable concrete structures, 2nd Ed., Thomas Telford Publishers.
Cox, R.N., Cigna, R., Vennesland, O., Valente, T. & COST 509, 1997, Corrosion and Protection of
Met-als in Contact with Concrete, Final report, European Commission, Directorate General Science, Re-search and Development, Brussels, EUR 17608 EN, ISBN 92-828-0252-3.
Crank, J. 1975, The mathematics of diffusion, 2nd edition, Oxford University Press, London.
Cusson, D., Lounis, Z. & Daigle, L. 2009, Benefits of internal curing on service life and life-cycle cost of high-performance concrete bridge decks – A case study, Submitted to Cement and Concrete Composite.
Cusson, D. & Qian, S. 2009, Ten-year field evaluation of corrosion inhibiting systems in concrete bridge barrier walls, ACI Materials Journal, 106(3): 291-300.
Cusson, D., Qian, S. & Hoogeveen, T. 2006, Field performance of concrete repair systems on highway bridge, ACI Materials Journal, 103(5): 366-373.
Dhir, R.K., Jones, M.R., Ahmed, H.E.H. & Seneviratne, A.M.G. 1990, Rapid estimation of chloride diffu-sion coefficient in concrete, Magazine of Concrete Research, 42: 177-185.
FHWA, 2009, iFlorida Model Deployment Final Evaluation, Report No. FHWA-HOP-08-050.
Frangopol, D.M., Strauss, A. & Kim, S. 2008, Bridge reliability assessment based on monitoring, Journal
of Bridge Engineering, ASCE: 258-270.
Gagnon, M., Gaudreault, V. & Overton D. 2008, Age of public infrastructure: A provincial perspective, Statistics Canada, Investment and Capital Stock Division, Ottawa, no. 11-621-MIE - No. 067. Glisic, B. & Inaudi, D. 2007, Fibre optic methods for structural health monitoring, John Wiley & Sons,
Ltd, West Sussex, England.
Henriksen, C.F. 1993, Chloride corrosion in Danish bridge columns, in Chloride Penetration into
Con-crete Structures, L.-O. Nilsson (ed.), Göterborg, Sweden.
14
Inaudi, D., Bolster, M., Deblois, R., French, C., Phipps, A., Sebasky, J. & Western, K. 2009, Structural health monitoring system for the new I-35W St Anthony Falls Bridge, 4th International Conference on Structural Health Monitoring of Intelligent Infrastructure (SHMII-4), Zurich, Switzerland.
Kropp, J. & Hilsdorf, H.K. 1995, Performance Criteria for Concrete Durability, E&FN SPON, London. Lounis, Z., Daigle, L., 2008, Reliability-based decision support tool for life cycle design and management
of highway bridge decks, Annual Conf. of the Transportation Association of Canada, Toronto, 19 p. Lukas, W., 1985, Relationship between chloride content in concrete and corrosion in untensioned
rein-forcement on Austrian bridges and concrete road surfacings, Betonwerk und Fertigteil-Technik, 51(11): 730-734.
Mufti, A. 2001, Guidelines for structural health monitoring, ISIS Manual No. 2, http://www.isiscanada.com/manuals/No2_contents.pdf.
Shiessl, P. & Raupach, M. 1990, Influence of concrete composition and microclimate on the critical chlo-ride content in concrete, In: Corrosion of Reinforcement in Concrete, Ed.: C.L. Page, K.W.J. Treada-way, & P.B. Bamforth, Society of Chemical Industry, Elsevier Applied Science, London, England: 49-58.
Stratfull, R.F., Jurkovich, W.J. & Spellman, D.L. 1975, Corrosion testing of bridge decks, Transportation
Research Record, No. 539: 50-59.
Tang, L. & Gulikers, J. 2007, On the mathematics of time-dependent apparent chloride diffusion coeffi-cient in concrete, Cement and Concrete Research, 37(4): 589-595.
Tennyson, R.C., Mufti, A.A., Rizkalla, S., Tadros, G. & Benmokrane, B. 2001, Structural health monitor-ing of innovative bridges in Canada with fiber optic sensors, Smart materials and Structures, No. 10: 560-573.
Tepfers, R. 1979, Cracking of concrete cover along anchored deformed reinforcing bars, Magazine of
Concrete Research, 31(106): 3-12.
Timoshenko, S.P. 1956, Strength of Materials. Part II: Advanced Theory and Problems, Princeton, NJ. Tuutti, K. 1993, The effect of individual parameters on chloride induced corrosion, in: Chloride
Penetra-tion into Concrete Structures, L.-O. Nilsson (ed.), Göteborg, Sweden: 18-25.
U.S. DOT, FHWA, & FTA, 2007, 2006 Status of the Nation’s Highway Bridges, and Transit: Conditions
& Performance, Report to Congress.
Vassie, P. 1984, Reinforcement corrosion and the durability of concrete bridges, Proc. Inst. Civil Engnrs, Part I, No. 76: 713-723.
Wenzel, H. 2009, From structural health monitoring to risk based infrastructure management, 4th Interna-tional Conference on Structural Health Monitoring of Intelligent Infrastructure (SHMII-4), Zurich, Switzerland, July: 22-24.
West, R.E. & Hime, W.G. 1985, Chloride profiles in salty concrete, Mater. Perf., 24(7): 29-36. Weyers, R.E. 1998, Service life model for concrete structure in chloride laden environments, ACI