DOUBLET III FUSION MACHINE POWER SUPPLIES
by
N. E. Rasmussen
J. G. Kassakian
Electric Power Systems Engineering Laboratory
and
Plasma Fusion Center
School of Engineering
Massachusetts Institute of Technology
September 1979
This work was supported by the U. S. Department of Energy through the MIT
Plasma Fusion Center.
The use of very high power ac to dc thyristor rectifier type power
converters as electromagnetic field energy sources for Tokamak fusion
reactors results in unusual performance and design problems.
In this
study, physical scale models of two such power supplies are constructed
at power levels approximately one-million times smaller than the actual
systems, for purposes of simulation prior to full scale operation.
Simulation results reveal certain undesirable aspects of power supply
operation which were not previously appreciated. New analytical models
are introduced which can be used to predict performance with improved
TABLE OF CONTENTS
Abstract...2
Acknowledgments...3
Introduction... 7
Chapter I. Physical scale model of Alcator C power supply system...12
1.1 System to be modelled...12
1.2 Physical scale model scale factors...20
1.3 Physical scale model construction...25
1.3.1 Model alternator...25
1.3.2 Model TF supply...28
1.3.3 Model TF supply load...29
1.3.4 Model OH supply...30
1.3.5 Model OH supply load...32
1.4 Scale model limitations...32
1.5 Scale model tests of Alcator C power supply...34
1.6 Summary of Alcator C scale model tests...37
Chapter II. Physical scale model of Doublet III power supply system...44
2.1 System to be modelled...44
2.2 Physical scale model scale factors...52
2.3 Physical scale model construction...52
2.3.1 Model Alternator...55
2.3.2 Model TF supply...55
2.3.3 Model TF supply load...57
TABLE OF CONTENTS CONTINUED
2.3.5 Model OH-supply load...58
2.3.6 Model alternator exciter/regulator..58
2.4 Scale model limitations...59
2.5 Scale model tests of Doublet III power
supply...60
Chapter III. Computer model of Alcator C power
supply system...69
3.1 Description of computer algorithm ... .70
3.2 Verification of algorithm...76
3.3 Results from computer tests...
76
3.4 Limitations of computer modelling...77
3.4.1 Computer modelling of regulator
dyriamics ... 82
3.4.2 Computer modelling of multiple
supplies...
83
3.4.3 Summary of limitations...84
Chapter IV. Interpretation of results...85
4.1 Analysis of Alcator C TF supply output capability...85
4.1.1 Output capability lost to commutation reactance ... .86
4.1.2 Output capability lost to power
supply resistance...87
4.1.3 Output capability lost due to alternator speed decrease...87
4.1.4 Output capability lost due to alternator flux decrease...88
4.2 Analysis of Doublet III alternator transient...90
4.2.1 Use of phasor diagram for overshoot estimation...98
TABLE OF CONTENTS CONTINUED
4.2.2 Alternator voltage transient
prevention...103
Chapter V. Operational considerations for regulated rectifier sets...109
5.1 Regulator dynamics...111
5.2 Loop gain variations at extreme phase control angles...116
5.3 Rectification end-stop error...120
5.4 Improved reference voltage source...121
5.5 Multiple rectifier sets...123
5.5.1 Bandwidth limit of orthoginality... .126
5.5.2 Application for supplies using orthoginal control...127
5.6 Free-wheeling diode considerations...127
Conclusions...132
Appendix A. Effects of commutation reactance on six and twelve pulse rectifiers...136
Appendix B. Scale model power supply detailed circuit descriptions...141
Appendix C. Computer program detailed description... 157
INTRODUCTION
Confinement and heating coils in large Tokamak type fusion reactors require high energy pulses of regulated dc power for durations of .5 to 2 seconds. To supply this power the use of dedicated variable
frequency alternators becomes practical as Tokamak peak input power levels excede 100 megawatts. The rotational mass of the alternator is used as an energy
storage device (flywheel) and rotational energy is electrically removed through the armature by operating the alternator into a Tokamak-loaded thyristor rectifier set.
The operation of large alternator-driven thyris-tor type power supplies presents many unusual per-formance and stability problems which have not been encountered before in power systems engineering.
Traditionally, multi-megawatt alternators are designed and specified for operation into balanced, three-phase loads whose impedance changes slowly
when compared with the electrical alternator frequency-. Operating such an alternator into a phase controlled thyristor rectifier set of comparable KVA rating causes the alternator to see a load impedance which
changes dramatically over the course of a single ac cycle and which can give rise to step functions
of alternator load or power factor.
The general solution of the ac to dc converter performance problem is available for converters oper-ating in the rectifier mode from simple reactive
sour-ces
1,2,
3and has been used by Preag
4and others to design
electric utility supplied Tokamaks. Unfortunately, these
solutions are not adequate for use in systems in which the
converter represents nearly the entire rated load of an alternator, since in this case the alternator cannot be represented as a simple reactive source. Behavior of multi-megawatt alternators under both steady state andtransient loading can be determined from published
mod-els5,6 using the machine specifications. These models
must be extended to allow for power converter type loads, since the non-linear load presented to the alternator by the thyristor power converter gives rise to severe alter-nator waveform distortion.
A thyristor rectifier set is normally designed to be driven form a stiff (low reactance) ac source. When a
rectifier set is supplied from an alternator of comparable KVA rating, the rectifier source can no longer be consid-ered stiff and reactances associated with the alternator must be taken into account when determining the loaded dc rectifier output voltage. System performance can only
be predicted and consequently a design can only be attempt-ed when the alternator/rectifier interface is understood.
It is the purpose of this study to investigate phenomena at the alternator/rectifier interface in-cluding:
A) The effect of rapid rectifier phase control variations on internal alternator voltages and exciter control loops.
B) Inter-supply cross coupling resulting from simultaneous operation of two or more supplies from the same alternator.
C) The mechanisims responsible for alternator waveform distortion.
D) The effect of alternator waveform distortion on converter phase-referencing circuits.
The MIT Alcator C Tokamak and the General Atomic Doublet III Tokamak are both alternator driven and currently under construction (1979). In this study, physical scale models of the plasma confinement and ohmic heating supplies for both the Alcator C and Doublet III Tokamaks are constructed.
The practicality of the scale model technique, as applied to converter/alternator systems, has been
7
succesfully demonstrated by Blake . The models are constructed using a one kilowatt model alternator, two six-pulse phase controlled thyristor rectifier sets, a six-hundred joule model confinement coil, and a fifty-five joule model ohmic heating coil. The model alternator and coil parameters are adjusted to
are programmed to generate-specified time functions of the scaled coil currents. The experimental work for this thesis was carried out in the MIT Electric Power
Systems Engineering Laboratory, where an available
model alternator8,9 was modified to satisfy the
re-quirements of this study.In chapter I, the scale model of the MIT Alcator C power supply system is described, and the experimental results are presented. The development of chapter II is parallel to that of chapter I except in this case the
General Atomic Doublet III power supply is simulated.
The results of the scale model of the Alcator C power supply revealed that the output capabiilities of
the design were below specification. Unfortunately, the
scale model study could not be used to determine the
relative importance of the various mechanisims which
together resulted in the sub-specification performance.
Consequently, in chapter III, a special computer model
is developed to supply additional data for use in a
performance analysis.
In chapter IV the results of the Alcator C
sim-ulations of chapters I and III are brought together
and used to determine the reason for the
sub-specifi-cation performance and find modifisub-specifi-cations which could
be used to raise performance.
simulation of chapter II revealed that dangerous tran-sients of the alternator terminal voltage result from system operation. In chapter IV a simplified model is proposed to explain these transients. Also, modifi-cations to the Doublet III system which can remove these
transients are proposed.
In chapter V, fundamental performance limitations of regulated alternator driven phase controlled rectifier type power supplies are examined.
CHAPTER I
PHYSICAL SCALE MODEL OF
ALCATOR C POWER SUPPLY SYSTEM
In this chapter, the physical scale model of the M.I.T. Alcator C power supply is described, and experimental results
are presented. First, the actual Alcator C power supply is briefly described, along with the function that it is expected to perform. Next, the physical scale model is introduced, and correspondence between the model and the actual system is demonstrated. Finally, actual measurements from the model, in the form of oscillograms, are presented, from which the expected performance of the real Alcator C power supply is directly inferred.
1.1 System to be modelled
The basic Alcator C machine is composed of three coils, which provide magnetic fields for the confinement, ohmic
heating, and equilibrium of the experimental plasma. Each of these coils is excited during an experiment using energy extracted from the rotational inertia of the rotor of a 225 MW 3-phase turbo-alternator. The energy is electrically
ex-tracted by operating the alternator in the conventional
manner, the alternator output being stepped down by a pulse-rated transformer group to supply the Alcator C coils via a combination of thyristor rectifier sets.
At the end of an experiment, a significant fraction
of the lost alternator rotational energy remains in the magnetic fields of the coils. Most of this energy isre-turned to the alternator by rectifier phase-controlled
in-version, in which case the alternator is operated as a
syn-chronous motor. All energy dissipated by coil resistance
must be absorbed by the liquid nitrogen coil coolant. The
amount of energy stored in the magnetic field of the TF
coil is approximately 80 MJ during the experiment. If none
of this energy were returned to the alternator, then over
400,000 liters of gaseous nitrogen would be generated by
coolant vaporization after each experiment. Clearly, rapid,
efficient inversion of the stored TF coil energy is desirable.
In this study, the interactions between the rectifier
sets and the alternator are of primary interest. The
alter-nator energy transfer associated with equilibrium supply
operation is smaller than that associated with the heatingor confinement supplies; additionally, the equilibrium supply
does not operate at all during the critical charging of the
confinement field, or during the time of peak alternator
loading. Consequently, in this study, only the operations
of the confinement (TF or Toroidal Field) and ohmic heating(OH) supplies are modelled, which constitute around 89% and
11%, respectively, of the peak alternator load.
The interconnections of the major parts of the Alcator C, TF and OH supplies are shown in figure 1-1. The specified
TF COIL
TF SUPPLY 225 MVA ALTERNATOR (4 modules)
0
FAULT CURRENT
LIMITING REACTORS
OH #1 DICHRG OH #2 >
SUPPLY DICH SUPPLY
SICHG RECONNECT DISCHARGE SWITCH RESISTOR SHORTING SWITCH OH COIL
time-functions of the TF and OH coil currents are shown in figures 1-2 and 1-3. *The sequence of TF supply operations
which igive rise to the current profile of figure 1-2 is
explained:
Phase 1:
TF current ramp-up period. During
this period, the TF supply rectifier set is oper-ated without intentional phaseback, that is, in the simple rectifier mode. The TF supply output voltage jumps from a pre-phase 1 value of 0 Vdc to a value in the neighborhood of 1000 Vdc. As phase 1 continues, the current in the inductive
TF coil rises, being accompanied by a steady
decrease of the supply output voltage. Thesupply output voltage falls due to. a combination of (A) voltage lost to the rectifier commutation reactance; (B) voltage lost to internal supply
resistances; (C) voltage 'lost due to decay of the alternator speed; and (D) voltage lost due to decay of alternator flux. The fraction of the unloaded supply output voltage which is lost
due to these effects approaches 40 to 50 percent
as the end of phase 1 is approached.
Phase 2: TF current flat-top period. When the
TF coil current reaches the preset value of
200 kA (lower preset values can also be used)
the TF supply thyristor-rectifiers are-
oper-ated with intentional phaseback. The
phase-back is adjusted by a closed-loop feedphase-back
system in order to regulate the coil current at the preset value. The current is to be
held constant despite the fall of the alternator voltage and variations of the real and imaginary
44 0 0 D 4 E1 H 0 o o i i H 0 a 4H 0
(fti naiano
aioo
ai
H
parts of the TF coil impedance which result from coil heating and the generation of the experimental plasma. The duration of the flat-top period is adjustable, with a nominal
value of .5 seconds.
Phase 3: TF current inversion period. When
the flat-top period has ended, the rectifier
set is phased back to delay angles greater
than 90 degrees in order to invert the TF coil
current. In this case, the dc coil voltagewill be opposite in sign from the pre-phase
3 voltage, while-coil' induction forces the current to continue in the same direction.Consequently, the direction of power transfer
is reversed, and energy is removed-
from the
TF coil. The inversion voltage must be acarefully.
controlled~function of the TF coil
current during the current ramp-down, in orderto guarantee successful rectifier commutation.
Commutation failure causes the rectifier setto short-circuit, forcing the load current to
decay at the natural load L/R time constant,dissipating the remaining stored magnetic
energy as heat.
The sequence of OH supply operations which give rise to the
current profile of figure 1-3 is explained:
Phase 1:
OH coil ramp-up period. During this
period, one half of the OH supply is connected
across the OH coil and operated withoutphase-back. As in the TF coil ramp-up, the current
in the inductive OH coil rises and is
accom-panied by falling supply output voltage.
-44 0 CNO E-4 H 0 0 -W 4
("~)
INIa
'IIOD
HO
Phase 2:! OH coil crowbar period. When the OH coil current reaches approximately 25 kA, the supply is rapidly phased back to a slightly negative dc output voltage and is immediately
shorted at the output with high current switch
Sl. At this point, the supply current goes to zero due to rectifier misfire, while the OH coil current continues to circulate throughthe crowbar switch, decaying at the natural
OH coil L/R time constant. Once the OH supplycurrent is known to be zero, the supply is
dis-connected by opening another switch, isolatingthe OH coil/crowbar switch loop.
Phase 3: OH coil discharge period. When the OH supply is safely disconnected, -OH coil dis-charge is initiated. A resistor with a value
of around
5 Q
is~:onnected in parallel with
the switch S2; when the switch is opened,sig-nalling the beginning of the OH coil discharge
period, the entire coil current of nearly 25 kA
is forced to circulate through this resistor.The L/R time constant of this circuit is
ap-proximately 5 ms; consequently, the initialOH coil current decays rapidly.
Phase 4:
Second OH coil ramp-up period. When
the OH coil voltage falls to around 500 Vdc, the
second half of the OH supply is connected across the coil using switch S3. The connection is such that the polarity of the rectifier output voltageis opposite to that used during the ramp-up of
phase 1; therefore, the current ramps in the op-posite direction. Timing of the entire OH supplycycle is adjusted so that this second OH coil ramp-up period begins and ends with the TF flat-top period. During this phase, the OH supply may be operated with phaseback, in order to control the shape of the current ramp.
Phase 5: OH coil inversion period. At the end of the second OH current ramp, the ex-periment is over, and as in the TF case, sig-nificant energy remains in the OH coil. Again, much of this energy can be returned to the
al-ternator to prevent coil heating by using phase-controlled inversion.
The first step in the construction of a physical scale model of a rectifier power supply is to represent the
model-ed system by a one line impmodel-edance diagram; the system of figure 1-1 can be reduced to the one line impedance diagram of figure 1-4. Next, the values of the impedances in the one line diagram are scaled. Finally, the scaled values are realized using actual components, and an operating model system is constructed.
1.2 Physical scale model scale factors
In theory, the relationship between a physical scale model and the modelled system is completely described by the
so called "model scale factors". In this study, we are in-terested in the electrical behavior of the systems under investigation, and it is therefore necessary to define model scale factors for:
time, voltage, current, power, energy, and
resistance
These scale factors must be selected in order that certain
defining relationships are preserved by the actual/model
system transformation, and these relationships can be
re-duced to:
energy
=
power x time
voltage
=
current x resistance
power
=
voltage
2/resistance
the model scale factors used in this .study were selected in
accordance with the following four constraints:
(A) The limited energy capacity (1/2 I
2L) of
the available TF power supply inductive load
model
(B) The fixed synchronous reactance of the available model alternator
(C) The constraint that the time scale factor
be 1:1
(D) The practical constraint that the model
power level be as high as possible, in order
to avoid measurement and control errors due
to thyristor holding current, thryistor
for-ward voltage drop, and electromagnetic
interference
These combined constraints on energy, reactance, and time
are sufficient, when applied to the described definingThe selected model scale factors for the Alcator C physical scale model are given in table 1, along with the
actual and model values of the parameters required to de-scribe the alternator, the supplies, and the loads. The required parameters include those from the one line impe-dance diagram of figure 1-4, as well as parameters commonly used. to characterize the alternator.
In practice, the relationship between the model system and the actual system is not completely described by model scale factors, since some characteristics of the actual system are neglected, or represented by the model over
limited regions of operation. Often, the operation of the modeled system is understood well enough, prior to model-ing, to guarantee that the neglected characteristics will contribute tolerable, compensatable, or zero error. When prior knowledge of system operation is inadequate, justifi-cations of model compromises are made by constructing the model and experimentally observing that the boundaries of unrepresented operational modes are not approached. In
this study, these techniques have been used to verify model design. A complete design of a simple model reactor, for example, must address issues of saturation characteristic, resistance, core loss, insulation breakdown voltage, fusing current, capacitance, etc. However, in the descriptions of the Alcator C model subassemblies which follow, only those model limitations which significantly affect the experimental
PARAMETERS OF ALCATOR C POWER SUPPLY SYSTEM MODEL MODEL SCALE FACTORS (re
POWER 1 MODEL WATT VOLTAGE 1 MODEL VOLT CURRENT 1 MODEL AMP TIME 1 MODEL-SEC ALTERNATOR PARAMETERS: PARAMETER ACTUAL V Xd 1.41 p Xd' .265 p Xd" .165 p Tdo 7.01 s T I 1.09 s H 2.36 s bs 14.4 kI Ibase 9021 A Pbase 225 MVj fbase 60 hz TF SUPPLY PARAMETERS: Coil L 4.5 mH Coil R 2.2 m.Q Xtrans .28 pu R .3m Rtrans . G Turns Ratio 16:1 xac bus .05 pu R. .5 mg
dc
bus OH SUPPLY PARAMETERS: Coil L 13 mH Coil R 5 mGl Xtrans 2.42 pu Rtrans 1.04 pu Turns Ratio 16.8:1 Xcl react .347 pu R l react .046 pu ferred to alternator CORRESPONDS TO CORRESPONDS TO CORRESPONDS TO CORRESPONDS TOALUE MODEL VALUE
1 1.41 pu a .26 pu a .165 pu 7.0 s 1.1 s 2.36 s 159 V 1.0 A 275 VA ~60 hz 114.5 H 56 Q 68.1 mH 7.6
a
1:1 12 mH 13.7 0 91. 3 H 35.1 a 587 mH 95 0 2:1 84.3 mH 5.0 Ra side of transformers): 818,181 ACTUAL WATTS 90.6 ACTUAL VOLTS 9021 ACTUAL AMPS 1 ACTUAL SEC COMMENT synchronous reactance transient reactance 'subtransient reactanceopen circuit field T short circuit field 'T
inertia constant
pu on alternator base referred to load side
pu on alternator base
pu on alternator base
pu on alternator base pu on alternator base
14 0 -i 0 0
T9
0
9 -44 41. 4-4i E-4 E--o1.3 Physical scale model construction
Thy physical scale model of the Alcator C power supply
system can be broken down into five basic subassemblies,
which are:
(1) Model alternator
(2) Model TF supply
(3) Model TF supply load
- (4) Model OH supply
(5) Model OH supply load
The interconnection of the subassemblies is illustrated in
the model system diagram of figure 1-5. Functionaldescrip-tions for each of the five subassemblies are given in the
following subsections.
Detailed circuit descriptions are
found in Appendix B.
1.3.1 Model alternator
Located in the MIT Electric Power Systems Laboratory
are a unique group of small (approximately 1 kW) alternators.
These alternators were constructed as accurate scale models
of large turbo-generators used in the American Electric Power
Company's system. In this study, we have chosen to modify
one of these models in such a way that it can serve as a
scale model of the G.E. alternator used in the Alcator C
power supply. To this end, the time constants and per-unit
reactances of the selected model alternator were adjusted, following the procedures outlined by Blake;1 these proceduresG OH R trans - -R OH COIL R neg 4' MODEL ALTERNATOR x d lTE CONTROL TF -4-4 -4 -4 -4 dc ct L MODEL TF COIL x trans R Rtrans Rdchus R neg
It was determined that the synchronous reactance of the
model alternator was the most difficult parameter to adjust,
and consequently it was not modified. Since we desire the
per-unit value of this impedance to correspond to the given
Alcator C alternator value, our decision immediately fixes
the base impedance of the model alternator. Combining this
constraint-
with the one-to-one time scaling and the given
maximum inductive load model energy, we find that the base
power, current, and voltage are also specified (this follows
from the requirement that the ratio of the alternator base
power to the peak inductive load energy must be the same in both the model and actual systems). With this knowledge, thedesired values of the model machine parameters can be computed.
The subtransient reactance (Xd") of the unmodified model alternator is smaller than the required value; therefore
ex-ternal reactors are added at the alternator terminals to
build up the subtransient reactance to the desired value.The transient reactance (Xd') of the model alternator
is adjusted to the required value by the addition of
react-ance in series with the rotor winding.The open circuit transient time constant (Td') is
ad-justed by changing the resistance in series with the rotor
winding.
The inertia constant (H) of the unmodified model is 'much larger than the required value. Since the inertia constant is defined as the ratio of the stored rotational energy at
rated speed to the base power, it is necessary to decrease the rotational inertia of the machine. This is accomplished by making use of a dc motor which is attached to the model alternator rotor shaft. The torque supplied by this motor is made proportional to the rate of change of the rotor ro-tational speed by using a special circuit. Consequently, the motor serves as a brake when the alternator supplies power to the load, and the motor acts to increase rotor
speed when the load supplies power to the alternator. In this way, the apparent rotational inertia of the alternator is decreased.
1.3.2 Model TF supply
The TF supply rectifier set model consists of six thyristors connected in the standard six-pulse rectifier configuration. The rectifier set is supplied from the ac bus (alternator output) through a rectifier transformer model. The model transformer turns ratio is selected to be
one-to-one, allowing the rectifier transformer to be simply represented by its resistance and its leakage and magnet-izing reactances; since the magnetmagnet-izing current is much smaller than the peak (loaded) transformer input current, we replace the magnetizing branch of the transformer with an open circuit. The transformer, then, is represented by inductors with a value equal to the pu value of the leakage reactance of the actual transformer, the inductors.being
connected in series with each of the three input phases to
the rectifier bridge; and by a single resistance in series
with the output of the rectifier bridge with a value equal
to the pu value of the transformer resistance.
The model rectifier set is driven by a gate firing
circuit which is capable of rectification, regulation, and
inversion with load current controlled margin'angle. The
gate firing circuit is slave to a "profile generator"
cir-cuit which controls the sequence and timing of the three
phases of TF supply operation (described in section 1.1).
A dc current transformer senses the supply output for use
by the gate firing circuits during the closed-loop
regula-tion phase and the open-loop controlled inversion phase.
Gate timing reference siglnals are derived from attenuated
alternator terminal voltage.
An additional reactance is placed in series with each
of the three ac input phases to the TF supply model to model
the reactance of the ac bus which connects the supply to
the alternator in the actual system.
1.3.3
Model TF supply load
The TF coil is represented by a simple L-R circuit.
In order to determine load model component values, the
actual TF coil parameters are expressed in pu on the
alter-nator base, where in this case the base impedance is
reflec-ted to the secondary (load side) of the rectifier transformer.
The resulting pu values are then multiplied by the model base impedance to arrive at the load model values.
The available inductive load model is set to the proper value by adjusting the length of the inductor air-gap and selecting the appropriate inductor tap. Unfortunately, the model load resistance in this case is larger than the re-quired value. To compensate for the excessive resistance, a negative resistor (refer to figure 1-5) is inserted in
series with the load model. The negative resistor is gyrated using a floating, non-inverting, 150 Watt, broadband, dc
coupled power amplifier. The connection of the load model, including the negative resistor, is shown in figure 1-5.
An additional resistance is used to connect the model TF supply to the load in order to model the resistance of
the actual dc interconnection bus.
1.3.4 Model OH supply
The OH supply model consists of six thyristors con-nected in the six-pulse rectifier configuration, a
recti-fier transformer model, a model of the supply current limit-ing reactors, and an OH coil switchlimit-ing network.
Two OH supplies are used in the actual Alcator C
system; however, in the mode of OH operation that we repre-sent in this study (push-pull operation) the supplies are never operated simultaneously. Consequently, we have added relay switches in addition to those required in the actual
system in order to allow a single model supply to
effec-tively "change positions" and perform the function of a
twin-supply system.
The turns ratio for this model is selected to be 2:1
(step down) so that the required OH load inductance (afunc-tion of the turns ratio) lies in a-
conveniently simulated
range. In particular, the large peak model OH coil voltage
(20 kV in the actual system) was held below the 2 kV model OH coil design/test voltage by this turns ratio selection.
The reactance on the ac side of the rectifier in the
actual OH supply consists of two parts; namely, thetrans-former reactance and the current limiting reactance. The
total of these two reactances (in pu) must be equal in themodel and actual systems. The reactances of the selected
model transformers were supplemented by external reactors
to raise the total model ac reactance to the required value.
The rectifier set is driven by a gate firing circuit
which is capable of operation at preset open loop firing
angles.
The gate firing circuit is driven by a "profile
generator" circuit which controls the sequence and timing
of the five phases of OH supply operation (described in
sec-tion 1.1).
This profile generator also drives the OH coil
switching network. The OH sequence is initiated by a
com-mand from the TF supply model in order that the TF and
In addition to the OH switching which is specified in the description of the five OH supply operational phases, a supply output reversal is performed during the crowbar
(third) phase to accomplish the twin supply emulation de-scribed above. Conventional electro-mechanical relays are used for all switches in the OH switching network.
1.3.5 Model OH supply load
The OH coil is represented by a simple L-R circuit.
The values of the components used in the model are determined as in the TF case (section 1.3.3) except that in this case the turns ratio of the model transformer must be taken into account. The pu value of.the load, as viewed from the al-ternator through the transformer, must be the same in both the model and actual systems.
A 60 Joule model inductor was adjusted to the appropri-ate value. Unfortunappropri-ately, the time constant of the model load was small due to excessive dc resistance. As in the TF case, a wideband dc coupled power amplifier was connected as a negative resistor and used to lower the effective re-sistance to the required value.
1.4 Scale model limitations
The scale model of the Alcator C power supply contains some compromises which'may affect the accuracy of the
simu-lation results. These inaccuracies are described in the following paragraphs.
The saturation characteristic of the alternator is
not-accurately modeled. This is due to the fact that the model
scale foctors demanded that the model alternator be operated
in a region of negligible saturation, whereas the actualalternator is rated to operate slightly into the curved
region of the saturation characteristic. We conclude that
errors of the measured supply performance due to this effect
are negligible, although measurements of the alternator
field current may contain significant errors. The
al-ternator flux does decay considerably during the experiment,
and therefore any errors due to lack of saturation become
very small during the important flat-top period.The model TF load inductor exhibits a "soft" saturation
characteristic, with measurable saturation extending downto the physical scale model operating level.
This saturation
amounts to less than a 5% decrease in the effective valueof the load inductance at the peak operating current level.
7
This same inductor was used in the work of Blake, however,
in that study the inductor was operated at a 50% higher
cur-rent level and the consequential saturation resulted in
findings differing considerably from those of this study.
The resistance of the actual Alcator C TF coil will not be constant during the experiment, but will instead rise as a result of resistive heating from some nominal value to a projected 2.2 milliohms by the end of the flat-top period.In this study, the projected worstcase value of 2.2 milli-ohms was.assumed for the entire experiment. If the load resistance is substantially lower than this value near the end of the ramp-up period, then the rate of rise of the coil current during that time would be somewhat more rapid than predicted by the physical scale model.
1.5 Scale model tests of Alcator C power supply
The simulation results of the Alcator C physical scale model study are contained in the oscillograms of figures
1-6 through 1-15. The vertical scales represent actual Alcator values of the variables, and were computed using model scale factors. The TF coil voltages were recorded at the coil terminals (after the dc bus resistance) using a 60 Hz two-pole low-pass filter to remove ripple., The ac bug frequency was recorded using an alternator shaft driven
tachometer. The slip of the induction motor (used for
bringing the alternator up to speed between experiments) was assumed to be 2%. Constant field voltage alternator ex-citation was used during all experiments.
Figure 1-6: In this figure the TF coil current fails to reach the programmed 200 kA flat-top level; peak TF coil current is 183 kA at 1.7 seconds; initial alternator vol-tageis 14.6 kV (line to line).
Figure 1-7: With an initial alternator voltage increased to 15.8 kV, the TF coil current again fails to reach the
programmed 200 kA flat-top level; peak TF coil current is 195 kA at 1.6 seconds.
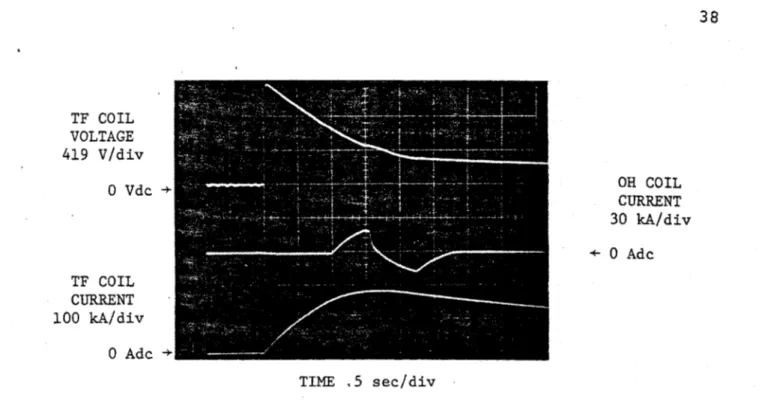
Figure 1-8: With an initial alternator voltage of 15.8 kV the TF coil current easily attains a programmed flat-top
level of 150 kA; time to flat-top is .8 seconds while
total pulse time is 2.5 seconds.
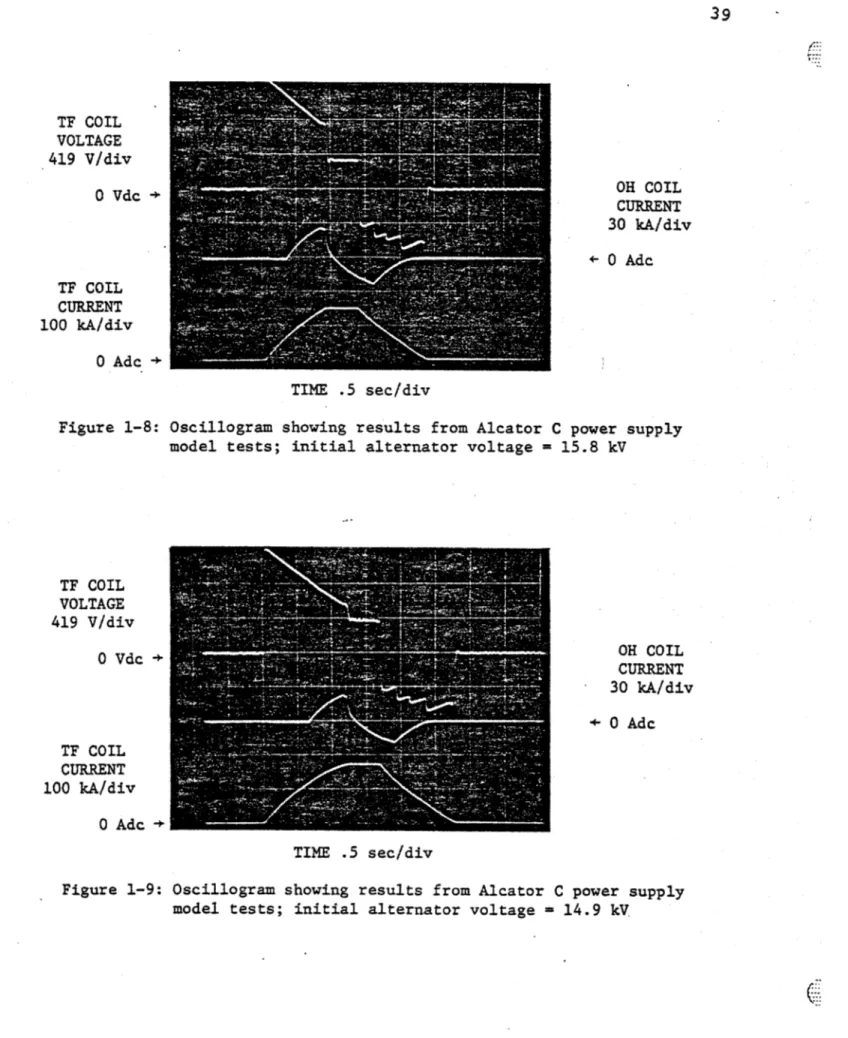
Figure 1-9: With an initial alternator voltage of 14.8 kV the TF coil current attains a programmed 175 kA flat-top
level; in this case the pre-flat-top coil voltage is 590 Vdc,
the time to flat-top is 1.2 seconds, and the total pulse
duration is 2.75 seconds.
Figure 1-10:
In this figure the inversion voltage profile
of the TF supply has been programmed to minimize the
inver-sion time (minimum margin angle); the initial alternator
voltage is 16.6 kV, the pre-flat-top voltage is 775 Vdc,
the time to flat-top is .9 seconds, and the total pulse'
time is 2.25 seconds.
Figure 1-11:
In this figure the alternator frequency
vari-ations which accompany power supply operation are shown.
The frequency at the end of the pulse is 48.5 Hz,corres-ponding to an overall alternator kinetic energy loss of
30.5%; inversion is optimized as in the previous case.
Figure 1-12: An expanded view of the TF coil current shows excellent regulation during the flat-top period (better than 1%) and fast settling time. The OH supply output voltage displays the characteristic droop during the two OH coil
ramp-up periods. In the actual Alcator C OH supply system, the two ramp-up periods are handled by different supplies, so that the curve in this figure can be thought of as the sum of the output voltages of the two supplies.
Figure 1-13: This figure shows the bus distortion immunity of the gate firing circuit of the Alcator C TF power supply;
the .gate firing circuit is required to derive sinusoidal reference voltages from the distorted ac bus voltage in order to determine timing of gate firings; the lack of dis-continuities of the derived waveform insures stable recti-fier triggering (nevertheless, we have found that the ref-erence waveforms are not optimal, and this limitation is discussed in detail in chapter 5).
Figure 1-14: This figure illustrates the effects of commu-tation failure during the inversion period; commucommu-tation fails
at a TF coil current of around 105 kA due to insufficient margin angle. Note that during a commutation failure the inversion voltage is reduced, prolonging the decay of the TF coil current. As the margin angle approaches the commu-tation overlap angle, rectifier commucommu-tation becomes erratic, and the supply output voltage jumps between the desired
inversion voltage and zero, providing reduced average in-version voltage; this effect occurs between TF coil currents of 105 kA and 80 kA in the figure. When the margin angle
is constantly less than the overlap angle, the average supply output voltage is zero, effectively crowbarring the load
current; this effect occurs between TF coil currents of 60 kA
and 50 kA in the figure. In the latter case, the load
cur-rent will decay at the natural L/R time constant of the TF
coil. This condition must be remedied immediately by either
(A) phasing forward the rectifier set or (B) crowbarring the
entire rectifier set.
If one of these steps is not taken,
then the entire coil current will continue to circulate in
one leg of the rectifier transformer, causing transformer
saturation (which will appear as a dc side fault from the
ac side).
The thermal ratings of the thyristors and/or
transformer may also be exceeded.
Figure 1-15:
This figure serves to show the OH coil
cur-rent profile which may result if the switch which initiates
the OH coil discharge period fails to clear.
The switch
arc-over lasts for around .65 seconds, being finally
ex-tinguished when the OH coil current falls to 12 kA. The
breakdown characteristics of the switch used in this study
were not selected to match those of the switch used in the
actual system, and therefore the exact shape of the decay
of the OH coil current is not significant. Nevertheless,
switch clearing must be guaranteed to prevent very high arc
power dissipation.
1.6 Summary of Alcator C scale model tests
We have found that the Alcator C TF supply model is
capable of generating the prescribed current profile using
TF COIL VOLTAGE 419 V/div 0 Vdc + TF COIL CURRENT 100 kA/div 0 Adc -Figure 1-6: OH COIL CURRENT 30 kA/div + 0 Adc TIME .5 sec/div
Oscillogram showing results from Alcator C power supply model tests; initial alternator voltage.= 14.6 kV
TF COIL VOLTAGE 419 V/div 0 Vdc + TF COIL CURRENT 100 kA/div 0 Adc + OH COIL CURRENT 30 kA/div + 0 Ade TIME .5 sec/div
Figure 1-7: Oscillogram showing results from Alcator C power supply model tests; initial alternator voltage = 15.8 kV
-TF COIL VOLTAGE 419 V/div 0
Vdc
+ TF COIL CURRENT 100 kA/div 0 Adc + OH COIL CURRENT 30 kA/div 0 Adc TIME .5 sec/divFigure 1-8: Oscillogram showing results from Alcator C power supply model tests; initial alternator voltage = 15.8 kV
TF COIL VOLTAGE 419 V/div 0
Vdc
+ TF COIL CURRENT 100 kA/div 0 Adc + OH COIL CURRENT 30 kA/div + 0 Adc TIME .5 sec/divFigure 1-9: Oscillogram showing results from Alcator C power supply model tests; initial alternator voltage = 14.9 kV
(
I...TF COIL VOLTAGE 419 V/div 0 Vdc + TF COIL CURRENT 100 kA/div 0 Adc + OH COIL CURRENT 30 kA/div + 0 Adc TIME .5 sec/div
Figure 1-10: Oscillogram showing results from Alcator C power supply model tests; initial alternator voltage = 16.6 kV
58 Hz + FREQUENCY 12 Hz/div TF COIL CURRENT 100 kA/div 0 Adc + OH COIL CURRENT 30 kA/div + 0 Adc TINE .5 sec/div
Figure 1-11: Oscillogram showing results from Alcator C power supply model tests; initial alternator voltage = 16.6 kV
OH SUPPLY VOLTAGE 400 V/div 0 Vdc + TF COIL CURRENT 10 kA/div 180 kAde + OH COIL CURRENT 30 kA/div 0 Ade TIME .5 sec/div
Figure 1-12: Oscillogram showing results from Alcator C power supply model tests; initial alternator voltage = 1:6.6 kV
DISTORTED AC BUS WAVEFORM REFERENCE DERRIVED BY GATE FIRING CIRCUIT TIME (UNCALIBRATED)
Figure 1-13: Oscillogram showing bus distortion immunity of
gate firing circuit
TF COIL VOLTAGE 419 V/div 0
Vdc
+ TF COIL CURRENT 100 kA/div 0 Adc -Figure 1-14: OH COIL CURRENT 30 kA/div + 0 Adc TIME .5 sec/divOscillogram showing results from Alcator C power supply model tests; initial alternator voltage = 15.8 kV
TF COIL VOLTAGE 419 V/div 0 Vdc + TF COIL CURRENT 100 kA/div 0 Ado + OH COIL CURRENT 30 kA/div 0 Adc TIME .5 sec/div
Figure 1-15: Oscillogram showing results from Alcator C power supply model tests; initial alternator voltage = 16.6 kV
-15% initial alternator overvoltage. Under this condition,
we predict the actual Alcator C pre-flat-top TF coil voltage
to be 540 Vdc. This contrasts sharply with the original
system design, which specified that the pre-flat-top
vol-tage be 750 Vdc prior to a 200 kA flat-top current level.The mechanisms responsible for the sub-specification
voltage level are described in chapter 4, where the
rela-tive contribution of each mechanism is determined.
- The Alcator C OH supply was found to be easily capable
of generating the prescribed OH coil current profile. It
was found that the disconnect and reconnect phases of OH operation did not create unusual bus disturbances.CHAPTER II
PHYSICAL- SCALE MODEL OF
DOUBLET III POWER SUPPLY SYSTEM
In this chapter, the physical scale model of the Gen-eral Atomic Doublet III power supply is described, and ex-perimental results are presented. First, the actual Doub-let III power supply is briefly described, along with the function it is expected to perform. Next, the physical
scale model is introduced. Due to the si milarities between the Doublet III and Alcator C power supplies, many of the parts of the Alcator model are utilized in the Doublet model, although componentEvalues are modified to suit the
new DoubletIII scale factors. Finally, actual measurements from the model, in the form of oscillograms, are presented, from which the expected performance of the real Doublet III power supply is directly inferred.
2.1 System to be modeled
The structure of the Doublet III machine is similar -to that of the Alcator C machine, and again the operations of the confinement (TF) and ohmic heating (OH) supplies are modeled. In this case, however, the designed peak power
consumptions of the TF and OH coils are nearly equivalent, whereas a 8 to 1 TF to OH peak power ratio was used in
Alcator C. Unfortunately, as a result of the transformer turns ratios selected in the Doublet III system, alternator
overcurrents exceeding 70% are possible if the two Doublet
III power supplies operate as designed. Therefore, GeneralAtomic has decided to run only half of the OH supply in
con-junction with the full TF supply, on order to reduce the
peak alternator armature current. Consequently, this
con-figuration (full TF/half OH) is modeled in the following
simulations.
A major difference between the Doublet III and Alcator C systems is that Doublet III alternator excitation is
sup-plied by a high speed exciter/regulator which is connected
for closed-loop regulation of the alternator terminal
vol-tage. Although the Alcator C experiments can be runeffec-tively using only constant field voltage excitation, the
longer Doublet III experimental interval would allow rotor
flux decay and consequent alternator ouptut voltage loss
if no field forcing had been implemented.
General Ptomic discovered during tests of a similar but
smaller Doublet II system that unusual and alarming
tran-sients of the alternator terminal voltage resulted from
system operation. An important motivation for the present
scale model study was to identify the mechanisms responsible
for the alternator voltage transients and to predict the transients that might be expected during the operation of the new Doublet III system.
The Doublet III system is designed to return the energy remaining in the TF coil to the alternator after the ex-periment. However, during initial testing and low level operation of the system, a free-wheeling diode (FWD) is to be connected across the TF load. Although a FWD does not
allow for inversion of the coil current at the end of an experiment, it does afford some measure of protection in case of rectifier or dc bus failure. If the load current is interrupted at any time during the TF current pulse by rectifier or dc bus failure, the FWD will "pick up" and circulate the TF coil current, allowing it to decay at the natural L/R time constant of the coil. It was desired to know what effect, if any, the FWD might have on system op-eration, particularly with regard to power supply control strategies and the previously mentioned alternator voltage transients.
The interconnections of the major parts of the Doublet III TF and OH supplies are shown in figure 2-1. The
speci-fied time-functions of the TF and OH coil currents are shown in figures 2-2 and 2-3. The sequence of TF supply opera-tions which gives rise to the current profile of figure 2-2 is explained:
Phase 1: TF current ramp-up period. During this period, the TF supply rectifier set is operated without intentional phaseback. The TF supply output voltage jumps from a pre-phase 1 value of 0 Vdc to a value in the
12 PULSE TF RECTIFIERS (8 modules) 0 260 MVA ALTERNATOR TF COIL 12 PULSE OH RECTIFIERS (4 modules)
K
OH COILSWITCH NETWORK OH COILDIT K
DISCHARGE NETWORKFigure 2-1: Iterconne-ctions of DoiubIet"III power supply
C
I I -- I - I - 5 I 0 .14 5-4 S 0 C) 0 E-4. E-q H 0 CD 0 0 cc 1 -It C.'4
'IT
-I 0 0> 0 0neighborhood of 1500 Vdc. As phase 1 continues, the current in the inductive load rises, being accompanied by a steady decrease of the supply output voltage. The supply output voltage falls due primarily to the voltage lost to the com-mutation reactance.
Phase 2: TF current flat-top period. When the TF coil current reaches the preset value of 126 kA the TF supply is phased back to the regulation mode. As in the Alcator C experiments, the duration of the flat-top period is .5 seconds.
Phase 3:
TF coil inversion period. When the
flat-top period has ended, the rectifier set is phased back to delay angles of greater than 90 degrees in order to invert the coil current and return the remaining stored magnetic TF coil energy to the alternator. If a FWD isplaced across the load, then the coil current
will abruptly cease to flow through the recti-fier set upon rectirecti-fier phaseback, and noenergy is returned to the alternator. In this case the coil current decays with the natural L/R time constant.
The sequence of OH supply operations which gives rise to
the current profile of figure 2-3 is explained:
Phase 1: OH coil ramp-up period. During this
period the OH supply is connected across the OH
coil and operated as a simple rectifier. As in the TF case, the inductive OH coil current rises, being accompanied by falling supply outputH 0 4 '.0 0 C14 C-4 I 0 0 -i Hn * c (W) 'IOD I~lM3 H
Phase 2: OH coil crowbar period. When the OH coil current reaches 110 kA, the supply is rapidly phased back and shorted with a crowbar
switch. This results in supply misfire,
caus-ing the coil current to circulate in the OHcoil/crowbar switch loop. When the OH supply
current is known to be zero, the supply is
disconnected using a second switch. The output
polarity of the supply is now changed using a
DPDT reversing switch, in preparation for the4th phase.
Phase 3:
OH coil discharge period. When the
OH supply is safely disconnected, OH discharge
is initiated. A capacitor/resistor combination
is connected in parallel with the crowbar switch; when the switch is opened, signalling thebe-ginning of the discharge period, the entire coil current of nearly 110 kA is forced through the
R-C branch resulting in a damped oscillation
with a natural frequency of around 3.5 Hz. The
OH coil current falls rapidly, reversing
direc-tion as the capacitor begins to return energy.Phase 4:
Second OH coil ramp-up period. When
the OH coil current reaches a value of -85 kA,
the OH supply is reconnected and phased on.
The polarity of the supply is reversed from
that of the first phase due to the reversal
switching which took place during phase 2;
therefore, the current ramps in the oppositedirection. Timing of the entire OH supply
cycle is adjusted so that this second OH coil
ramp-up period begins and ends with the TFPhase 5: OH coil inversion period. At the end-of the second OH ramp-up period, the OH supply is inverted to return the remaining OH coil magnetic energy to the alternator.
As in the case of the Alcator C system the first step towards the construction ofa physical scale model is to represent the modeled system by a one-line impedance dia-gram. This is accomplished in figure 2-4. Next the impe-dances are scaled, and the scaled values are then used in
the construction of the physical scale model.
2.2 Physical scale model scale factors
The model scale factor selection is accomplished using the principles and constraints outlined in chapter 1. The selected scale factors for the Doublet III model are listed in table 2. along with the actual and model values of the system parameters.
2.3 Physical scale model construction
The physical scale model of the Doublet III power supply system can be broken down into six subassemblies, which are:
(1) Model alternator
(2) Model TF supply
(3) Model TF supply load (4) Model OH supply
(5) Model OH supply load
ALTERNATOR TF SUPPLY Xbus Xtrans Xus trans Ed (TF) Ed (OH) OH SUPPLY
TABLE II
PARAMETERS OF DOUBLET III POWER SUPPLY SYSTEM MODEL
MODEL SCALE FACTORS: POWER 1 MODEL WATT VOLTAGE 1 MODEL VOLT CURRENT 1 MODEL AMP TIME 1 MODEL SEC
ALTERNATOR PARAMETERS:
PARAMETER ACTUAL VAL
Xd 2.22 pu X ' .33 pu Xd .232 pu T do' 6.0 s Td' 1.0 s H 5.215 s Vbase 13.8 kV Ibase 10878 A P base 260 MVA fbase 60 hz TF SUPPLY PARAMETERS: Coil L 30.57 mHi Coil R 4.185 mL Xtrans .2815 pu Turns Ratio 23.03:1 Xac bus .021 pu OH SUPPLY PARAMETERS: Coil L 1.55 mH Coil R 1.1 mD xtrans .437 pu Turns Ratio 19.43:1 Cdischarge 1.36 F xac bus .059 pu CORRESPONDS TO CORRESPONDS TO CORRESPONDS TO CORRESPONDS TO UE MODEL VALUE 2.22 pu .33 pu .232 pu 6.0 s 1.0 s 5.2 s 142 V 1.39 A -344 VA 60 hz 327 H 44.5 Q .28 pu 1:1 .02 pu 47 H 33 92 .44 pu 1:1 45 .F .06 pu 755,813 ACTUAL WATTS 97.2 ACTUAL VOLTS 7826 ACTUAL AMPS 1 ACTUAL SEC COMMENT synchronous reactance transient reactance subtransient reactance open circuit field short circuit field inertia constant
pu on alternator base
pu on alternator base
pu on alternator base
the model system diagram of figure 2-5. Detailed circuit descriptions are given in Appendix'B. The following
sub-sections are meant to supplement the Alcator C model
de-scriptions of section 1.3 by outlining the changes which are required in order to adapt the Alcator C model toper-form to Doublet III specifications.
2.3.1 Model alternator
The model alternator is adjusted to the new Doublet III parameters using the procedures of section 1.3.1. The
Doublet III model alternator is excited by the model exciter/
regulator which is described in section-2.3.6.
2.3.2 Model TF supply
The actual Doublet III supplies are twelve pulse
rec-tifiers, whereas six pulse rectifiers are used in this
sim-ulation. The discussions of six and twelve pulse rectifiersin Appendix A show that the regulation characteristics
(which describe how the dc rectifier output voltage will
vary with load) of these two types of rectifiers are
iden-tical until the rectifier load exceeds a certain value. Unfortunately, calculations reveal that the Doublet III TF
and OH supplies exceed this value during times of peak out-put current. This implies that the model TF and OH six pulse rectifiers will not give the proper output voltage
MODEL ALTERNATOR GATE CONTROL trans
OH
Rtrans 0--"-) 1-i
Ti
I-MODEL ALTERNATOR EXCITER Xd I trans Rt trans Rdcbus R neg -4kL
de ct MODEL TF COIL OH COIL negduring the critical times near the TF flat-top period.
Also, supply input power factors will be in error due tothe six pulse modeling of the twelve pulse system. Due
to the fact that the rectifiers operate only slightlyout-side the regions where six pulse modelling is appropriate,
it is possible to compensate, to a first order, for these
errors by increasing th6 model commutation reactance.Due to the nature of six and twelve pulse rectifier
regulation characteristics, a twelve pulse rectifier
oper-ated with a certain commutation reactance can have regula-tion and input power factor characteristics very close tothose of a six pulse rectifier which has slightly higher
commutation reactance. The amount which the six pulserectifier commutation reactance must be raised to achieve a.
twelve pulse emulation depends on the load current at which
the minimum simulation error is desired.
In this study, we desire that the modeling be accurate
during the critical TF coil flat-top period. Adding 15%
to the actual pu values of the TF and OH supply commutation
reactances significantly reduces six pulse regulation and
power factor errors during TF flat-top.2.3.3 Model TF supply load
The model TF supply load used in section 1.3.3 was adjusted to the appropriate Doublet III value. Again, the use of a series connected negative resistor was required.
2.3.4 Model OH supply
During Doublet III OH supply operation the output of the supply must be reversed using a special switch. The Alcator C simulation made use of just such a switch (see
section 1.3.4). Consequently, no modification was neces-sary in order to include this feature.
In the actual Doublet III system a series R-C circuit replaces the resistor used in the Alcator C OH coil switch-ing network. The appropriate scaled R-C values were there-fore installed in the model for this simulation.
2.3.5 Model OH supply load
The model OH supply load was appropriately adjusted and used, as before, in combination with a series connected negative resistor.
2.3.6 Model alternator exciter/regulator
The model alternator has a high power exciter available. It was necessary to measure the alternator terminal voltage, compare it to some set point level, and supply an appropri-ate error signal to the exciter in order to complete the
-regulator loop.
In this study, the actions of the regulator are of particular importance. Therefore it is critical that the model regulator and the actual regulator are both attempting to regulate the same measure of the alternator terminal