XV. COMMUNICATIONS BIOPHYSICS
Prof. W. A. Rosenblith Dr. N. Y-S. Kiang J. L. Hall II Prof. M. Eden Dr. N. M. Onesto*** P. Latourtft Prof. M. H. Goldstein, Jr. Dr. T. T. Sandel** S. L. Levine
Prof. W. T. Peake Dr. A. Yildiz C. E. Molnar
Dr. J. S. Barlowt W. A. Clark, Jr. ** Clare Monck
Dr. Eda Berger$ Aurice V. Albert D. F. O'Brien
Dr. M. A. B. Braziert H. Blatt A. P. Paul
Dr. B. G. Farley** J. E. Brown C. C. Robinson
Dr. G. L. Gersteintt R. M. Brown G. C. Vineyard
Dr. E. M. Glaser$ A. H. Crist R. F. Webber
Dr. F. B. Goffintt C. D. Geisler T. F. Weiss
A. PERIPHERAL NERVE RESPONSES TO PERCUTANEOUS ELECTRIC STIMULATION IN MAN
Some of the properties of the ulnar nerve in man were studied in experiments involving percutaneous stimulation of a peripheral nerve trunk by square pulses of cur-rent and percutaneous recording of the summated action potential by means of a gross electrode. Certain characteristics of these neural responses to single shocks and pairs of shock stimuli were determined (1).
Placing stainless-steel electrodes at the wrist and elbow (where the nerve is super-ficial) permits percutaneous stimulation and recording from the ulnar nerve in man (2). The skin under the electrodes was prepared to yield a minimal skin resistance. The sub-ject was asked to relax his arm by minimizing his own electromyographic activity which was displayed to him at intervals throughout the recording session. The stimuli were
square pulses of current, isolated from ground, of fixed duration (0. 5 msec) and vari-able amplitude. The responses were recorded by a Grass Kymograph camera, and data reduction was achieved by an analog-to-digital device that produced punched cards which, in turn, were processed by an IBM 704 computer.
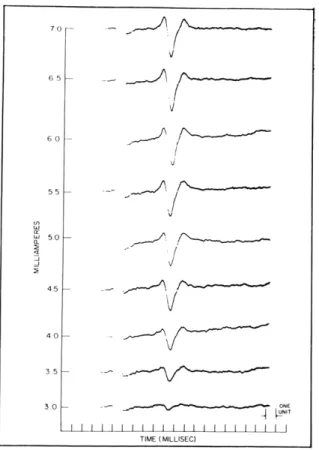
If a series of stimuli of increasing magnitude is presented, responses such as those shown in Fig. XV-1 are elicited. The responses are triphasic compound action poten-tials. Their amplitude increases and the latency of the "peak" of the response decreases slightly (from 7. 7 msec to 7. 3 msec in one subject) with increasing stimulus intensity.
This work was supported in part by the U.S. Air Force under Contract AF19(604)-4112.
Research Associate in Communication Sciences from the Neurophysiological Laboratory of the Neurology Service of the Massachusetts General Hospital.
lPostdoctoral Fellow of the National Institute of Mental Health. **Staff Member, Lincoln Laboratory, M. I. T.
"Postdoctoral Fellow of the National Institute of Neurological Diseases and Blindness. "Guest of the Research Laboratory of Electronics, from Johns Hopkins University.
***Research Associate in Communication Sciences and Fellow in the School for Advanced Study, M. I. T. TOn leave from the Instituut voor Zintuigfysiologie RVO-TNO, Soesterberg, Netherlands.
(XV. COMMUNICATIONS BIOPHYSICS)
Fig. XV-1.
Responses to square-pulse stimuli. The abscissa indicates time;
numbers along the ordinate indicate the magnitude of the stimulus.
(Session 11-23; Subject J. W.)
Since these responses show little "desynchronization" with increasing stimulus intensity,
we can conclude that the response arises from the summation of action potentials of
neu-ral units, all of which exhibit nearly the same conduction velocity.
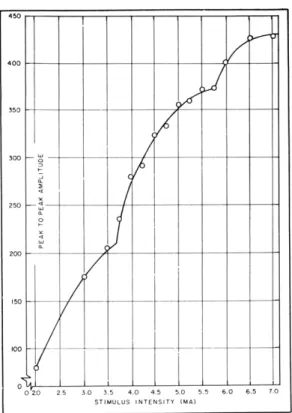
The functional dependence of the amplitude of the response on stimulus intensity is
displayed by the so-called intensity function (Fig. XV-2). The intensity functions for all
subjects were multilimbed, sometimes showing two limbs, sometimes as in Fig. XV-2,
three.
The amplitude of the response depends not only on the intensity of the stimulus
delivered to the skin but also upon the placement of the stimulating electrode relative to
the nerve at the wrist, and upon the impedance of the skin. Since the last two factors
differ from session to session, data from different sessions cannot be compared in
abso-lute values.
Moreover, the characteristics of an electrode may change within a single
experimen-tal session, and this change may produce rather large changes in the magnitude of
the response for a given value of stimulus intensity (1).
In Fig. XV-3, four sets
of 100 responses each were taken for different electrode "positions." The electrode was
70 65 J - -45 -40 3.5 -30 -ON TIME (MILLISEC)
Fig. XV-2.
Intensity function; the functional relationship between peak-to-peak
ampli-tude of the response and stimulus intensity.
Each point is the mean
peak-to-peak amplitude of 40 responses. Stimulus intensity is plotted along the
abscissa; the peak-to-peak amplitude (arbitrary units) is plotted along the
ordinate. (Session 10-1; Subject N. L.)
0 oo.M.U oo Eo
AMPLITUDE
AMPLITUDE
Fig. XV-3.
Distribution of response amplitude for four electrode positions. Each
shaded region represents 100 responses for different electrode
posi-tions. The electrode position strongly affects the mean value for each
group of 100 responses. (Session 11-24; Subject G. M.)
0 50 100 150
AMPLITUDE
(BASE TO PEAK)
200 250 300
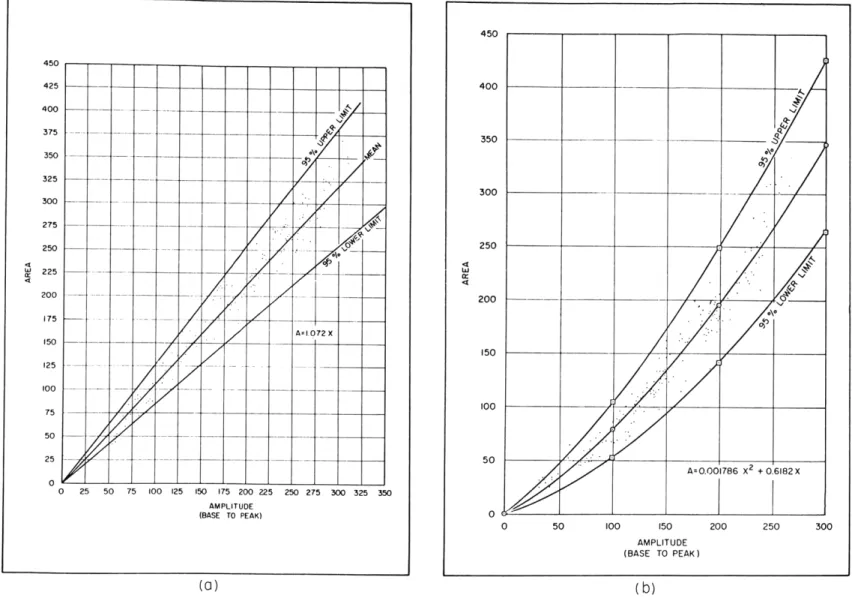
Fig. XV-4.
Area under a response versus base-to-peak amplitude. The linear regression of the data yielded: (a) line
of best fit, A = 1.072 X.
(Session 10-20; Subject J. W.); (b) curve of best fit that was quadratic, A =
0.001786 X
2(XV. COMMUNICATIONS BIOPHYSICS)
3.5 7.0 4.0 crr W 4.5 a. 2 7.04
V/
5.0 --~
5.5 I- I I I I 7.07.0-ONE UNIT TIME (MILLISEC)Fig. XV-5.
Responses to square-pulse stimuli.
The abscissa indicates time; numbers
along the ordinate indicate the magnitude of the stimulus. The series of
responses to successively increasing stimuli is shown, with each response
compared with the response to a large (7-ma) stimulus.
Notice the
desyn-chronizing effect of stimulating the second population of neural structures.
(Session 11-23; Subject K. K.)
removed each time and replaced as precisely as possible on the same spot; this proce
-dure produced functionally different electrodes.
Since the observed response is presumably a summated action potential, the "area
under a response" is a more appropriate measure of the activity than is the
peak-to-peak amplitude.
The relation between the area under a response and its base-to-peak
amplitude was determined and is shown in Fig. XV-4; the base-to-peak amplitude is
lin-early related to the peak-to-peak amplitude.
For half of the subjects, this area is
linearly related to the amplitude (Fig. XV-4a); but the other half of the subjects showed
a significant deviation from linearity (Fig. XV-4b).
This departure from linearity may
be attributable to the desynchronization of the response waveform which occurs in these
subjects at higher stimulus intensities, as shown in Fig. XV-5.
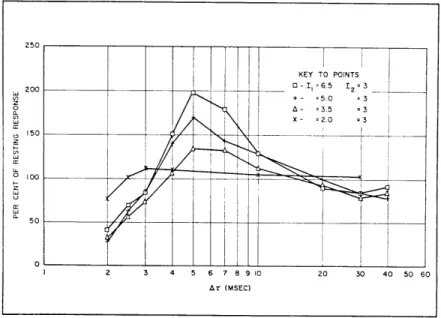
If two square pulses of current separated by a short time interval are presented as
stimuli, the response to the second stimulus shows a "recovery of responsiveness"
(XV. COMMUNICATIONS BIOPHYSICS)
(Fig. XV-6) whose typical time course runs as follows: Subnormality from 0 to 3 msec; supernormality from 4 to 15 msec, followed by subnormality from 15 msec to 100 msec. This time course of the recovery is predictable from known properties of axons, such as threshold variability (3), and the recovery cycle of excitability (4). The supernormal-ity that is observed can be explained in terms of the superexcitabilsupernormal-ity of single axons. If the first stimulus excites a portion of the axonal population and the second stimulus is weaker than the first (S1 > S2), then the second stimulus may be presented to a population
Fig. XV-6.
Recovery of responsiveness. The relative amplitude (as a percentage of the resting response) is plotted along the ordinate; the numbers along the abscissa represent time separation, AT, between conditioning and testing stimulus. Each point is the mean of 20, or more, responses. The recovery curves are parametric in II , with 12 held constant. The larger Il was made, the larger the supernormality became. (Session10-27; Subject N. L.)
of superexcitable axons, provided that the time interval between the stimuli is correctly
chosen.
Hence, S
2will fire more axons in the superexcitable population than if it had
been presented in isolation.
This situation may explain the supernormality seen in
Fig. XV-6.
If both stimuli of the pair are equal, that is, S1 = S
2 ,the response to S
2may be expected to be slightly supernormal; units that have been rendered
superexcit-able by S
1will be refired by S
2 ,and some of the units that had a threshold that was too
high at the instant of S, presentation will have undergone spontaneous threshold changes
that will allow them to be fired by S
2 .Similar reasoning may be applied for the interval
for which there is subnormality.
250 200 z 150 0 o z LI 0 0 2 3 4 5 6 7 8 9 10 20 30 40 50 60 Ar (MSEC)(XV. COMMUNICATIONS BIOPHYSICS)
The experimental work for the writer's thesis (1) was performed in the IBM Research Center, Yorktown Heights, New York, under the direction of Dr. W. R. Uttal.
J. E. Brown
References
1. J. E. Brown, A Parametric Study of Neuroelectric Responses to Skin Stimuli, S. M. Thesis, Department of Electrical Engineering, M. I. T., 1960.
2. G. D. Dawson and J. W. Scott, The recording of nerve action potentials through skin in man, J. Neurol. Neurosurg. Psychiat. 12, 259-267 (1949).
3. C. Pecher, La fluctuation d'excitabilit6 de la fibre nerveuse, Arch. Int. Physiol. 49, 129-152 (1939).
4. H. T. Graham and R. Lorente de N6, Recovery of blood perfused mammalian nerves, Am. J. Physiol. 123, 326-340 (1938).
B. SPECTRAL ANALYZER FOR ELECTROENCEPHALOGRAPHY
This report describes an analog-digital spectral analyzer constructed entirely of commercially available instruments. The component instruments are all of general laboratory usefulness; plug-in connections hook them together to form the spectral ana-lyzer which can be assembled and disassembled in a matter of minutes.
A requirement for the analyzer is that the potentials to be processed must be recorded on magnetic tape so that they can be replayed repeatedly. The elements and the instruments used in our analyzer are: magnetic tape recorder and reproducer sys-tem (Ampex Recorder/Reproducer FR-1107); variable electronic filter (Spencer-Kennedy
Laboratories Variable Electronic Filter Model 302); squaring circuit (Ballantine True Root Mean Square Electronic Voltmeter Model 320); frequency modulator (FM units of the Ampex recorder); and electronic counter (Beckman/Berkeley Universal EPUT and
Timer). A calibrated potentiometer was placed at the output of the electronic filter and was used in conjunction with the voltage range switch on the voltmeter to keep the input to the squaring circuit of the Ballantine voltmeter in the proper range. In each case there are instruments of other manufacturers that would serve as well as the ones we used. The component parts are assembled as shown in Fig. XV-7.
Spectral analysis is accomplished by measuring the energy in the filtered waveform for different settings of the filter. The procedure for measuring energy is as follows:
(i) The section of tape to be processed is replayed by the recorder.
(ii) The counter is set to zero at the start of the record and read at the end. (The
This work was sponsored jointly by the U.S. Air Force Office of Scientific Research, Air Research and Development Command, through its European Office, under Contract AF 61 (052)-107 and by the Rockefeller Foundation.
(XV. COMMUNICATIONS BIOPHYSICS)
Fig. XV-7. Block diagram of the spectral analyzer.
Berkeley counter has a mode of operation "scan" in which it counts the number of events (cycles) in a length of time that is an integral number of seconds or tens of seconds. This mode is useful for "push-button" operation of the analyzer. The counter may also be arranged to count events in the time interval between stop and start pulses obtained from markers on the tape, or on a tape loop. )
(iii) A short circuit is placed on the input to the electronic filter and the counter is run for the same time interval as in the previous step.
(iv) The difference between the readings in steps (ii) and (iii) is proportional to the energy in the filtered signal.
Calibration in terms of mean-square voltage or rms voltage is obtained by recording a calibration signal on the tape and processing it.
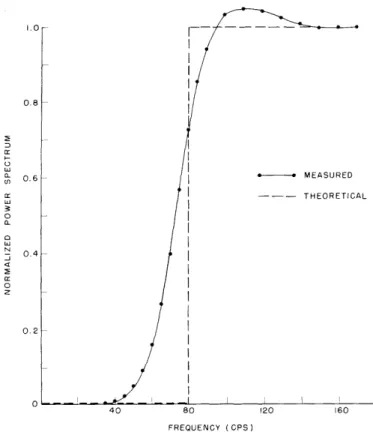
The type and resolution of the spectral analysis depend on the way in which the elec-tronic filters are used. EEG signals with a large part of their spectral content below 10 cps and very little above 100 cps are not adapted to direct analysis by commercial filters which have a higher frequency range. It is necessary, and convenient, to play back the EEG signals at a speed higher than that used in recording and thus to shift the frequency range proportionally higher. This also speeds up the analysis. We have obtained estimates of the power spectrum of EEG signals by analyzing them with low-pass filtering. The record is replayed for a number of settings of the filters. The res-olution of the method is indicated in Fig. XV-8 in which the analysis was performed on a sinusoid. Of course, higher resolution (a more sudden step in the curve) is obtain-able by cascading a number of filter sections.
If a measure of power spectral density rather than spectrum is desired it can be obtained by taking differences of points in the spectral plot, or directly, by using the filters in a bandpass configuration.
The analysis is now being applied to recordings from the cortex of chronic and acute preparations under differing physiological conditions. Figure XV-9 gives spectral plots from a chronic cat, asleep and awake. The record from the sleeping cat showed much "synchronized spindle activity," while the record during arousal would be characterized as "fast desynchronized activity." Note the greater proportion of power below 10 cps
I--I
I
Ii
MEASURED THEORETICAL 80 120 160 FREQUENCY (CPS)Fig. XV-8. Measured and theoretical power spectra of an 80-cps sinusoid. One section of the Spencer-Kennedy Laboratories filter, which gives an attenuation of 18 db per octave above cutoff frequency, was used.
o--- '0-/ C
I
I
I
r I I AROUSED (30kv rms) o---o ASLEEP (67 gv rms) I I I I I I I I FREQUENCY (CPS)Examples of spectral analysis. power spectrum and rms voltage
These potentials were recorded frontal and temporal regions of records analyzed were: 160 sec,
The analyzer was used to measure of EEG from a chronic preparation.
with electrodes on the dura of the the same side. The lengths of the
arousal; 240 sec, asleep.
147
0.8
Fig. XV-9.
- - - -O
-0---(XV. COMMUNICATIONS BIOPHYSICS)
and the higher rms voltage during sleep. To analyze a record of approximately four minutes duration, with a tape speed-up of 8, takes approximately 30 minutes. This time is for the push-button method of operation; the system could be considerably speeded up by using automatic triggering of the counter and a tape loop.
We cannot attempt in this report to compare the present analyzer with other EEG ana-lyzers; however, a few characteristics of the method will be mentioned. By integrating over the entire length of the record, the spectral analyzer measures long-term charac-teristics of the EEG but does not pick out separate events in the course of the recording. Thus, the implicit model is one of a stationary time series. How well this model fits the experimental situation depends upon one's success in maintaining the preparation in a
"steady state."
On the practical side, we might point out that the absolute accuracy of the analyzer is largely determined by the squaring circuit; for our arrangement it is approximately 5 per cent. The repeatability of measurements depends upon the drift in the frequency modulator and active elements; the variation is less than one per cent. The digital out-put is convenient for work when quantitative results are desired.
It should also be pointed out that the equipment listed here is quite costly and not standard in most EEG laboratories. An analyzer of the type described could be con-structed at a cost far below the total cost of the instruments that we have employed.
M. H. Goldstein, Jr., L. Nicotra
(Dr. Leopoldo Nicotra is at the Istituto di Fisiologia, Universit' di Pisa. Dr. Goldstein carried out this work there while he was Science Faculty Fellow of the National Science Foundation on leave from Massachusetts Institute of Technology. )


![Rôles et mécanismes d'action du récepteur AT[indice inférieur 2] de l'angiotensine II d'un modèle cellulaire neuronal au tissu prostatique humain l'importance du contexte](data:image/gif;base64,R0lGODlhAQABAIAAAP///wAAACH5BAEAAAAALAAAAAABAAEAAAICRAEAOw==)