Characterization of a temporoparietal junction subtype of Alzheimer’s disease
Running title: AD temporoparietal subtype
François Meyer1, Marie Wehenkel1,2, Christophe Phillips1, Pierre Geurts2, Roland Hustinx3, Claire Bernard3, Christine Bastin1, Eric Salmon1, and the Alzheimer’s Disease Neuroimaging
Initi-ative*
1 GIGA-Cyclotron Research Centre in vivo imaging, University of Liège, Liège, Belgium 2 Department of Electrical Engineering and Computer Science, University of Liège, Liège, Belgium
3 Nuclear Medecine Department, CHU of Liège, University of Liège, Liège, Belgium *Data used in preparation of this article were obtained from the Alzheimer’s Disease
Neuroim-aging Initiative (ADNI) database (adni.loni.usc.edu). As such, the investigators within the ADNI contributed to the design and implementation of ADNI and/or provided data but did not participate in analysis or writing of this report. A complete listing of ADNI investigators can be
found at: http://adni.loni.usc.edu/wp-content/uploads/how_to_apply/ADNI_Acknowledge-ment_List.pdf
Corresponding author:
François Meyer, Cyclotron Research Centre, Quartier Agora, B30 Sart Tilman, Allée de Six-Août 8, 4000 Liège, Belgium. Tel: +322844394. E-mail: francois.meyer@chuliege.be
ACKNOWLEDGMENT, CONFLICTS AND FUNDING SOURCES
The authors have no conflict of interest. FM is a Candidate PhD Specialist, MW is a Research Fellow, CP is a Senior Research Associate, and CB is a Research Associate at the FRS-FNRS (Belgian Fund for Scientific Research).
The authors certify that they have no affiliations with or involvement in any orgazination or entity with any financial interest or non-financial-interest in the subject matter or materials discussed in this manuscript.
Data collection and sharing for this project was funded by the Alzheimer's Disease Neuroimaging Initiative (ADNI) (National Institutes of Health Grant U01 AG024904) and DOD ADNI (Department of Defense award number W81XWH-12-2-0012). ADNI is funded by the National Institute on Aging, the National Institute of Biomedical Imaging and Bioengineering, and through generous contributions from the following: AbbVie, Alzheimer’s Association; Alzheimer’s Drug Discovery Foundation; Ar-aclon Biotech; BioClinica, Inc.; Biogen; Bristol-Myers Squibb Company; CereSpir, Inc.; Cogstate; Eisai Inc.; Elan Pharmaceuticals, Inc.; Eli Lilly and Company; EuroImmun; F. Hoffmann-La Roche Ltd and its affiliated company Genentech, Inc.; Fujirebio; GE Healthcare; IXICO Ltd.; Janssen Alz-heimer Immunotherapy Research & Development, LLC.; Johnson & Johnson Pharmaceutical Re-search & Development LLC.; Lumosity; Lundbeck; Merck & Co., Inc.; Meso Scale Diagnostics, LLC.; NeuroRx Research; Neurotrack Technologies; Novartis Pharmaceuticals Corporation; Pfizer Inc.; Piramal Imaging; Servier; Takeda Pharmaceutical Company; and Transition Therapeutics. The Canadian Institutes of Health Research is providing funds to support ADNI clinical sites in Canada. Private sector contributions are facilitated by the Foundation for the National Institutes of Health (www.fnih.org). The grantee organization is the Northern California Institute for Research and Edu-cation, and the study is coordinated by the Alzheimer’s Therapeutic Research Institute at the Univer-sity of Southern California. ADNI data are disseminated by the Laboratory for Neuro Imaging at the University of Southern California.
ABSTRACT
Alzheimer’s disease (AD) subtypes have been described according to genetics, neuropsychology, neuropathology and neuroimaging. 31 patients with clinically probable AD were selected based on perisylvian metabolic decrease on FDG-PET. They were compared to 25 patients with a typical pat-tern of decreased posterior metabolism. Tree-based machine learning was used on those 56 images to create a classifier that was subsequently applied to 207 ADNI patients with AD. Machine learning was also used to discriminate between the two ADNI groups based on neuropsychological scores. Compared to AD patients with a typical precuneus metabolic decrease, the new subtype showed stronger hypometabolism in the temporoparietal junction. The classifier was able to distinguish the two groups in the ADNI population. Both groups could only be distinguished cognitively by Trail Making Test-A scores. This study further confirms that there is more than a typical metabolic pattern in probable AD with amnestic presentation.
1. INTRODUCTION
Alzheimer’s disease (AD) is known as the primary cause of dementia worldwide. With the growing knowledge of AD biomarkers and physiopathology of the disease (Jack et al., 2016), diagnostic cri-teria have evolved to obtain a common and reliable disease definition that can be used in both research and clinical practice (McKhann et al., 2011). However, it has also long been known that AD is a composite disease with heterogeneous subtypes in terms of genetics, with more than 20 loci described as part of the pathophysiology (Karch & Goate, 2015), with early and late age at onset, characterized by difference in distribution of cortical hypometabolism (Frisoni et al., 2005; Kim et al., 2005), and different clinical presentations, with amnestic, posterior cortical atrophy, progressive primary aphasia and frontal variants (Alladi et al., 2007; Galton, Patterson, Xuereb, & Hodges, 2000). Even within the typical amnestic presentation, there is heterogeneity in cognitive profiles (Fisher, Rourke, & Bieliauskas, 1999; Lambon R, Patterson, Graham, Dawson, & Hodges, 2003; Stopford, Snowden, Thompson, & Neary, 2008; Strite, Massman, Cooke, & Doody, 1997; Vardy et al., 2013) and patterns of cortical hypometabolism of patients (Salmon et al., 2009).
Among the many tools used in the diagnosis and classification of AD, Positron Emission Tomography with [18F]fluorodeoxyglucose (FDG-PET) is one of the most common neuroimaging technique both in clinical practice and in the research field. In AD, cortical metabolism is typically decreased in the temporoparietal cortex , the precuneus and the posterior cingulate cortex (Herholz et al., 2002; Minoshima et al., 1997). These regions belong to the Default Mode Network (DMN), involved in self-directed cognition. The DMN has been divided into three subsystems: the Medial-Temporal Lobe (MTL) subsystem (including the hippocampal and parahippocampal regions), the Dorsomedial sub-system (including the dorsomedial prefrontal cortex and the temporoparietal junction) and the Mid-line Core subsystem (including the precuneus, the posterior cingulate cortex and the anteromedial prefrontal cortex) (Andrews-Hanna, Reidler, Sepulcre, Poulin, & Buckner, 2010). In AD, the MTL subsystem is the most affected in terms of cortical atrophy, with typical hippocampal volume reduc-tion, whereas hypometabolism is particularly important in the core subsystem (Grothe, Teipel, & Alzheimer's Disease Neuroimaging, 2016).
Beside the classical distribution of cortical hypometabolism, heterogeneity was frequently reported in FDG-PET among AD patients (Bokde et al., 2001; Foster et al., 1983; Kim et al., 2005; Salmon et al., 2009). With this heterogeneity in mind, the goal of the current study was to characterize a peculiar pattern of FDG-PET hypometabolism where decreased activity is prominent in the perisylvian area on visual analysis by comparison to a more typical posterior medial cortical involvement (typical pattern) in AD patients with an amnestic clinical profile.
The first step in the current study was to study a small sample of patients from the Memory Clinic, CHU Liege, to statistically confirm the visual analysis of predominant perisylvian hypometabolic pattern. The second step was to analyze clinical profiles related to the metabolic subtype in a larger group of AD patients, using the ADNI database.
2. MATERIALS AND METHODS 2.1. Population 1: GIGA CRC group 2.1.1. Participants
Subjects referred to our nuclear medicine department for differential diagnosis of AD type dementia were selected based on FDG-PET visual inspection.
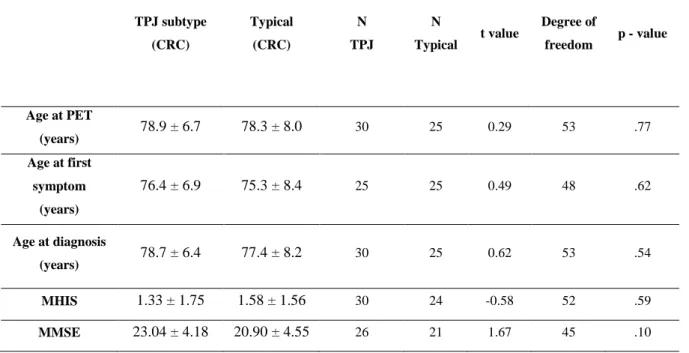
A first group of 31 patients was gathered because FDG-PET was characterized by a predominant posterior perisylvian hypometabolism at visual inspection. Brain CT showed predominant atrophy in the same regions. A second group (named typical), gathered over one year, included 25 subjects with a classical AD-like cortical hypometabolism on FDG-PET, comprising involvement of the temporo-parietal and posteromedial cortices (Herholz et al., 2002). The later participants were selected to have similar age and gender compared to the patients with major perisylvian involvement (the new tem-poroparietal junction or TPJ subtype). The demographic data are represented in Table 1, and t-tests show no significant difference between the typical and TPJ subtype groups in terms of age at PET time, age at first symptoms, age at diagnosis, modified Hachinski ischemic scale (MIHS) score (Hachinski, Oveisgharan, Romney, & Shankle, 2012) and mini-mental state examination (MMSE) score (Folstein, Folstein, & McHugh, 1975).
All subjects met National Institute on Aging-Alzheimer’s Association clinical criteria for possible AD dementia (McKhann et al., 2011). Due to the retrospective design of this part of the study, bi-omarker information was limited to neurodegeneration (variable hippocampal atrophy) and patients did not have consistent neuropsychological data to be compared between groups.
For group comparison in SPM12, a control group of 12 healthy older adults without cognitive complaints consisted in participants who underwent a cerebral FDG-PET on the same scanner as the patients. The control subjects were significantly younger than the AD subjects and age was introduced as a covariate of no interest in the statistical analysis of FDG-PET.
FDG-PET scan was performed 30 minutes after intravenous injection of ~150 MBq of FDG using a Gemini TF or Gemini TF Big-Bore PET-CT scanner (Philips Medical Systems, Amsterdam, Nether-lands) with a 18 cm axial field of view and a 4.8 mm resolution in air. Patients had their eyes closed. A low-dose CT was acquired for attenuation correction, followed by a 12-minute emission scan. The images were reconstructed using a LOR-RAMLA algorithm and corrections for attenuation, dead-time, random events, and scatter were applied. Reconstructed images had 2 mm isotropic spatial res-olution and a 128x128x90 matrix size.
Preprocessing and statistical analyses of FDG-PET images were conducted with SPM12 (Wellcome Centre for Human Neuroimaging, UCL, London, UK). Spatial normalization was first obtained by matching each subject’s PET image to the MNI PET template provided in SPM. Those normalized images were then averaged to create an FDG-PET group-specific template smoothed with a Gaussian kernel of 8 mm full width at half maximum. This group-specific template was then used to spatially normalize patients and controls’ PET images. For this classical statistical analysis only, normal-ized images underwent a smoothing with a Gaussian kernel of 12 mm full width at half maxi-mum.
For statistical comparison, processed FDG-PET images of the three groups were entered in a General Linear Model in SPM12 using a factorial design to perform statistical comparison between the two patient groups (TPJ and typical subtypes), and healthy controls using proportional scaling by cerebral global mean values to control for FDG uptake variability. Age, mean-centered on the overall mean, was entered as a nuisance variable. The threshold for statistical significance was set at p < .05 with correction for multiple comparisons (FWER, family-wise error rate) at the voxel level over the whole brain volume.
2.2. Population 2: ADNI database 2.2.1. Selection of subjects
Variability in clinical profile associated with the two FDG-PET (classical and TPJ) subtypes observed in our initial sample was evaluated in a larger population well-characterized at the neuropsychological level, using ADNI (Alzheimer’s disease neuroimaging initiative) database of AD patients (for up-to-date information, see www.adni-info.org)
All included subjects underwent the same neuropsychological tests, as well as cerebral FDG-PET. We selected all 241 mild AD patients for which a FDG-PET image was available at baseline in this database. On visual inspection, thirty-four subjects were discarded because FDG-PET images
were of suboptimal quality. The FDG-PET data (n=207) corresponded to the raw images recorded at their entrance in the study (ADNI 1 and ADNI2 baseline). Beside neuropsychological variables, we also collected data regarding age at PET scan, gender, level of education and amyloid burden (esti-mated with [18F]Florbetapir PET).
2.2.2. FDG-PET analysis
Raw FDG-PET images from ADNI database were preprocessed in SPM12 following a similar procedure as for population 1, without smoothing.
The visually labelled data in the CRC dataset were used to construct a machine learning-based classifier to predict FDG-PET labels in the 207 AD subjects from ADNI. A group-selection pro-cedure (Wehenkel, Sutera, Bastin, Geurts, & Phillips, 2018) with 500 Extra-trees (Geurts, Ernst, & Wehenkel, 2006) based on the Automated Anatomical Labelling (AAL) atlas (Tzourio-Mazoyer et al., 2002) was used to reduce the feature set before learning. Extra-trees are a var-iant of Breiman’s Random forests (Breiman, 2001), which replaces bootstrap sampling in this latter method by a randomization of the discretization thresholds. This often results in im-proved performance (Geurts et al., 2006). The method depends on two parameters, the number T of trees in the ensemble and the number K of features drawn at each decision tree node. In all experiments in this paper, T was fixed to 500 and K was set to its default value, which is the square root of the total number of input features. Our group selection procedure (Wehenkel et al., 2018) exploits variable importance scores derived from Random forests models and random permutations to rank groups of features, corresponding in our case to brain regions from the Automated Anatomical Labelling atlas (Tzourio-Mazoyer et al., 2002), according to their rele-vance for predicting the output class. We used the CERr variant of this procedure with a signif-icance threshold set to 0.05 and, for increased robustness, we retained the regions that were selected more than half of the time in 10 repetitions of 10-fold cross-validation.
Performance of the classifier was assessed by reverse learning. More precisely, once ADNI labels were inferred from CRC data, a new Extra-trees model was fitted from ADNI with the same param-eters and feature reduction. The model was then tested on the GIGA CRC population in order to estimate performance of the former classifier. As the classifier provides class probability estimates, the performance was measured by computing the area under receiver operating characteristic (ROC) curves (AUC).
From all the information contained in the ADNI database, we selected the following tests or scales of interest that were available for all participants: Alzheimer’s Disease Assessment Scale (ADAS 13), Neuropsychiatric Inventory (NPI), Clinical Dementia Rating Scale (CDR), Mini Mental State Exam (MMSE), Rey Auditory-Verbal Learning Test (RAVLT), animal fluency, Trail Making Test (TMT A and B), Logical Memory immediate and delayed recall and the Boston Naming Test (BNT). Data from Digit Span and vegetable fluency were not selected because of too many missing values.
Using the labels predicted from the classifier (trained on the first population to predict the label in the second one), machine learning was used to construct a new model discriminating between the two AD groups, based on neuropsychological scores. In order to have good interpretability of the problem, the model chosen was a Random forests ensemble (Extra-trees). The analysis of variable importance scores derived from this model (Louppe, Wehenkel, A., & Geurts, 2013) enabled the identification of the most relevant neuropsychological scores to differentiate the two groups. Im-portance scores were averaged over ten repeats to obtain this ranking. Post-hoc Student t-test was used to confirm between-group differences that had clinical meaning.
2.2.4. Interregional correlations in FDG-PET data in the ADNI population
In order to better characterize the cerebral networks affected in the two groups of subjects, SPM12 multiple regression was used to search for interregional metabolic correlations, between peak voxel values of the most discriminant regions obtained in our first population (left precuneus and left temporoparietal junction reported in Table 2, taken as seed regions) and FDG-PET metabolism in the other regions of the brain, in the ADNI population. The threshold for statistical significance was set at p < .05 with correction for multiple comparisons (FWER, family-wise error rate) at the voxel level for the whole brain.
3. RESULTS
3.1. FDG-PET statistical analysis in population 1 (GIGA CRC group)
The results of the SPM12 group comparisons are summarized in Table 2. When each group was separately compared to the control group, both AD types showed a significant decrease of metabolic activity in the left precuneus (Fig 1). The direct comparison between the typical and the TPJ subtype group (with perisylvian involvement) revealed that the typical subjects showed significant hypome-tabolism in the left precuneus and the right inferior temporal cortex compared to the TPJ subtype,
whereas the TPJ subtype subjects showed a significant decrease of metabolic activity in the temporo-parietal junction compared to typical subjects (Fig 2). This analysis thereby statistically confirmed and specified the visual inspection.
3.2. Population 2: Classification of ADNI FDG-PET data and analysis of clinical profiles 3.2.1. Classification of subjects
A feature selection procedure highlighted eleven relevant regions of interest for subsequent classifi-cation (the left rolandic operculum, the superior parietal gyri, the right angular gyrus, the bilateral precuneus, the Heschl gyri, the left superior temporal gyrus, the right middle temporal gyrus and the right inferior temporal gyri), based on the Automated Anatomical Labelling atlas or AAL (Tzourio-Mazoyer et al., 2002). We thus reduced our feature set to only these regions and fitted an ensemble of 500 Extra-trees on the learning set.
Using only these regions of interest, the classifier was able to distinguish two groups in the ADNI population similar to the initial two subtypes observed in the GIGA CRC data. Out of 207 subjects, the percentage of TPJ subtype subjects was38% (78 participants, while 129 subjects FDG-PET were labelled as typical).
Using the reverse learning method with the CRC population, the area under the curves showed 86.11% (± 0.36%) accuracy of our classifier.
Considering the labels defined by the classifier, the TPJ subtype subjects from the ADNI population were significantly older than typical subjects (p < .001) but did not differ in terms of level of education or MMSE. The proportion of amyloid positive PET was similar in both groups (62% in TPJ, 77% in typical patients, chi-square 2.344, p=.126), with the limitation that only half of the subjects underwent a [18F]Florbetapir PET.
3.2.2. Neuropsychological results
Machine learning was used to construct a model discriminating one group from the other, based on neuropsychological scores. In this model, the features are the neuropsychological scores and the cor-responding output is the group of the AD patient previously predicted by the classifier model. The only test that consistently occupied the first position throughout the ten repeats from the Extra-trees model was the TMT-A (time of completion). The importance of this test to discriminate between the subjects was further confirmed with a t-test, and TMT-A response times was significantly faster in
the TPJ subtype group (M = 57.97 seconds, SD = 29.2) than in the typical group (M = 73.23 seconds, SD = 40.17; t (203) = 2.99, p < .005). This was confirmed when performing correction for mul-tiple comparisons of the scores selected in section 2.2.3.
3.2.3 Interregional correlations in FDG-PET
In the typical group, activity in the left precuneus (seed: x = -3, y = -46, z = 46) mostly significantly correlated with metabolism in parietal and premotor regions (Figure 3A). In the TPJ subtype, activity in the left temporoparietal junction (seed: x = -60, y = -4, z = 7) essentially correlated with metabolism in perisylvian regions (Figure 3B).
4. DISCUSSION
In this study, we report a new metabolic subtype with decreased glucose metabolism (and atrophy) predominant in the perisylvian region, that could be referred to as temporoparietal junction (TPJ) subtype. Initially detected by visual inspection in patients from a clinical sample, significant differ-ences in metabolic activity between this subtype (TPJ hypometabolism) and a more typical group with predominant hypometabolism of the posteromedial cortex were confirmed using SPM12. A Ex-tra-trees classifier was then constructed based on this first analysis and was applied to an ADNI pop-ulation. With this classifier, we were able to label 78 ADNI AD patients as TPJ subtypes out of 207 subjects with a probable mild AD diagnosis, with high accuracy level (85.84% of correct labelling with a reverse learning method). Accordingly, the TPJ subtype observed in about 38% of ADNI amnestic AD patients appears as a consistent variant of the typical FDG-PET profile.
Heterogeneity of regional brain pathology is well documented in AD. Subtypes have been described from a neuropathological viewpoint, with the observation of typical, limbic and cortical subtypes (Murray et al., 2011) and with the description of Alzheimer’s pathology in atypical clinical presenta-tions (Alladi et al., 2007; Galton et al., 2000). These neuropathological presentapresenta-tions correlate with the heterogeneity observed in neuroimaging studies with MRI (Ridgway et al., 2012; Whitwell et al., 2012) or FDG-PET (Bokde et al., 2001; Foster et al., 1983; Kim et al., 2005). Based on these findings of heterogeneity, AD is currently seen as a wide spectrum with different clinical and neuropsycho-logical presentations (amnestic, posterior cortical atrophy, progressive primary aphasia and frontal variants) that are reflected in imaging and neuropathological studies (Galton et al., 2000; McKhann et al., 2011; Murray et al., 2011). These correlations have also been studied in the early onset presen-tation of the disease: typical amnestic early-onset AD, logopenic progressive aphasia and posterior cortical atrophy were associated with disease-specific reductions in cortical thickness (Ridgway et al., 2012).
Clinical and neuropsychological heterogeneity has also been associated with different patterns of cortical hypometabolism. Different networks are specifically involved depending on the neuropsy-chological presentation. Although the Default Mode Network (DMN) is involved in all AD subtypes, focal patterns of hypometabolism characterize each variant: the left temporoparietal cortex in the logopenic variant, the ventral DMN in the early-onset or the bilateral prefrontal cortex in the execu-tive/frontal variants (Lehmann et al., 2013; Vanhoutte et al., 2017).
Even if both regions belong to the DMN, predominant TPJ and posteromedial hypometabolism do not seem to reflect variants of a same network breakdown. Indeed, with seed-based interregional correlation analysis previously used to reveal metabolic patterns in AD (Lehmann et al., 2013; Seeley,
Crawford, Zhou, Miller, & Greicius, 2009), we found a predominant correlation of the metabolism of the left precuneus with parietal and pre-motor regions in the typical group, and a prominent corre-lation between the metabolism of the left TPJ and that of perisylvian regions in the TPJ subtype. The TPJ subtype was not characterized by severe medial temporal involvement or by relative spar-ing of the hippocampus compared to the typical subtype (Ferreira et al., 2017; Murray et al., 2011). It cannot be considered as a diffuse involvement of associative cortices (Noh et al., 2014; Park et al., 2017) or as a group with no atrophy (Ferreira et al., 2017).
ADNI data allowed examining whether these different metabolic profiles are associated with distinct clinical presentations. Actually, the two groups (typical and TPJ subtype) could only be distinguished by age (i.e., TPJ subtype patient being older) and by very few, non-memory neuropsychological tests such as TMT-A, with faster response time in the TPJ subtype group compared to the typical subtype group. As TMT-A test mainly involves visuomotor and attention abilities, we could assume that these abilities are more affected in the typical group. Interestingly, in an fMRI study, brain activity was observed in motor, premotor and visual areas in healthy subjects performing a TMT-A task (Karimpoor et al., 2017). Therefore, the metabolic connectivity we described between premotor re-gions and metabolically impaired left precuneus in the typical group could participate to their lower performance at this test. Nevertheless, apart from this difference, patients from the two types could not be clearly distinguished in terms of cognitive or neuropsychiatric profile. Clinically, they were all found to fulfill the clinical diagnosis of amnestic AD (McKhann et al., 2011). Moreover, compared to healthy older participants, they all demonstrated reduced metabolism in the precuneus. Also most of the patients had significant amyloid burden on PET in both groups. Yet, the prominent cortical site of neurodegeneration varied between them.
5. CONCLUSION
The current findings suggest that a relatively comparable clinical presentation in AD can be accompanied by a typical FDG-PET pattern or by a clearly distinct metabolic TPJ subtype, although one cannot exclude that current clinical evaluation was not sensitive enough to differentiate the two groups.
REFERENCES
Alladi, S., Xuereb, J., Bak, T., Nestor, P., Knibb, J., Patterson, K., & Hodges, J. R. (2007). Focal cortical presentations of Alzheimer's disease. Brain, 130(Pt 10), 2636-2645. doi:
10.1093/brain/awm213
Andrews-Hanna, J. R., Reidler, J. S., Sepulcre, J., Poulin, R., & Buckner, R. L. (2010). Functional-anatomic fractionation of the brain's default network. Neuron, 65(4), 550-562. doi:
10.1016/j.neuron.2010.02.005
Bokde, A. L., Pietrini, P., Ibanez, V., Furey, M. L., Alexander, G. E., Graff-Radford, N. R., Rapoport, S. I., Schapiro, M. B., & Horwitz, B. (2001). The effect of brain atrophy on cerebral hypometabolism in the visual variant of Alzheimer disease. Arch Neurol, 58(3), 480-486.
Breiman, L. (2001). Random forests. Machine learning, 45(1), 5-32.
Ferreira, D., Verhagen, C., Hernandez-Cabrera, J. A., Cavallin, L., Guo, C. J., Ekman, U., Muehlboeck, J. S., Simmons, A., Barroso, J., Wahlund, L. O., & Westman, E. (2017). Distinct subtypes of Alzheimer's disease based on patterns of brain atrophy: longitudinal trajectories and clinical applications. Sci Rep, 7, 46263. doi: 10.1038/srep46263
Fisher, N. J., Rourke, B. P., & Bieliauskas, L. A. (1999). Neuropsychological subgroups of patients with Alzheimer's disease: an examination of the first 10 years of CERAD data. J Clin Exp
Neuropsychol, 21(4), 488-518. doi: 10.1076/jcen.21.4.488.887
Folstein, M. F., Folstein, S. E., & McHugh, P. R. (1975). "Mini-mental state". A practical method for grading the cognitive state of patients for the clinician. J Psychiatr Res, 12(3), 189-198. Foster, N. L., Chase, T. N., Fedio, P., Patronas, N. J., Brooks, R. A., & Di Chiro, G. (1983).
Alzheimer's disease: focal cortical changes shown by positron emission tomography.
Neurology, 33(8), 961-965.
Frisoni, G. B., Testa, C., Sabattoli, F., Beltramello, A., Soininen, H., & Laakso, M. P. (2005). Structural correlates of early and late onset Alzheimer's disease: voxel based morphometric study. J Neurol Neurosurg Psychiatry, 76(1), 112-114. doi: 10.1136/jnnp.2003.029876 Galton, C. J., Patterson, K., Xuereb, J. H., & Hodges, J. R. (2000). Atypical and typical
presentations of Alzheimer's disease: a clinical, neuropsychological, neuroimaging and pathological study of 13 cases. Brain, 123 Pt 3, 484-498.
Geurts, P., Ernst, D., & Wehenkel, L. (2006). Extremely randomized trees. Mach Learn, 63, 3-42. Grothe, M. J., Teipel, S. J., & Alzheimer's Disease Neuroimaging, I. (2016). Spatial patterns of
atrophy, hypometabolism, and amyloid deposition in Alzheimer's disease correspond to dissociable functional brain networks. Hum Brain Mapp, 37(1), 35-53. doi:
10.1002/hbm.23018
Hachinski, V., Oveisgharan, S., Romney, A. K., & Shankle, W. R. (2012). Optimizing the
Hachinski Ischemic Scale. Arch Neurol, 69(2), 169-175. doi: 10.1001/archneurol.2011.1698 Herholz, K., Salmon, E., Perani, D., Baron, J. C., Holthoff, V., Frolich, L., Schonknecht, P., Ito, K.,
Mielke, R., Kalbe, E., Zundorf, G., Delbeuck, X., Pelati, O., Anchisi, D., Fazio, F.,
Kerrouche, N., Desgranges, B., Eustache, F., Beuthien-Baumann, B., Menzel, C., Schroder, J., Kato, T., Arahata, Y., Henze, M., & Heiss, W. D. (2002). Discrimination between Alzheimer dementia and controls by automated analysis of multicenter FDG PET.
Neuroimage, 17(1), 302-316.
Jack, C. R., Jr., Bennett, D. A., Blennow, K., Carrillo, M. C., Feldman, H. H., Frisoni, G. B., Hampel, H., Jagust, W. J., Johnson, K. A., Knopman, D. S., Petersen, R. C., Scheltens, P., Sperling, R. A., & Dubois, B. (2016). A/T/N: An unbiased descriptive classification scheme for Alzheimer disease biomarkers. Neurology, 87(5), 539-547. doi:
10.1212/WNL.0000000000002923
Karch, C. M., & Goate, A. M. (2015). Alzheimer's disease risk genes and mechanisms of disease pathogenesis. Biol Psychiatry, 77(1), 43-51. doi: 10.1016/j.biopsych.2014.05.006
Karimpoor, M., Churchill, N. W., Tam, F., Fischer, C. E., Schweizer, T. A., & Graham, S. J. (2017). Tablet-Based Functional MRI of the Trail Making Test: Effect of Tablet Interaction Mode. Front Hum Neurosci, 11, 496. doi: 10.3389/fnhum.2017.00496
Kim, E. J., Cho, S. S., Jeong, Y., Park, K. C., Kang, S. J., Kang, E., Kim, S. E., Lee, K. H., & Na, D. L. (2005). Glucose metabolism in early onset versus late onset Alzheimer's disease: an SPM analysis of 120 patients. Brain, 128(Pt 8), 1790-1801. doi: 10.1093/brain/awh539 Lambon R, M. A., Patterson, K., Graham, N., Dawson, K., & Hodges, J. R. (2003). Homogeneity
and heterogeneity in mild cognitive impairment and Alzheimer's disease: a cross-sectional and longitudinal study of 55 cases. Brain, 126(Pt 11), 2350-2362. doi:
10.1093/brain/awg236
Lehmann, M., Ghosh, P. M., Madison, C., Laforce, R., Jr., Corbetta-Rastelli, C., Weiner, M. W., Greicius, M. D., Seeley, W. W., Gorno-Tempini, M. L., Rosen, H. J., Miller, B. L., Jagust, W. J., & Rabinovici, G. D. (2013). Diverging patterns of amyloid deposition and
hypometabolism in clinical variants of probable Alzheimer's disease. Brain, 136(Pt 3), 844-858. doi: 10.1093/brain/aws327
Louppe, G., Wehenkel, L., A., S., & Geurts, P. (2013). Understanding variable importances in forests of randomized trees. In C. J. C. Burges, L. Bottou, M. Welling, Z. Ghahramani & K. Q. Weinberger (Eds.), Advances in Neural Information Processing Systems 26 (NIPS 2013) (Vol. 26, pp. 431-439): Curran Associates, Inc.
McKhann, G. M., Knopman, D. S., Chertkow, H., Hyman, B. T., Jack, C. R., Jr., Kawas, C. H., Klunk, W. E., Koroshetz, W. J., Manly, J. J., Mayeux, R., Mohs, R. C., Morris, J. C., Rossor, M. N., Scheltens, P., Carrillo, M. C., Thies, B., Weintraub, S., & Phelps, C. H. (2011). The diagnosis of dementia due to Alzheimer's disease: recommendations from the National Institute on Aging-Alzheimer's Association workgroups on diagnostic guidelines for Alzheimer's disease. Alzheimers Dement, 7(3), 263-269. doi: 10.1016/j.jalz.2011.03.005 Minoshima, S., Giordani, B., Berent, S., Frey, K. A., Foster, N. L., & Kuhl, D. E. (1997). Metabolic
reduction in the posterior cingulate cortex in very early Alzheimer's disease. Ann Neurol,
42(1), 85-94. doi: 10.1002/ana.410420114
Murray, M. E., Graff-Radford, N. R., Ross, O. A., Petersen, R. C., Duara, R., & Dickson, D. W. (2011). Neuropathologically defined subtypes of Alzheimer's disease with distinct clinical characteristics: a retrospective study. Lancet Neurol, 10(9), 785-796. doi: 10.1016/S1474-4422(11)70156-9
Noh, Y., Jeon, S., Lee, J. M., Seo, S. W., Kim, G. H., Cho, H., Ye, B. S., Yoon, C. W., Kim, H. J., Chin, J., Park, K. H., Heilman, K. M., & Na, D. L. (2014). Anatomical heterogeneity of Alzheimer disease: based on cortical thickness on MRIs. Neurology, 83(21), 1936-1944. doi: 10.1212/WNL.0000000000001003
Park, J. Y., Na, H. K., Kim, S., Kim, H., Kim, H. J., Seo, S. W., Na, D. L., Han, C. E., Seong, J. K., & Alzheimer's Disease Neuroimaging, I. (2017). Robust Identification of Alzheimer's Disease subtypes based on cortical atrophy patterns. Sci Rep, 7, 43270. doi:
10.1038/srep43270
Ridgway, G. R., Lehmann, M., Barnes, J., Rohrer, J. D., Warren, J. D., Crutch, S. J., & Fox, N. C. (2012). Early-onset Alzheimer disease clinical variants: multivariate analyses of cortical thickness. Neurology, 79(1), 80-84. doi: 10.1212/WNL.0b013e31825dce28
Salmon, E., Kerrouche, N., Perani, D., Lekeu, F., Holthoff, V., Beuthien-Baumann, B., Sorbi, S., Lemaire, C., Collette, F., & Herholz, K. (2009). On the multivariate nature of brain metabolic impairment in Alzheimer's disease. Neurobiol Aging, 30(2), 186-197. Seeley, W. W., Crawford, R. K., Zhou, J., Miller, B. L., & Greicius, M. D. (2009).
Neurodegenerative diseases target large-scale human brain networks. Neuron, 62(1), 42-52. doi: 10.1016/j.neuron.2009.03.024
Stopford, C. L., Snowden, J. S., Thompson, J. C., & Neary, D. (2008). Variability in cognitive presentation of Alzheimer's disease. Cortex, 44(2), 185-195. doi:
Strite, D., Massman, P. J., Cooke, N., & Doody, R. S. (1997). Neuropsychological asymmetry in Alzheimer's disease: verbal versus visuoconstructional deficits across stages of dementia. J
Int Neuropsychol Soc, 3(5), 420-427.
Tzourio-Mazoyer, N., Landeau, B., Papathanassiou, D., Crivello, F., Etard, O., Delcroix, N., Mazoyer, B., & Joliot, M. (2002). Automated anatomical labeling of activations in SPM using a macroscopic anatomical parcellation of the MNI MRI single-subject brain.
Neuroimage, 15(1), 273-289. doi: 10.1006/nimg.2001.0978
Vanhoutte, M., Semah, F., Rollin Sillaire, A., Jaillard, A., Petyt, G., Kuchcinski, G., Maureille, A., Delbeuck, X., Fahmi, R., Pasquier, F., & Lopes, R. (2017). (18)F-FDG PET
hypometabolism patterns reflect clinical heterogeneity in sporadic forms of early-onset Alzheimer's disease. Neurobiol Aging, 59, 184-196. doi:
10.1016/j.neurobiolaging.2017.08.009
Vardy, E. R., Ford, A. H., Gallagher, P., Watson, R., McKeith, I. G., Blamire, A., & O'Brien, J. T. (2013). Distinct cognitive phenotypes in Alzheimer's disease in older people. Int
Psychogeriatr, 25(10), 1659-1666. doi: 10.1017/S1041610213000914
Wehenkel, M., Sutera, A., Bastin, C., Geurts, P., & Phillips, C. (2018). Random Forests Based Group Importance Scores and Their Statistical Interpretation: Application for Alzheimer's Disease. Front Neurosci, 12, 411. doi: 10.3389/fnins.2018.00411
Whitwell, J. L., Dickson, D. W., Murray, M. E., Weigand, S. D., Tosakulwong, N., Senjem, M. L., Knopman, D. S., Boeve, B. F., Parisi, J. E., Petersen, R. C., Jack, C. R., Jr., & Josephs, K. A. (2012). Neuroimaging correlates of pathologically defined subtypes of Alzheimer's disease: a case-control study. Lancet Neurol, 11(10), 868-877. doi: 10.1016/S1474-4422(12)70200-4
TABLES
Table 1. T test results studying the homogeneity of the “TPJ subtype” group and the Typical group in the CRC population TPJ subtype (CRC) Typical (CRC) N TPJ N Typical t value Degree of freedom p - value Age at PET (years) 78.9 ± 6.7 78.3 ± 8.0 30 25 0.29 53 .77 Age at first symptom (years) 76.4 ± 6.9 75.3 ± 8.4 25 25 0.49 48 .62 Age at diagnosis (years) 78.7 ± 6.4 77.4 ± 8.2 30 25 0.62 53 .54 MHIS 1.33 ± 1.75 1.58 ± 1.56 30 24 -0.58 52 .59 MMSE 23.04 ± 4.18 20.90 ± 4.55 26 21 1.67 45 .10
Values expressed as mean ± SD;TPJ : temporoparietal ; MIHS : Modified Hachinski ischemic score ; MMSE : mini-mental state exam
p < .05 FWER corrected
Table 2. MNI coordinates of the different regions showing hypometabolism in FDG-PET.
Region x y z Cluster size
1.Typical (< Control) Left precuneus -15 -55 73 4141
2. Atypical (< Control) Left precuneus -15 -55 76 1601
3.Typical (<Atypical) Left precuneus
Right latero-inferior tem-poral cortex -3 57 -46 -52 46 -11 104 30
Table 3. T test results studying the homogeneity of the “TPJ subtype” group and the “Typical” group in the ADNI population TPJ subtype (ADNI) Typical (ADNI) N TPJ N Typical t value Degree of freedom p - value Age at PET 77.47 ± 7.73 72.84 ± 7.59 78 129 - 4.27 202 < .001 Level of educa-tion 15.26 ± 3.12 15.47 ± 2.64 0.52 .09
FIGURES LEGENDS
Figure 1. Representation, on a standard structural MR (magnetic resonance) image, of the cortical regions showing a significant metabolic decrease (measured with FDG-PET) in the Typical group (A) and the TPJ subtype group (B) compared to the Control Group, using the age as a nuisance vari-able. The regions, represented in the MNI space, are mostly posterior associative cortices.
The coordinates in the MNI space are : A : x = - 15 ; y = - 55 ; z = 73
B : x = -15 ; y = -55 ; z = 76
Color scale represents t-value ((A : Degree of freedom = 36 ; B : Degree of freedom = 42).
Figure 2.
A. Representation, on a standard structural MRI, of the cortical regions showing a significant meta-bolic decrease in the Typical group compared to the TPJ subtype Group, using the age as a nuisance variable. The regions, represented in the MNI space, are mostly the precuneus and the right latero-inferior temporal cortex. (Table 2)
B. Representation, on a standard structural MRI, of the cortical regions showing a significant meta-bolic decrease in the TPJ subtype Group compared to the Typical Group, using the age as a nuisance variable. The region, represented in the MNI space, is mostly the parieto-temporal junction. (Table 2)
Color scale represents t-value (Degree of freedom = 55)
Figure 3. Interregional metabolic correlations, between peak voxel values of the most discriminant regions taken as “seed regions” (obtained in the GIGA-CRC population) and metabolism in the other regions of the brain, in the ADNI population, with p-value < 0.05 (FWER corrected). Color scale represents t-value (Degree of freedom = 205)
A. In the “Typical” group, activity in the left precuneus (x = -3, y = -46 , z = 46 ) correlates with metabolism in parietal and premotor regions.
B. In the “TPJ subtype” group, activity in the left temporoparietal junction (x = -60, y = -4, z = 7)