Altered circulating endocannabinoids in anorexia nervosa during acute and weight-restored phases – a pilot study
Abstract
Anorexia nervosa (AN) is an eating disorder characterized by a low food-intake and often exceeding exercise, leading to a particularly low body x weight proportion. Patients with AN usually report less hunger than healthy controls. Endogenous endocannabinoids (eCB), specifically the anandamide, have been associated to hunger, as a meal initiator, but research regarding AN and eCB and inconclusive. In this pilot study, we investigated plasma levels of eCB in inpatients with anorexia nervosa during fasting and after eating, both during the acute AN phase and after weight-recovery. After an 8-hour fasting period, blood sample was collected from all participants. After that, participants were given a muffin test meal. Blood samples for the investigation of endogenous endocannabinoids anandamide (N-arachidonoylethanolamide, AEA) and 2-arachidonoylglycerol (2-AG) were then collected after 120-min and 240-min. Participants were only allowed to eat and drink what was offered them during the research. AN reported less hunger than controls during fasting and at the end of the experiment. Also, plasma levels of AEA were significantly smaller in AN in comparison to controls in all time points. No significant difference was found for 2-AG plasma levels. After recovery, no significant difference was found for eCB levels. These findings could be interpreted as an AEA deregulation in AN before and after food intake, which persists after weight recovery. These findings may have implications to the pharmacological treatment of AN and to relapse occurring in the disorder.
Highlights
Anandamide, an endogenous endocannabinoid associated to hunger, is present in less quantity in patients with anorexia nervosa during fasting;
The difference in circulating levels of anandamide between patients with anorexia nervosa and healthy controls persists after eating;
This difference is not normalized after weight-recovery following treatment.
1 Introduction
Anorexia nervosa (AN) is an eating disorder characterized by a low food-intake leading to emaciation, an extremely low body x weight proportion (American Psychiatric Association, 2013), with considerable mortality (Keshaviah, et al., 2014). Although the latest version of the Diagnostic Manual of Mental Disorders (DSM-5) does not include over-exercising as a criterium for the diagnostic of AN (American Psychiatric Association, 2013), it has been reported in up to 80% of participants in studies evaluating its prevalence, and contributes the low body-weight maintenance (Rizk, et al., 2015).
Eating is controlled by many systems in humans (Enax & Weber, 2016; Lutter & Nestler, 2009; Saper, Chou, & Elmquist, 2002), and several of these systems have been reported to be impaired in AN, like the reward system, homeostatic system (Keating, Tilbrook, Rossell, Enticott, & Fitzgerald, 2012; P. Monteleone, et al., 2006; P. Monteleone, et al., 2005), including the endocannabinoid (eCB) system (A. M. Monteleone, et al., 2015; P. Monteleone, et al., 2005; Watkins & Kim, 2014). In turn, the eCB system is involved in homeostatic control of several physiological functions, including food-intake and exergy expenditure, besides fat storage and body mass through mechanisms spread centrally and peripherally located (Marco, Romero-Zerbo, Viveros, & Bermudez-Silva, 2012). More specifically, two endocannabinoids are mostly involved in food-intake: the endogenous ligands anandamide (arachidonoylethanolamide, AEA) and 2-arachidonoylglycerol (2-AG), as well as the receptors CB1 and CB2 (Cota, et al.,
2003).
Greater concentrations of eCB in the blood and in the brain were evidenced in several disorders, ranging from reproductive, metabolic and gastrointestinal to neurological and psychiatric disorders (Di Marzo, Bifulco, & De Petrocellis, 2004), including eating disorders (P. Monteleone, et al., 2005) and obesity (Gatta-Cherifi, et al., 2012).
AEA and 2-AG were also found in greater concentration in brain regions in response to fasting in rats (Kirkham, Williams, Fezza, & Di Marzo, 2002). Furthermore, fasting also
increased AEA levels in peripheral regions (small intestine), and peripheral administration (intraperitoneal in rats) of AEA increased food intake (Gomez, et al., 2002). These studies point to a consistent role of eCB in food-intake control. Taking that into consideration, a previous study assessed eCB plasma levels in outpatients with AN during fasting (P. Monteleone, et al., 2005), and, unexpectedly found higher plasma AEA levels in AN in comparison to healthy controls. These contradictory results might be associated with a lack of control of diet type, as the study included outpatients. Besides that, intense exercising also promotes an increase in circulating levels of AEA (Heyman, et al., 2012), and exercise-induced eCB levels were not possible to be controlled during this study.
A better understanding of the eCB mechanisms related to anorexia nervosa may yield important knowledge for the pathophysiology of the disorder, and might help establish whether alterations in the eCB system are consistent with the state or trait of the disease (A. M. Monteleone, et al., 2015; P. Monteleone, et al., 2005). For such, longitudinal studies must be carried out in order to verify if changes observed during the acute phase remain after recovery. In that sense, we investigated plasma levels of endogenous endocannabinoids (AEA and 2-AG) in inpatients with anorexia nervosa during fasting and after eating, both during the acute AN phase and after weight-restoration phase. In line with the general literature on AEA and fasting, we expected to find higher levels of AEA during fasting in both groups, with a decreased amount in AN in comparison to HC both before and after eating. Furthermore, we expected to find no significant changes in 2-AG levels, in line with previous findings.
2 Methods
2.1 Ethics
The study was carried out according to Good Clinical Practice and the Declaration of Helsinki. The study protocol was approved by the Ethics Committee of the University of Zurich (KEK-ZH-No 2009-0115/1) and registered at ClinicalTrials.gov (trial number
NCT00946816). All participants were thoroughly informed on the procedures and provided written informed consent.
2.2 Participants
Participants in the AN (n = 15) group met the DMS-V criteria (American Psychiatric Association, 2013) for inclusion. They were recruited from an inpatient weight multimodal interdisciplinary therapeutic program of the Department of Consultation-Liaison-Psychiatry and Psychosomatic Medicine, at the University Hospital Zurich. The experiment consisted of two visits. Visit 1 occurred between the second and fourth week after admission, during the first phase (orientation) of the therapy. This is the time when patients get used to the clinic setting and also have somatic and psychiatric symptoms stabilized. During the first phase, patients are not supposed to eat to gain weight, but are oriented to eat regularly. Goals of the therapeutic program are to reach a normalization of weight and eating behaviors. Visit 2 occurred after AN patients attained BMI >17.5 kg/m2, when they are also close to a minimal
normal weight (ANR, n = 10, since some of the patients did not gain weight after treatment), following a three-month-long multimodal treatment, which aimed at reducing pathological eating behaviors, improving body weight, and treating somatic as well as psychiatric comorbidities. The therapeutic goal of the unit is to reach BMI > 18.5 kg/m2, but in the last
phase of the treatment, inpatients are often under pressure to organize their life outside the unit. To reduce dropout, we chose a BMI close to the goal, but in a therapeutic phase in which is still enough time for the research visit. Furthermore, a 17.5 kg/m2 BMI represents the threshold for
diagnosing AN (American Psychiatric Association, 2013).
Normal-weight age-matched healthy controls (HC, n = 9) were recruited via public announcements. Detailed information on participants can be found on Table 1. Exclusion criteria included a history of drug or alcohol abuse, a history of gastrointestinal disorders (since it has been reported they can increase AEA concentrations (Di Marzo, et al., 2004)), and the presence of mental disorders (other than AN for the AN group). Participants also underwent a
gastro-interstinal Magnetic Resonance Imaging, and further exclusion criteria in relation to that can be found in Bluemel, et al. (2017).
*******insert table 1******* 2.3 Procedure
All procedures were done in the acute and then the weight-restored phase with AN patients. Participants completed the Beck Depression Inventory (BDI), an inventory used for assessing depression levels (Beck, Ward, Mendelson, Mock, & Erbaugh, 1961). Self-report of hunger was assessed every 15 minutes during the first two hours, and every 30 minutes during the last two hours using a specific scale previously used (Marciani, et al., 2010; Marciani, et al., 2012).
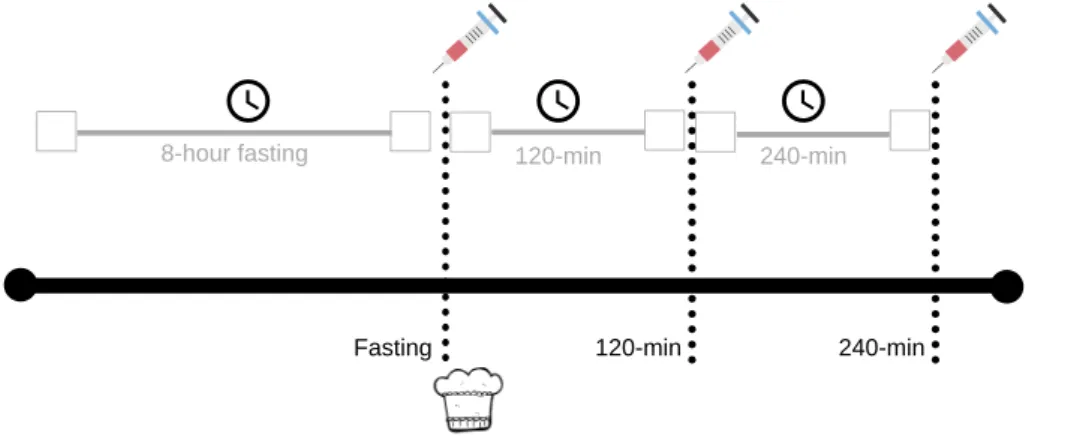
*******insert figure 1******* 2.3 Endocannabinoid measurements
After an 8-hour fasting period, blood sample was collected from all participants. After that, participants were given a muffin test meal (430 kcal, 21% fat, 63% carbohydrate, 16% protein). The choice of the meal was related to a companion study on gastric motor and sensory functions (Bluemel, et al., 2017), and participants were supposed to eat it while seated on the MRI scanner, prior to the scanning sessions (reported in Bluemel, et al., 2017). All participants fully ate the given muffin. Blood samples were then collected after 120-min and 240-min (Fig. 1). Participants were only allowed to eat and drink what was offered them during the research. Blood for the investigation of endogenous endocannabinoids anandamide (N-arachidonoylethanolamide, AEA) and 2-arachidonoylglycerol (2-AG) was drawn into pre-cooled 2 ml K-EDTA tubes (Greiner Bio-One VACUETTE®, St. Gallen, Switzerland). Immediately after the tube was filled, phenylmethanesulfonylfluoride (PMSF) solved in methanol was added to a final concentration of 0.5 mM to avoid degradation of endocannabinoids. Tubes were centrifuged at 4°C with 1750 G for 10 minutes. Supernatants were collected into 2 ml tubes (Rotilabo®, Carl Roth AG, Arlesheim, Switzerland) and stored
at -80°C until measurement. Plasma samples were thawed on ice and 500 µl of the samples were extracted with 2.5 volumes of toluene after adding internal standards (AEA-d8, 2-AG-d8 and 1AG-d5). Samples were mixed thoroughly and phases were separated by centrifugation for 5 min at 4 °C and 10.000 rpm. The organic layer was transferred to a new tube and the extraction was repeated. The combined organic phases were dried under a stream of nitrogen after addition of 10 µl of trapping solution (30% glycerol in methanol). The residues were reconstituted in 100 ul of 50% acetonitrile, pelleted for 10 min at 10.000 g, and transferred to glass vials for LC-MS/MS analysis. Because of the endogenous levels of endocannabinoids in biological matrices, calibration curves (concentrations ranging from 0.1 to 50 pmol/ml) were prepared in a substitute matrix (phosphate buffered saline containing 0.5 mg/ml bovine serum albumin, pH 7.4) to test for linearity and extraction efficiencies.
LC-MS/MS analyses. The sample separation was performed on a Phenomenex Gemini-NX-C18 reverse phase column (2.3 x 150 mm, 5 m pore size) with a corresponding opti-gard pre-column on an Agilent 1100 liquid chromatography system. The mobile phase consisted of (A) 4 mM ammonium acetate and (B) 95% methanol, 5% acetonitrile containing 4 mM ammonium acetate at a flow rate of 300 l/min using an injection volume of 60 l. An isocratic flow of 87% B was held for 11 min. The HPLC system was coupled to a 4000 QTRAP hybrid triple quadrupole linear ion trap mass spectrometer (Applied Biosystems) equipped with a TurboV source and electrospray (ESI) interface. Analytes were recorded using multiple reaction monitoring (MRM) in negative mode using the following source specific parameters: IS -4500V, TEM 450°C, curtain gas (CUR = 30), nebulizer gas (GS1 = 50), heater gas (GS2 = 70) and collision gas (CAD = 10). The compound specific parameters for the different substrates were determined by direct infusion of standard solutions (100-300 nmol/ml) in acetonitril at a flow rate of 10 µl/min using the quantitative optimization function of Analyst software 1.5.2. LOQ for AEA and 2-AG in plasma were estimated to 0.2 and 0.1 pmol/ml, respectively. Extraction efficiencies for AEA and 2-AG were on average 60%.
Acyl migration. In contrast to AEA, 2-AG undergoes acyl migration to its regioisomer 1-AG under acidic conditions. Certain organic solvents used for the extraction from biological matrices further facilitate this process. While 2-AG is almost completely converted to 1-AG in ethanol, a conversion to 1-AG in toluene is negligible (2011, Zoerner et.al). 2-AG and 1-AG (eluting approximately 0.5 min after 2-AG) were separated under chromatographic conditions, and samples contained on average 5% 1-AG.
2.4 Data analyses and statistics
Statistical analyses were performed using IBM SPSS Statistics 25 (IBM Corp., Armonk, NY, USA). Mixed model analyses were performed for 2AG and AEA including group (AN; HC) and time (fasting; 120 min after meal; 240 min after meal) as fixed factors. A first-order ante-dependence covariance structure was accommodated for the repeated observations. For the longitudinal analyses, full factorial models were fitted including the disorder phase (acute and weight restored) and time (fasting, 120-min after meal, 240-min after meal) as fixed factors. A first-order factor analytic covariance structure was accommodated for the repeated observations. In all models, subject was specified as a random factor. Bonferroni-corrected pairwise comparisons of the estimated marginal means were used as post-hoc tests. Finally, the psychological measures were correlated with the eCB measures during fasting.
3 Results
3.1 Self-report of hunger
We found significant effect of group x time interaction (F(1, 383.0) = 2.254, p < 0.05).
HC reported more hunger than AN during fasting and 240-min after eating. There was no significant difference for other time points (Fig.2).
*******insert figure 2******* 3.2 Endocannabinoid measurements 3.2.1 Acute phase of AN
Anandamide (AEA). There were main effects of group (F(1, 22.1) = 29.11, p < 0.001),
time (F(2, 22.3) = 47.81, p < 0.001) as well as an interaction of group x time (F(2, 22.3) = 5.46, p =
0.012). HC showed higher concentrations of AEA than AN (p < 0.001) (Fig. 4a). Across groups, concentrations of AEA were higher in the fasting condition than 120 min and 240 min (p < 0.001) after the meal. The group x time interaction revealed that, although HC showed higher concentrations of AEA at all time points (p < 0.001), the difference between groups was significantly stronger in the fasting condition (Δ = 5.180, p < 0.001) than 120 min (Δ = 1.801, p < 0.001) or 240 min after meal (Δ = 1.948, p < 0.001) (Fig. 3a).
2-arachidonoylglycerol (2-AG). No main or interactive effects of group and time were found for 2AG. Means and standard errors can be seen in Figure 3b, 3d.
Depression and eCB. Depression scores at BDI were negatively correlated to plasma levels of AEA (r = -.62, p < 0.001) and positively correlated to 2-AG (r = .639, p < 0.001) during fasting.
3.2.2 Comparison of eCB between the acute and weight-restored phases
Anandamide (AEA). We found a significant main effect of time (F(2, 8.9) = 43.67, p <
0.001), but no main effect of disorder phase was found (p = 0.75) Figure 3c. Across disorder phases, concentrations of AEA were higher in the fasting condition (p < 0.001) and 240 min (p < 0.05) after meal.
2-arachidonoylglycerol (2-AG). No significant main effects or interactions were found for 2-AG (Fig. 3d).
*******insert figure 3******* *******insert figure 4******* *******insert table 2*******
4 Discussion
We investigated plasma levels of endogenous endocannabinoids in patients with anorexia nervosa during fasting and after eating, in acute and weight-restored phases. To our
best knowledge, this is the first study carried out with inpatients with acute AN and weight-restored patients. Higher plasma levels of anandamide were found in healthy controls in comparison to patients with anorexia nervosa. Also, higher concentrations were found during fasting in comparison to after 120 and 240 minutes following a standard meal in both groups, with stronger effect during fasting. These results were specific for AEA, as we did find significant results for 2-AG. Finally, we found no significant difference in eCB levels between the acute and weight-restored phases.
Lower plasma levels of AEA in AN in comparison to HC are in line with our hypothesis and compatible to the hunger self-report. This is in line with previous studies that have reported AEA as a physiological meal initiator (Gatta-Cherifi, et al., 2012). In their study, Gatta-Cherifi, et al. (2012) showed increased plasma levels of AEA during fasting in healthy controls and people with obesity, with only healthy controls’ AEA decreasing after eating. They also did not find significant change in 2-AG levels. Given the fact that hunger levels are decreased in AN in comparison to controls (Bluemel, et al., 2017; Piccolo, et al., 2019) and also here, and AEA increases food-intake (Gomez, et al., 2002), it is possible to infer that low food intake in AN may be due to a deregulation in the eCB system, more specifically, the AEA. Furthermore, cannabis-based treatments have shown to increase food-intake of highly palatable food (Foltin, Fischman, & Byrne, 1988), and patients with AN show lower palatability rating in comparison to controls (Keating, et al., 2012).
When examining eCB changes across phases of the disorder, our results showed no significant changes in circulating eCB levels across conditions (acute vs weight-restored). No eCB difference between acute and restored patients with AN were also reported by (A. M. Monteleone, et al., 2015), suggesting deranged eCB levels (mainly AEA) might remain present even after recovery. It is important to note that the previous study focused on evaluating differences in circulating eCB levels in response to pleasant vs non-pleasant food. In that study, patients were given the chance to choose between favorite and non-favorite foods, and the type
of meal was used as an independent variable. In response to hedonic eating, no differences were found for AEA, but 2-AG levels were shown to be deranged in AN. Our study failed to show differences in 2-AG levels across groups, but this may be related to the difference in methodology (with Monteleone’s et al., 2015 using meal as a factor, and changes in 2-AG being associated to hedonic eating, which was not measured in our study). New studies with larger samples are necessary for resolving this issue.
Interestingly, AEA do not reach with the normalization of weight the values of the control group. This could indicate that an eCB deregulation may consist of a trait, and not simply a state of AN. One possible explanation could be related to exaggerate exercising in the disorder. Over-exercising could represent a compensatory behavior in an attempt to regulate AEA levels, since exercising increases circulating AEA levels, as previously mentioned (Heyman, et al., 2012). A recent clinical case report showed a significant reduction in the urge to engage in physical activity in a male patient with AN treated with an eCB agonist, without major side effects (Graap, Erim, & Paslakis, 2018), pointing to the direction that overexercising could be a compensatory response to a diminished availability of eCB. In that sense, Kron, Katz, Gorzynski, and Weiner (1978) show, for instance, that intense exercising remains present even after recovery in people with a history of AN. These findings could also be related to eating regulation processes and might explain the high relapse rates (Carter, et al., 2012). Since no change occurs in eCB circulating levels, these patients would continue with a decreased appetite in comparison to healthy controls, leading to a reduced food intake, which would contribute to the below-average body weight (Mayer, Schebendach, Bodell, Shingleton, & Walsh, 2012).
Depression levels were negatively correlated to AEA, and positively correlated to 2-AG in our study. In other words, low levels of AEA were associated to higher levels of depression. This is in line with previous results reporting a positive correlation between 2-AAG and depression scores in pain patients (La Porta, et al., 2015). In addition, a recent study on rats
showed that low doses of AEA were successful in reversing depression-like behaviors (de Morais, et al., 2016). The altered levels of AEA could therefore be a factor contributing to the high rates of comorbidity between AN and depressive disorders. It has been reported that up to 75% of the individuals with an eating disorder may experience depression (Association, 2006).
This study is not without limitations. First, our sample sizes were small, and Visit 2 counted with less participants. Larger studies should be carried out in order to further strengthen these findings. Second, we did not measure other forms of eCB concentrations (such as in brain regions involved in the motivation to eat). These data could provide better understanding between the relationship of AEA and appetite control. Also, future research should focus on establishing the relationship between AEA levels and intensity of exercise. Moreover, it would be interesting to see AEA levels in longitudinal studies evaluating larger periods after the recovery to establish how far these traits can go, and measure to what extent relapse and the eCB system are related.
In conclusion, our findings show an AEA deregulation in AN before and after food intake, which persists after weight restoration. These findings may have implications to the pharmacological treatment of AN and to relapse occurring in the disorder. Cannabinoid treatments have significantly improved appetite in several disorders (Beal, et al., 1995; Nelson, Walsh, Deeter, & Sheehan, 1994), including AN (Badowski & Yanful, 2018). A recent review on the use of Dronabinol, a synthetic form of Δ-9-tetrahydrocannabinol, an exocannabinoid, concluded that this treatment could be beneficial for patients with AN and other conditions involving low food-intake. Taken together, these findings should foment the development and larger clinical trials involving eCB agonists for the treatment of AN and other appetite-related disorders.
References
American Psychiatric Association. (2013). Diagnostic and Statistic Manual of Mental Disorders (5th ed.). Washington, DC.
Association, A. P. (2006). Treatment of patients with eating disorders,third edition. American Psychiatric Association. The American Journal of Psychiatry, 163(7 Suppl), 4-54. Badowski, M. E., & Yanful, P. K. (2018). Dronabinol oral solution in the management of
anorexia and weight loss in AIDS and cancer. Ther Clin Risk Manag, 14, 643-651. Beal, J. E., Olson, R., Laubenstein, L., Morales, J. O., Bellman, P., Yangco, B., et al. (1995).
Dronabinol as a treatment for anorexia associated with weight loss in patients with AIDS. J Pain Symptom Manage, 10(2), 89-97.
Beck, A. T., Ward, C. H., Mendelson, M., Mock, J., & Erbaugh, J. (1961). An inventory for measuring depression. Archives of General Psychiatry, 4, 561-571.
Bluemel, S., Menne, D., Milos, G., Goetze, O., Oliver, F., Schwizer, W., et al. (2017). Relationship of body weight with gastrointestinal motor and sensory function: studies in anorexia nervosa and obesity. BMC Gastroenterology, 17(4).
Carter, J. C., Mercer-Lynn, K. B., Norwood, S. J., Bewell-Weiss, C. V., Crosby, R. D., Woodside, D. B., et al. (2012). A prospective study of predictors of relapse in anorexia nervosa: implications for relapse prevention. Psychiatry Res, 200(2-3), 518-523.
Cota, D., Marsicano, G., Lutz, B., Vicennati, V., Stalla, G. K., Pasquali, R., et al. (2003). Endogenous cannabinoid system as a modulator of food intake. Int J Obes Relat Metab Disord, 27(3), 289-301.
de Morais, H., de Souza, C. P., da Silva, L. M., Ferreira, D. M., Baggio, C. H., Vanvossen, A. C., et al. (2016). Anandamide reverses depressive-like behavior, neurochemical abnormalities and oxidative-stress parameters in streptozotocin-diabetic rats: Role of CB1 receptors. Eur Neuropsychopharmacol, 26(10), 1590-1600.
Di Marzo, V., Bifulco, M., & De Petrocellis, L. (2004). The endocannabinoid system and its therapeutic exploitation. Nat Rev Drug Discov, 3(9), 771-784.
Enax, L., & Weber, B. (2016). Neurobiology of food choices - between energy homeostasis, reward system and neuroeconomics. e-Neuroforum, 7, 13-21.
Foltin, R. W., Fischman, M. W., & Byrne, M. F. (1988). Effects of smoked marijuana on food intake and body weight of humans living in a residential laboratory. Appetite, 11(1), 1-14.
Gatta-Cherifi, B., Matias, I., Vallee, M., Tabarin, A., Marsicano, G., Piazza, P. V., et al. (2012). Simultaneous postprandial deregulation of the orexigenic endocannabinoid anandamide and the anorexigenic peptide YY in obesity. Int J Obes (Lond), 36(6), 880-885.
Gomez, R., Navarro, M., Ferrer, B., Trigo, J. M., Bilbao, A., Del Arco, I., et al. (2002). A peripheral mechanism for CB1 cannabinoid receptor-dependent modulation of feeding. J Neurosci, 22(21), 9612-9617.
Graap, H., Erim, Y., & Paslakis, G. (2018). The effect of dronabinol in a male patient with anorexia nervosa suffering from severe acute urge to be physically active. Int J Eat Disord, 51(2), 180-183.
Heyman, E., Gamelin, F. X., Goekint, M., Piscitelli, F., Roelands, B., Leclair, E., et al. (2012). Intense exercise increases circulating endocannabinoid and BDNF levels in humans--possible implications for reward and depression. Psychoneuroendocrinology, 37(6), 844-851.
Keating, C., Tilbrook, A. J., Rossell, S. L., Enticott, P. G., & Fitzgerald, P. B. (2012). Reward processing in anorexia nervosa. Neuropsychologia, 50, 567-575.
Keshaviah, A., Edkins, K., Hastings, E. R., Krishna, M., Franko, D. L., Herzog, D. B., et al. (2014). Re-examining premature mortality in anorexia nervosa: a meta-analysis redux. Compr Psychiatry, 55(8), 1773-1784.
Kirkham, T. C., Williams, C. M., Fezza, F., & Di Marzo, V. (2002). Endocannabinoid levels in rat limbic forebrain and hypothalamus in relation to fasting, feeding and satiation: stimulation of eating by 2-arachidonoyl glycerol. Br J Pharmacol, 136(4), 550-557. Kron, L., Katz, J. L., Gorzynski, G., & Weiner, H. (1978). Hyperactivity in anorexia nervosa:
La Porta, C., Bura, S. A., Llorente-Onaindia, J., Pastor, A., Navarrete, F., Garcia-Gutierrez, M. S., et al. (2015). Role of the endocannabinoid system in the emotional manifestations of osteoarthritis pain. Pain, 156(10), 2001-2012.
Lutter, M., & Nestler, E. J. (2009). Homeostatic and hedonic signals interact in the regulation of food intake. J Nutr, 139(3), 629-632.
Marciani, L., Cox, E. F., Hoad, C. L., Pritchard, S., Totman, J. J., Foley, S., et al. (2010). Postprandial changes in small bowel water content in healthy subjects and patients with irritable bowel syndrome. Gastroenterology, 138(2), 469-477, 477 e461.
Marciani, L., Hall, N., Pritchard, S. E., Cox, E. F., Totman, J. J., Lad, M., et al. (2012). Preventing gastric sieving by blending a solid/water meal enhances satiation in healthy humans. J Nutr, 142(7), 1253-1258.
Marco, E. M., Romero-Zerbo, S. Y., Viveros, M. P., & Bermudez-Silva, F. J. (2012). The role of the endocannabinoid system in eating disorders: pharmacological implications. Behav Pharmacol, 23(5-6), 526-536.
Mayer, L. E., Schebendach, J., Bodell, L. P., Shingleton, R. M., & Walsh, B. T. (2012). Eating behavior in anorexia nervosa: before and after treatment. Int J Eat Disord, 45(2), 290-293.
Monteleone, A. M., Di Marzo, V., Aveta, T., Piscitelli, F., Dalle Grave, R., Scognamiglio, P., et al. (2015). Deranged endocannabinoid responses to hedonic eating in underweight and recently weight-restored patients with anorexia nervosa. Am J Clin Nutr, 101(2), 262-269.
Monteleone, P., Luisi, M., Martiadis, V., Serritella, C., Longobardi, N., Casarosa, E., et al. (2006). Impaired reduction of enhanced levels of dehydroepiandrosterone by oral dexamethasone in anorexia nervosa. Psychoneuroendocrinology, 31(4), 537-542. Monteleone, P., Matias, I., Martiadis, V., De Petrocellis, L., Maj, M., & Di Marzo, V. (2005).
in binge-eating disorder, but not in bulimia nervosa. Neuropsychopharmacology, 30(6), 1216-1221.
Nelson, K., Walsh, D., Deeter, P., & Sheehan, F. (1994). A phase II study of delta-9-tetrahydrocannabinol for appetite stimulation in cancer-associated anorexia. J Palliat Care, 10(1), 14-18.
Piccolo, M., Milos, G., Bluemel, S., Schumacher, S., Muller-Pfeiffer, C., Fried, M., et al. (2019). Food vs money? Effects of hunger on mood and behavioral reactivity to reward in anorexia nervosa. Appetite, 134, 26-33.
Rizk, M., Lalanne, C., Berthoz, S., Kern, L., Group, E., & Godart, N. (2015). Problematic Exercise in Anorexia Nervosa: Testing Potential Risk Factors against Different Definitions. PLoS One, 10(11), e0143352.
Saper, C. B., Chou, T. C., & Elmquist, J. K. (2002). The need to feed: homeostatic and hedonic control of eating. Neuron, 36(2), 199-211.
Watkins, B. A., & Kim, J. (2014). The endocannabinoid system: directing eating behavior and macronutrient metabolism. Front Psychol, 5, 1506.
Figures
Figure 1. Study procedure. After fasting for an 8-hour period, participants had their blood sample collected. Following a standard meal, the same procedure was repeated after 120-min and 240-min.
Figure 2. Self-report of hunger in healthy controls (HC) and patients with anorexia nervosa (AN). Significant difference was found during fasting and 240-min after a standardized meal. Figure 3. Circulating endoccanabinoids across time points (Fasting, 120-min and 240-min after eating a standard meal). A. Anandamide’s (AEA) levels were significant higher for HC in
comparison to AN in all time points, and the difference was higher during fasting in comparison to the other time points (p < 0.001). B. No significant difference was found for circulating levels of 2-Arachidonylglycerol (2-AG) between groups (p > 0.05). C. Circulating levels of AEA in AN during acute and weight-restored phase. There was no significant difference between both phases (p > 0.05). There was a significant difference between fasting and the other time points (P < 0.01) in both pahses. D. No significant difference was found for circulating levels of 2-Arachidonylglycerol (2-AG) between phases (p > 0.05).
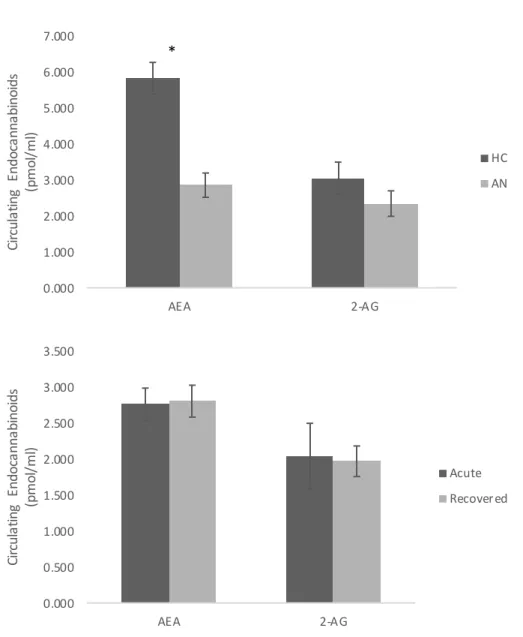
Figure 4. Total circulating levels of endocannabinoids across groups and anorexia nervosa phase. A. Higher anandamide’s (AEA) concentration was found in healthy controls (HC) in comparison to participants with anorexia nervosa (AN) in general (p < 0.001). No significant difference was found for 2-Arachidonylglycerol (2-AG) between groups (*p > 0.05). B. No significant difference was found for AEA or 2-AG across phases (acute and weight-restored) in patients with AN.
Tables
Table 1. Description of study population. Body mass index (BMI), the Beck Depression Inventory (BDI) scores, and the State-Trait Anxiety Inventory (STAI) scores for healthy controls (HC), patients with anorexia nervosa during the acute phase (AN), and weight-restored patients at the end of treatment (ANR).
Table 2. Means and standard errors for plasma levels of endocannabinoids (pmol/ml) in healthy controls (HC), patients with anorexia nervosa during the acute phase (AN), and weight-restored patients at the end of treatment (ANR).
HC
(n = 9) AN(n = 15) ANR(n = 10)
Age [years, mean] 20 ± 0.52 22 ± 1.00 22 ± 1.00
BMI [kg/m2, mean]a BDI a STAI (state) a STAI (trait) a 21.3 ± 0.28 4.4 ± 0.89 32.8 ±2.1 31.5 ± 2.3 14.4 ± 0.28 27.0 ± 2.32 50.5 ± 2.6 54.2 ± 3.3 17.9 ± 1.00 13.2 ± 8.5 -46.0 ± 15.8 Demographic data are given as mean; descriptive data are given as mean ± standard error.
a indicates a significant different distribution between groups (ANOVA, all p values < 0.05).
Endocannabinoids
(eCB) (n=9), meanHC ± SE (n=15), meanAN ± SE (n=10), meanANR ± SE
Anandemide 5.83 ± 0.44 2.85 ± 0.34 2.81 ± 0.22 (AEA) pmol/ml Fasting 9.87 ± 0.94 4.69 ± 0.73 4.64 0.51 120-min 3.97 ± 0.28 2.17 ± 0.22 2.29 ± 0.33 240-min 3.65 ± 0.33 1.70 ± 0.26 1.48 ± 0.30 2-Arachidonoylglycerol 3.05 ± 0.45 2.34 ± 0.35 1.97 ± 0.21 (2-AG) pmol/ml Fasting 2.91 ± 0.27 1.72 ± 0.21 1.45 ± 0.23 120-min 3.23 ± 0.64 2.75 ± 0.51 2.35 ± 0.31 240-min 3.01 ± 0.55 2.56 ± 0.44 2.11 ± 0.20
±
± 120-min
8-hour fasting 240-min
Fasting 120-min 240-min
Figure 1. Study procedure. After fasting for an 8-hour period, participants had their blood sample collected. Following a standard meal, the same procedure was repeated after 120-min and 240-min.
* * -1 0 1 2 3 4 5 Fasti ng 15 30 45 60 75 90 105 120 150 180 210 240 Hu ng er S el f-re po rt Time HC AN
Figure 2. Self-report of hunger in healthy controls (HC) and patients with anorexia nervosa (AN). Significant difference was found during fasting and 240-min after a standardized meal.
C D 0.000 2.000 4.000 6.000 8.000 10.000 12.000
Fasting 120-min 240-min
An an dam id e (p m ol /m l) HC AN 0.000 2.000 4.000 6.000 8.000 10.000 12.000
Fasting 120-min 240-min
2-Ar ac hi do ny lg ly ce ro l (p m ol /m l) HC AN 0.000 1.000 2.000 3.000 4.000 5.000 6.000
Fasting 120-min 240-min
An an dam id e (p m ol /m l) Acute Recovered 0.000 1.000 2.000 3.000 4.000 5.000 6.000
Fasting 120-min 240-min
2-Ar ac hi do ny lg ly ce ro l (p m ol /m l) Acute Recovered
Figure 3. Circulating endoccanabinoids across time points (Fasting, 120-min and 240-min after eating a standard meal). A. Anandamide’s (AEA) levels were significant higher for HC in comparison to AN in all time points, and the difference was higher during fasting in comparison to the other time points (p < 0.001). B. No significant difference was found for circulating levels of 2-Arachidonylglycerol (2-AG) between groups (p > 0.05). C. Circulating levels of AEA in AN during acute and weight-restored phase. There was no significant difference between both phases (p > 0.05). There was a significant difference between fasting and the other time points (P < 0.01) in both pahses. D. No significant difference was found for circulating levels of 2-Arachidonylglycerol (2-AG) between phases (p > 0.05).
* B 0.000 1.000 2.000 3.000 4.000 5.000 6.000 7.000 AEA 2-AG Ci rc ul at in g En do ca nn ab in oi ds (p m ol /m l) HC AN 0.000 0.500 1.000 1.500 2.000 2.500 3.000 3.500 AEA 2-AG Ci rc ul at in g En do ca nn ab in oi ds (p m ol /m l) Acute Recovered
Figure 4. Total circulating levels of endocannabinoids across groups and anorexia nervosa phase.
A. Higher anandamide’s (AEA) concentration was found in healthy controls (HC) in comparison
to participants with anorexia nervosa (AN) in general (p < 0.001). No significant difference was found for 2-Arachidonylglycerol (2-AG) between groups (*p > 0.05). B. No significant difference was found for AEA or 2-AG across phases (acute and weight-restored) in patients with AN.