HAL Id: hal-02156596
https://hal.archives-ouvertes.fr/hal-02156596
Submitted on 14 Jun 2019
HAL is a multi-disciplinary open access archive for the deposit and dissemination of sci-entific research documents, whether they are pub-lished or not. The documents may come from teaching and research institutions in France or abroad, or from public or private research centers.
L’archive ouverte pluridisciplinaire HAL, est destinée au dépôt et à la diffusion de documents scientifiques de niveau recherche, publiés ou non, émanant des établissements d’enseignement et de recherche français ou étrangers, des laboratoires publics ou privés.
CSR and Market Valuation: International Evidence
Sylvain Marsat, Benjamin Williams
To cite this version:
Sylvain Marsat, Benjamin Williams. CSR and Market Valuation: International Evidence. Bankers Markets & Investors : an academic & professional review, Groupe Banque, 2013, 123, pp.29 - 42. �10.2139/ssrn.1833581�. �hal-02156596�
CSR and Market Valuation:
International Evidence
Sylvain MARSAT
Clermont Université
Université d'Auvergne, EA 3849 CRCGM Faculty of Economics and Management
IAE Clermont-Fd 41, Bd F.-Mitterrand BP 54 F-63002 Clermont-Fd Cedex – France
Tel: +33 4 73 17 75 88 E-Mail: sylvain.marsat@u-clermont1.fr
Benjamin WILLIAMS
Clermont UniversitéUniversité d'Auvergne, EA 3849 CRCGM Faculty of Economics and Management
IAE Clermont-Fd 41, Bd F.-Mitterrand BP 54 F-63002 Clermont-Fd Cedex – France
Tel: +33 4 73 17 75 87
E-Mail: benjamin.williams@u-clermont1.fr
Version accepted for publication in:
Marsat, S., Williams, B., 2013. CSR and Market Valuation: International Evidence. Bankers, Markets & Investors 123, 29-42
Abstract
Do socially responsible firms benefit from ethical goodwill? On the one hand, taking externalities into account can be a competitive disadvantage. On the other hand, financial benefits may result from ethical behavior. Thanks to a worldwide dataset of ESG ratings (MSCI ESG ratings), we examine the relationship between a firm’s CSR rating and its shareholder value. After controlling for industry, region, year and R&D, we observe, contrary to mainstream empirical studies, strong evidence of a negative impact of responsible behavior on corporate market value. More precisely, environmental performance was penalized by investors over the 2005-2009 period, whereas involvement in human capital seems to have been valued by the market.
Keywords: Corporate Social Responsibility, ESG Rating, Firm valuation, Tobin’s q
JEL classification: G11, G12
After decades of initial insights on social responsibility, including Bowen’s (1953) seminal book, consciousness of extra-financial bottom lines, like social and environmental issues, really emerged at an international scale after the UNO-Brundtland Report of 1987. According to this report, it is important not to handicap future generations and the economy should balance profitability with its consequences for people and the planet. Taking externalities into account is the only way to achieve global and long-term equilibrium.
At a governmental level, measures like the New Economic Regulations in France oblige companies to disclose social and environmental issues. Some pension plans, for instance in the UK since the 1995 Pension act, have to disclose their environmental and ethics policies. Furthermore, since environmental scandals like the Exxon Valdes, some investors feel more concerned by the extra-financial implications of a firm’s business, such as its image among consumers concerned by fair trade. Companies are therefore encouraged to promote their corporate social responsibility.
In the mainstream theory of finance, however, the only goal of the firm is to maximize shareholder wealth (Friedman, 1962). The purpose of a firm is not to act in the moral sphere or in the place of the government, but merely to do business (Levitt, 1958). From a neoclassical point of view, the firm should therefore not take externalities into account since the money spent on “moral” stakes is lost for shareholders. This makes the firm less efficient, with higher costs stemming from this additional constraint. In the long term, the company will not be able to compete with its less scrupulous competitors. Doing ‘good’ is therefore considered counterproductive from a purely financial standpoint (Shleifer, 2004).
On the other hand, proponents of the stakeholder theory (Freeman, 1984; Donaldson and Preston, 1995) believe that ethical behavior and profit are not mutually exclusive. While money spent on ethical issues is not paid to shareholders over the short term, it might enable the firm to be more profitable in the future. For instance, ethical behavior can lead to reputational advantages, such as attraction of sensitive consumers (Guenster et al., 2010), and help avoid social problems as well as environmental disasters. Investing in the moral area can be seen as an opportunity to protect the firm against future risks (Godfrey et al., 2009).
From an empirical point of view, results concerning the link between profitability and ethical behavior are mixed. Whether it is rewarding to behave ethically (“doing well while doing good”, Hamilton et al., 1993) or there is “a price of ethics” (Renneboog et al., 2007, Dupré et al., 2006) both for investors and firms, is still a crucial debate. On the environmental side, Horváthová (2010) reports a majority of positive relationships between environmental performance and economic performance. However, there is no clear consensus and the results depend on the econometrics used, the type of legal system (common or civil law), the data timeframe and the kind of environmental variable. Whereas Margolis and Walsh (2001) question the evidence of the studies on the corporate social – financial link, Orlitzky et al. (2003) suggest in their meta-analysis that social responsibility pays off.
Only a few studies, however, really analyze the precise relationship between Corporate Social Responsibility (henceforth CSR) practices and shareholder value. Theoretically, if investors consider CSR as value sharing with employees, for instance, or an environmental commitment at the expense of shareholders, they might penalize it from a valuation standpoint. On the other hand, shareholders may also view social responsibility as an opportunity for value creation, avoiding lawsuits, increasing the firm’s reputation and consumer attractiveness, which all lead to interesting future benefits. Tobin’s q is often seen as a proxy of financial performance, but not as an assessment of firm valuation. We assume in this paper that market valuation is not a performance indicator of the same nature as Return
on Assets and Return on Equity on the company side or stock returns on the investor’s side. Rather, market valuation is the perception of shareholder value by investors at a specific date. On efficient markets, valuation indicators like Tobin’s q also include the measure of intangible assets by investors (Villalonga, 2004) that are incorporated into prices. Therefore, market valuation seems to be a particularly interesting proxy to measure investors’ expectations on the worthiness of the stock, i.e. the price, relative to book value, at which agents agree to exchange their shares on the market. Specifically, we wonder if CSR practices lead to an ethical goodwill by studying the impact of CSR behavior on stock valuation.
Our contribution to the existing literature on the link between CSR and market value is fourfold. First, we measure CSR practices through a rarely used but reliable, complete and worldwide database, MSCI ESG ratings (formerly Innovest and RiskMetrics). This dataset enables us to capture the entire CSR rating (IVA rating) and its subsets (Environmental, Social, Stakeholders and Corporate governance) on a wide sample of almost 9,000 observations. More specifically, our sample is composed of 2,838 firms from 50 countries over the 2005-2009 period. Second, as methodology is often called into question (Byrd et al., 2007), we follow rigorous checks of robustness by using different proxies for firm valuation and introducing numerous control variables such as R&D, industry and region. Third, the results are stimulating since they clearly indicate an undervaluation of firms that have high CSR ratings. This calls into question prior evidence (e.g. Galema, 2008; Guenster et al., 2010). Fourth, we find different levels of sensitivity among investors to different CSR dimensions. While the negative link between the firm’s value and CSR is driven by the environmental score, investors seem, on the other hand, to positively value involvement in human capital.
The remaining part of this paper is organized as follows. The first section deals with the prior literature on CSR and stock valuation. The second section focuses on methodology and data. The third section provides a discussion of the results.
I.
CSR
AND VALUE:
RELATED LITERATURECorporate Social Responsibility is a widely employed notion. According to Dahlsrud (2008), the most common definition is given by the European Commission, as “a concept whereby companies integrate social and environmental concerns in their business operations and in their interaction with their stakeholders on a voluntary basis” (Commission of the European Communities, 2001). We investigate the way investors actually value corporate social responsibility and therefore price it on the market. Prior theoretical and empirical research that discusses this issue is reviewed.
I.1. THEORETICAL BACKGROUND OF CSR VALUATION
The impact of CSR on firm valuation is subject to controversies. The traditional, but challenged, approach stems from neoclassical theory, which argues that being ethical and taking positive externality problems into account generates additional costs (Palmer et al., 1995; Walley and Whitehead, 1994). In a competitive environment, firms that support higher costs are supposed to be overwhelmed by less ethical but also less constrained ones. Baumol (1991) notes that responsible behavior implies sacrificing profits. Thus, CSR is not consistent with maximizing shareholder value and, on competitive markets, unethical behavior should be supported by investors (Shleifer, 2004). This theoretical stream therefore postulates a negative relationship between CSR practices and shareholder value.
On the other hand, investing in CSR might also provide financial benefits. Reducing waste, for instance, is a way to avoid environmental disasters, financial lawsuits, consumer boycotts and also to reduce costs. CSR business benefits are broad: an increase in brand value and reputation, higher motivation among employees, customer attraction and retention. According to Orlitzky et al. (2003), instrumental stakeholder theory supported by Freeman (1984) or Donaldson and Preston (1995) assumes a positive relationship between social responsibility and firm value. By satisfying stakeholders, the organization is more efficient and acquires a greater reputation. These positive attributes or moral capital generate “insurance-like” benefits (Godfrey et al., 2009), which preserve shareholder value in case of negative events and create goodwill.
Weber (2008) proposes what could be characterized as a financially “agnostic” approach. She argues that financial implications of doing good are mixed. Being socially responsible is profitable for a firm if the financial benefits from this behavior are higher than its costs. To precisely measure the profitability of CSR behavior, a firm has to assess the financial costs and benefits of such a policy for each subsequent year and discount it. She defines monetary CSR value added as:
Monetary Value Added= ∑ BnCSR CnCSR
1 + in
∞
n = 1 (Equation 1)
Where: n, number of periods; BnCSR, CSR benefits; CnCSR, CSR costs; and i, discount rate.
This approach expresses a clear relationship between CSR and firm value. The higher the difference between the benefits and costs implied by socially responsible policies, the higher the present value is. The link between CSR and firm value is therefore strongly theoretically grounded in a discounting marginal cash flows analysis. Moreover, one could wonder whether CSR involvement does not have an impact on the discount rate. Such a change would have an effect on overall corporate cash flows. Insofar as investors estimate that risk decreases when social behaviors are undertaken (Godfrey et al., 2009), the discount rate also decreases, and therefore firm value should rise.
From an extra-financial perspective, CSR might also be valued by some investors, even if behaving ethically is not financially rewarding. Some shareholders might seek socially responsible companies rather that high performance stocks. An ethical fad over CSR would cause socially responsible companies to be overvalued compared to their non-CSR counterparts. In this case, argued by Galema et al. (2008) or Burlacu et al. (2004), excess demand would translate into over pricing, i.e. an ethical goodwill or market premium.
I.2. EMPIRICAL LITERATURE
The bulk of empirical studies focus on the financial – CSR relationship, while the direct link between CSR performance and firm value is less widely studied. The main results seem to support the stakeholder theory and find that market valuation is positively related to corporate social responsibility (Galema et al., 2008). CSR practices are generally divided into three dimensions: environment, social and governance. The environmental dimension of CSR is focused on the impact of the business activity. This includes, for instance, energy and raw material consumption, recycling, and toxic emissions/waste. The social part deals with human rights, health and safety at the workplace, employee diversity, corporate philanthropy or community involvement. Governance is concerned with issues like shareholder rights and independence of the board. In this section, we review the literature that encompasses more
precisely the environmental or the corporate governance part and finally the entire spectrum of CSR1. Table 1 summarizes the related literature.
*** Insert Table 1 here ***
Some empirical research is dedicated to the specific impact of eco-efficiency. Dowell et al. (2000) study a sample of 89 US firms from the S&P 500 from 1994 to 1997. They divide the sample into three subgroups according to the level of environmental standards (local, US and stringent global standards). Their results show that firm valuation assessed by Tobin’s q is positively related to stringent environmental standards. Konar and Cohen (2001) show that poor environmental performance is negatively related to the intangible part of asset value, thanks to Tobin’s q. Therefore, a reduction of waste emissions implies an increase of market value.
King and Lenox (2002) refine the preceding work and distinguish waste prevention that leads to financial gain from reduced pollution that does not. More recently, Guenster et al. (2010), using the Innovest Strategic Value Investor Database over the 1997-2004 period, find a positive relationship between market value and eco-efficiency. They also underline that the market does not incorporate environmental information immediately. Heal (2005) already asserted that “one robust result seems to be that superior environmental performance is correlated with high values for Tobin’s q”.
On the corporate governance side, Goncharov et al. (2006) show, with 61 German firms over the 2002-2003 period, that firms with a high compliance with the German Corporate Governance Code exhibit a higher market value, assessed by market price. Beiner et al. (2006) also find that firm value measured by Tobin’s q is positively related to a high corporate governance level with a sample of 109 Swiss firms in 2002.
More broadly, Bird et al. (2007) examine the relationship between financial performance and CSR variables. Using KLD Research data on companies of the S&P 500 index between 1991 and 2003, they assess the impact of five different dimensions of CSR: community, diversity, employee relations, environment and product. Each activity is scored positively (strengths) and negatively (concerns). For instance, employee relations are scored positively for profit sharing, good retirement benefits or safety records, whereas poor relations with unions are scored negatively. Bird et al. (2007) show that valuation multiples are positively related to diversity, employee and product strengths, and negatively to employee concerns. Furthermore, the authors interpret the negative effect of community strengths on firm valuation as a market penalty for excessive spending on philanthropic activities.
Galema et al. (2008) use the logarithm of book-to-market value as the dependent variable on data from KLD universe (mainly US firms) over the 1992-2006 period. Following Bird et al. (2007), diversity and environment prove to be positively related to market valuation, whereas governance is negatively related. On the other hand, community and employee relations do not have a significant effect, and do not seem to have an impact on stock pricing, as well the overall score, than the strength and concern decomposition.
Through using numerous samples and econometric refinements, these recent empirical studies reveal several limitations. First, the results seem to be the most conclusive for the environmental and diversity side of corporate social responsibility, but still challenged concerning the remaining dimensions. Second, Bird et al. (2007) and Galema et al. (2008) use
KLD data that mainly covers the US stock market and these measures2 can be challenged
(Chatterji and Levine, 2006). Checking the results with another CSR database could therefore contribute other insights on the topic. Third, the methodology used is questionable. Some studies fail to take into account major controlling factors such as the industry. In order to overcome these flaws and expand prior contributions, we use a rich alternative dataset (MSCI ESG Data) on a worldwide basis and control the methodology by a large spectrum of control variables (i.e. industry, region, year, R&D expenses). Our results prove to be challenging for the existing literature since they suggest findings opposite to prior evidence.
II.
D
ATAThis section describes the data and methodology used to empirically investigate the link between corporate social responsibility and equity asset valuation. CSR data on firms is taken from MSCI ESG Data3. ESG are the three main proxy dimensions of corporate social
responsibility: environment, social and governance. Financial data come from the FactSet database.
II.1. MSCI ESG DATA
Assessing corporate social responsibility is a difficult task. While financial reports are highly standardized, extra-financial information is often seen as a way to improve the reputation of companies. CSR data is therefore both opportunistically revealed and not exhaustive in company reports. Extra-financial information is provided by companies such as KLD or MSCI ESG Data. While KLD is the most widely used academic dataset, MSCI ESG Data offers an interesting alternative, which has been used in prior studies by Derwall et al. (2005), Guenster et al. (2010) or Aktas and DeBodt (2011). As mentioned by Guenster et al. (2010) the comprehensiveness of this database is one of its strengths. The rating methodology relies on data collected from various documents (corporate documents, government data, journals, relevant organizations and professionals) as well as an interview of the company. Overall, more than 120 datapoints are aggregated to assess the level of CSR compared to industry peers (i.e. “best-in-class” rating).
The rating process relies on the following four pillars: strategic governance, human capital, environment and stakeholder capital (see Figure 1). Environment refers to the way firms try to minimize their impact on nature in doing business and is the most studied relationship. Guenster et al. (2010) and Sinkin et al. (2008) both use the term “eco-efficiency” to define this “nature-sustainable” development. The social theme of ESG is divided into two components. Human capital deals mainly with relationships inside the firm, between the firm and its employees, whereas stakeholder capital is concerned with stakeholders and communities. Strategic governance is particularly focused on the treatment of shareholders and agency problems like conflicts of interest. The global CSR rating, named Intangible Value Assessment rating (henceforth IVA) by MSCI ESG Data is obtained by the aggregation of these four pillars.
2 For Chatterji and Levine (2006) “KLD uses largely qualitative and subjective measures, which make it difficult
to produce comparable and reliable metrics”. MSCI ESG data is a measure which relies on extra-financial data mainly from corporate documents and interviews of the company, which are converted into datapoints. The ratings, however, are greatly influenced by MSCI ESG analysts who assess the key issues of each industry. Therefore, the MSCI ESG measures can also be seen as subjective. This is however another focus than the widely used KLD database, and a valuable complementary insight.
*** Insert Figure 1 here ***
Each pillar is rated based on intermediate factors, scored on a scale from 0 to 10. They are listed in figure 1. These factors aggregate the datapoints collected by MSCI. The methodology, however, cannot be reduced to pure quantitative scoring since MSCI ESG analysts play a significant role in the CSR assessment process by weighting the key issues for each industry. On the aggregate scores, the factors are not equally weighted. MSCI ESG analysts consider the main opportunities and risk for each industry and overweight these key factors. For instance, carbon dioxide emissions are more crucial for the basic materials industry than for the financial industry. Overall, the major CSR key issues for each industry are highly overweighted and contribute to approximately 80 percent of the final best-in-class rating.
This IVA rating is scored from AAA (best-in-class) to CCC (worst-in-class). The AAA to CCC aggregated IVA ratings have been converted into seven numerical scores, from 1 (lowest ranked) to 7 (highest ranked). We also use the four pillar scores (between 0 and 10), which enable us to precisely understand the impact of environment, human capital, strategic governance and stakeholder capital scores on firm valuation. Table 2 shows some statistics for IVA and its four subscores. According the MSCI methodology, the median IVA rating is equal to 4. Furthermore, the environmental pillar exhibits the lowest median and mean and it is the only score that does not reach the maximum of 10.
*** Insert Table 2 here ***
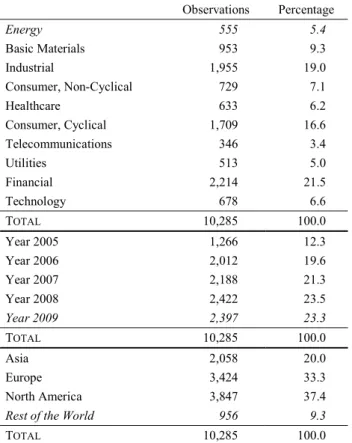
The coverage universe of MSCI ESG data is wide and includes companies from MSCI World (1,500 companies of developed markets, as defined by Morgan Stanley Capital International), MSCI Emerging Markets (200 companies), ASX 200 (200 companies from Australia) and FTSE 350 (275 British companies). Since the data before 2005 involves a small sample and ratings are mainly updated annually, we use annual data from 2005 to 2009. This represents 10,285 ratings concerning 2,838 different firms over a wide range of 50 countries (see table 3 for a complete description).
*** Insert Table 3 here *** II.2. FINANCIAL DATA
We matched ESG with financial data. Financial data consists in valuation proxies (dependent variables) and control (independent) variables from FactSet. Tobin’s q and price-to-book ratio (P/B, also referred to as market-price-to-book) are both used to proxy asset equity valuation. Tobin’s q is popular among academics while P/B is mostly used by asset management practitioners. Both metrics assess the value of stocks and are often even confused (Dam, 2008), the price-to-book ratio being used as a proxy of Tobin’s q.
Tobin (1969) defines q as the market value (MV) of assets divided by their book value (BV). We proxy the market value of assets as the book value of assets plus the market value of common stock less book value of common stock. Total assets are used as book value of assets. This simplified definition of Tobin’ q is close to the one also used in recent research articles4 (Kaplan and Zingales, 1997; Drobetz et al., 2004; Guenster et al., 2010). P/B ratio is
defined as stock price (market value of shareholder equity) divided by the book value of shareholder equity per stock. This ratio is often used by value portfolio managers to assess
4 We simplify Guenster et al. (2010) formula by excluding balance sheet deferred taxes. Other proxies for
stock valuation. This is an interesting alternative to measure stock value that strongly correlates (Godfrey et al., 2009).
We devoted particular care to the model’s specification by using a complete set of control variables. Since firm value is influenced by firm profitability, firm size, sales growth (Hirsh, 1991) and research and development expenses (McWilliams and Siegel, 2001, Dowell et al., 2000; King and Lenox, 2002; Konar and Cohen, 2001), we control for these variables. Firm profitability is measured by Return on Equity (RoE); firm size is defined as a logarithm of market capitalization5; sales growth as two-year revenue growth; R&D is computed as
research and development expenses divided by total assets6 (Guenster et al., 2010). Table 4
shows summary statistics for financial data.
*** Insert Table 4 here ***
III.
E
MPIRICAL ANALYSISIII.1. FIRM VALUE AND CSR PRACTICES
The correlation matrix (Table 5) shows that CSR variables are strongly and significantly correlated. The global ESG rating (IVA rating) is not significantly correlated with both valuation proxies (Tobin’s q and price-to-book). However, the human capital subscore exhibits a significant positive correlation with both valuation proxies, whereas the significant correlation is negative for the environmental pillar. Moreover, return on equity and firm size are positively related to IVA rating.
*** Insert Table 5 here ***
We use cross-section data since variation in ratings, and therefore firm-specific fixed effects, are limited (Guenster et al., 2010)7. We control for years, industry and world regions
thanks to dummy variables. The industries are coded according to Dow Jones industries level 1. Observations, broken down by industries, years and regions, are presented in table 6.
*** Insert Table 6 here ***
Based on ordinary least squares, we estimate the following model with different proxies for value (Tobin’s q and price-to-book) and metrics. Following Guenster et al. (2010), dependent variables are measured in level, in logs and trimmed to ensure a limited effect of outliers. The trimming procedure allows us to drop potential outliers in the extreme left and right 0.5 percent of the distribution.
Valuei= β0+ β1CSR Ratingi+ β2RoEi+ β3Sizei+ β4Sales growthi+
∑ γ9 jIndustryi,j
j=1 + ∑ δ4j=1 jYeari,j+ ∑ ρ3j=1 jRegioni,j+εi (Equation 2)
Where: Valuei, valuation proxy for observation i; CSR Ratingi, proxy for CSR level; RoEi,
Return on Equity; Sizei, logarithm of market capitalization; Sales growthi, two-year revenue
5 We use financial data converted in USD with a variable exchange rate over the period.
6 McWilliams and Siegel (2000) show that after inclusion of R&D expenses in the model’s specifications,
corporate social efficiency has no impact on accounting performance.
7 As mentioned by Guenster et al. (2010), a pooled model that enables fixed effects and time specific events is
growth; Industryi,j, dummy variable for industry set j ; Yeari,j, dummy variable for year j;
Regioni,j, dummy variable for region j; εi, residual.
Table 7 shows results for 2005-2009. These results are interesting since they rely on a wide unbalanced panel sample of almost 9,000 observations and exhibit an adjusted R-squared between 0.209 and 0.359. The variable used to proxy CSR (IVA rating) is highly significant (p<0.01) for each of the six dependent variables: Tobin’s q and price-to-book in level, logs and trimmed. The sign of the coefficients appears to be negative. The higher the degree of CSR, the lower the stock value of the firm. For two comparable firms, the most virtuous one is also the cheapest on financial markets. More precisely, a one-step increase in the IVA rating decreases ceteris paribus Tobin’s q by 0.03 and price-to-book by more than 0.18. From the investor standpoint, this negative coefficient shows that CSR value added as defined by Weber (2008) is negative. Furthermore, the impact of CSR measured by IVA rating appears to be non-linear. Taking into account the logs of Tobin’s q and price-to-book significantly increases the R-squared. The latter rises from 0.212 to 0.328 for Tobin’s q and from 0.282 to 0.358 for price-to-book.
*** Insert Table 7 here ***
These results are obtained while controlling for a wide set of financial and non-financial variables. According to previous evidence, we find a highly positive and significant relationship between value and firm profitability proxied by RoE. Size is also positively related to firm value8. Concerning industry dummies, we find a positive industry premium for
the following industries: Consumer (Non-Cyclical), Healthcare, Consumer (Cyclical) and Technology. On the other hand, the financial industry suffers from significant misevaluation. Dummies for years point to the drastic negative effect of the subprime-mortgage crisis on firm value in 2008. Asia appears to be the cheapest region in the world. These effects (industry, year and region), controlled together, are rarely introduced in previous studies and allow us to capture risk-premium differences.
*** Insert Table 8 here ***
The whole CSR spectrum is sometimes seen as an overall vague, “all embracing” (van Marrewijk, 2003) notion and might hide significant differences between the subsets. Therefore, we substitute IVA rating in equation 2 by its four subscores: environment, human capital, strategic governance and stakeholder capital. This allows us to capture more specific sides of CSR that might have different weights from the investor's standpoint. Table 8 indicates that the results on the overall CSR rating are mainly driven by the environmental subscore. This pillar is significantly and negatively related to valuation proxies. The relations with strategic governance and stakeholder capital appear to be inconclusive, while human capital exhibits a positive correlation. Investors seem to value CSR subsets differently, in favor of the firms’ human capital investments and not only diversity (Bird et al., 2007; Galema et al., 2008), whereas they sanction environmental involvement. The results seem to be very clear and robust concerning the influence of the environmental involvement of firms (p<0.01 for all independent variables), whereas the impact of human capital is not so obvious. The relationship between valuation and human capital proves to be highly significant with Tobin’s q and its derivatives (p<0.01), but the influence on the price-to-book seems to be less robust, depending on the independent variable used.
8 We observe no growth effect, as measured by two-year sales growth. Since the coefficients are close to zero
and non-significant, the variable was removed from the regressions. The results are not significantly affected by this variable.
III.2. ROBUSTNESS CHECKS
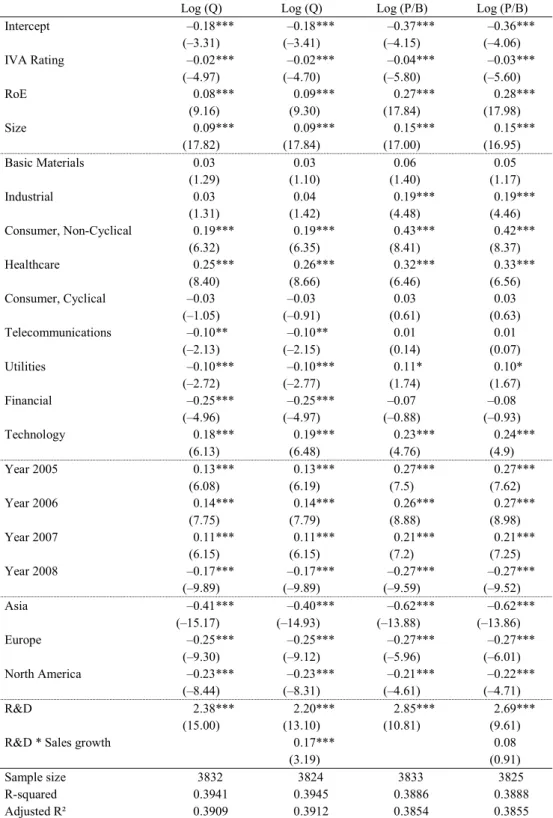
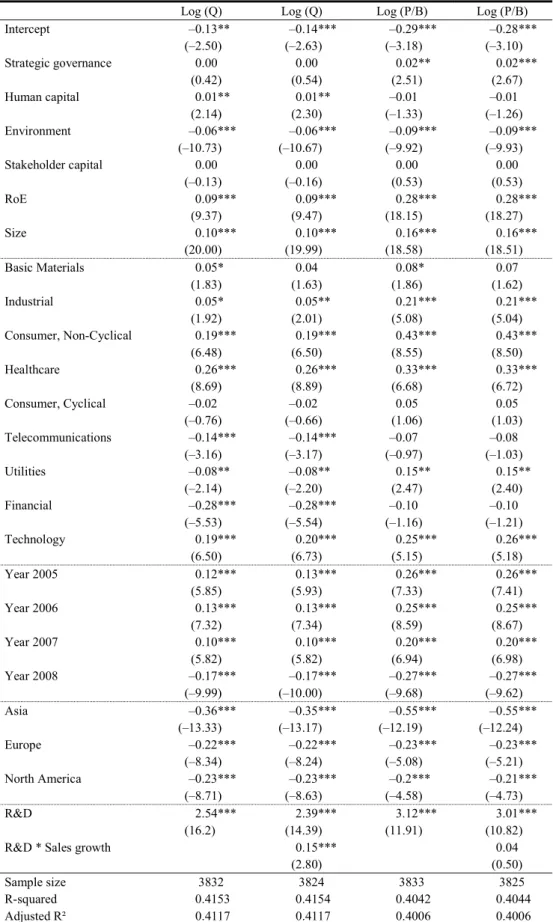
Robustness checks consist in extending the model’s specifications by adding additional variables. Following McWilliams and Siegel (2001), we verify that R&D expenses do not alter the results, since R&D and CSR level are correlated. The authors show that adding such a variable to the model’s specifications leads to the non-significance of CSR proxies. In order to simplify the presentation, the dependent variables are only taken in logs, as in Galema et al. (2008). Tables 9 and 10 exhibit the estimates for level-dependent variables, with R&D and R&D by sales growth as in Guenster et al. (2010). R&D relates positively and significantly to firm value.
Valuei= β0+ β1CSR Ratingi+ β2RoEi+ β3Sizei+ β4Sales growthi+ ∑ γ9j=1 jIndustryi,j+ ∑ δj=14 jYeari,j+ ∑ ρ3j=1 jRegioni,j+
θ1R&Di+ θ2 R&D× Sales growthi + εi (Equation 3)
Where: Valuei, valuation proxy for observation i; CSR Ratingi, proxy for CSR level; RoEi,
Return on Equity; Sizei, logarithm of market capitalization; Sales growthi, two-year revenue
growth; Industryi,j, dummy variable for industry set j; Yeari,j, dummy variable for year j;
Regioni,j, dummy variable for region j; R&Di, research and development expenses divided by
total assets; R&D × Sales growthi, research and development expenses (divided by total
assets) multiplied by two-year revenue growth; εi, residual.
*** Insert Table 9 here *** *** Insert Table 10 here ***
Globally, the signs of coefficients on IVA rating are not affected by this new specification and significance persists after controlling for both variables. Similarly, the negative relationship between market valuation and the environmental subset is still highly significant9 (p<0.01). The link between value and human capital, however, is weaker for
Tobin’s q variable and no longer significant for price-to-book. This finding confirms the previous results that the link between market valuation and human capital is sensitive to the model’s specification. As discussed by McWilliams and Siegel (2001), R&D seems to capture part of CSR practices, and especially its human capital side. Finally, complementary tests adding sales growth, capital structure (Debt to shareholders’ equity ratio), or risk (Beta) as independent variables, do not alter the results.
III.3. DISCUSSION
Contrary to the mainstream of empirical related research, we find that high CSR involvement, and particularly eco-efficiency, is not rewarded by shareholders. This calls into question the ethical goodwill reported by Galema et al. (2008) or Bird et al. (2007). Two main reasons could explain this divergence. First, we use a CSR dataset other than KLD. As mentioned by Chatterji and Levine (2006), subjective measures create noise in CSR assessment. If MSCI ESG data also has a subjective part in the assessment of key issues for each sector, the process relies on a large set of datapoints and might offer another focus on CSR. This does not, however, explain the opposite findings of Guenster et al. (2010) with the
9As a subset of CSR proxy we also use the EcoValue 21 rating, created by Innovest Strategic Value Advisors.
This proxy measures eco-efficiency (Guenster et al. 2010) insofar as a firm’s environmental responsibility is assessed. Derwall et al. (2005) and Guenster et al. (2010) also use this rating. It does not alter our results.
same data provider for the environment pillar. Their study, nevertheless, was performed over the 1997-2004 period whereas ours begins in 2005 and, therefore, includes a larger set of companies. Our results seem to support the idea that perceptions of environmental involvement have changed over time.
This CSR discount could be explained different ways. According to a first hypothesis, investors rationally assess the marginal costs and benefits of CSR and find negative monetary value added. From their standpoint, being a socially responsible firm means spending money, especially on greenwashing, to the detriment of the stockholder’s best interests. According to this view, theoretically supported by Friedman (1962), Levitt (1958) or Shleifer (2004), there is a conflict of interest between maximizing shareholder wealth and positive externalities. This leads to a sanction by shareholders, who underprice environmentally involved firms. According to a second hypothesis, myopic investors are not aware of the long-term potential benefits that may arise from a high level of environmentally friendly practices. They merely overweight the actual costs and have trouble forecasting future positive related cash flows or do not adjust the discount rate properly, compared to the insurance-like CSR benefits (Godfrey et al., 2009).
The results of this study have managerial implications for both corporate and portfolio managers. Corporate managers must be aware that CSR involvement is not rewarded by shareholders in firm valuation, and even punished. Shareholders, as firm owners, do not seem to understand the benefits of dispersing value among the stakeholders involved. Only investments inside the firm in human capital appear to be positively perceived. On the environmental side, which is the most popular subset, the corporate manager has to make a trade-off between positive externalities and shareholders. If the latter feel excluded from value allocation, the penalty for this misalignment of interests is the firm’s underpricing on the market. These results also have managerial implications for value style investors. From a “buy cheap, sell dear” point of view, the firm’s CSR policy has an impact on market discount. Since an active value investor buys under-valuated stock, he has to take the eventual badwill resulting from a high level of environmental efforts into account.
IV.
C
ONCLUSIONIn this paper, we investigate the precise relationship between CSR and the market valuation of firms. Firms with a high level of CSR may suffer from higher cost due to additional constraints. However, such behavior may also be financially rewarding for the firm, through the “insurance-like benefit” (Godfrey et al., 2009) of a greater reputation. We adopt an agnostic approach to this research question by conducting an empirical analysis based on a rich and informative dataset. We use MSCI ESG reference ratings and subscores in order to proxy the CSR behavior of firms and FactSet for financial data. In order to ensure the robustness of the results, the models use a large set of control variables: financial performance, size, growth and dummy variables for industries, years and regions.
Our study, which includes nearly 9,000 worldwide observations from 2005 to 2009, exhibits challenging results. While the bulk of academic empirical work reports a positive relationship between CSR performance and firm value, we clearly find a negative effect, supporting the trade-off hypothesis between shareholder and the other stakeholders. More precisely, the environmental subscore has a strong negative impact on firm value. These findings are not widely affected by a change in the dependent variable for firm value and the addition of supplementary control variables (R&D and R&D by sales growth). While human
capital is positively related to stock valuation, results seem to be contingent on model specifications. This issue is left for future research.
Shareholders therefore seem to consider that CSR costs, and more precisely environmental costs, exceed benefits from the firm’s standpoint. Positive externalities from the enhancement of satisfaction of various stakeholders are not enough to compensate in the equity asset valuation process and leads to underpricing. The market discount stemming from CSR behavior challenges the results of prior studies (Galema, 2008; Bird et al., 2007; Guenster et al., 2010) and further evidence is required based on diverse CSR databases, to confirm the reliability of the measures, and obtained with particular attention to model specifications.
Acknowledgements
This research results from a partnership between the Université d’Auvergne and the French asset management company Metropole Gestion. We are grateful to Corinne Baudoin, Isabel Levy and François-Marie Wojcik for their support. We would like to thank the two anonymous reviewers for their valuable comments, Pierre Cholet, Philippe Gillet, Xavier Hollandts, Cédric Lesage, Yves Mard, Bernard Raffournier, Christophe Revelli and the participants in the CRCGM workshop, AFFI 2011 and CIGE 2011 international conferences. We wish to thank MSCI ESG Data for providing ESG Data. The ideas, methodology and findings expressed in this paper are the sole responsibility of the authors.
References
AKTAS, N., DE BODT, E., COUSIN, J.-G.., 2011, “Do financial markets care about SRI?
Evidence from mergers and acquisitions” Journal of Banking & Finance, 35(7), 1753-1761. BAUMOL,W., 1991, Perfect Markets and Easy Virtue: Business Ethics and the Invisible Hand,
Basil Blackwell, Oxford.
BEINER, S., DROBETZ, W., SCHMID, M. M., ZIMMERMANN, H., 2006, “An Integrated
Framework of Corporate Governance and Firm Valuation”, European Financial Management, 12(2), 249-283.
BIRD, R. HALL, A.D., MOMENTE, F., REGGIANI, F., 2007, “What Corporate Social
Responsibility Activities are Valued by the Market?”, Journal of Business Ethics, 76, 189-206.
BOWEN,H.R., 1953, The Social Responsibility of the Businessman, New York, Harper and
Row.
BURLACU,R.,GIRERD-POTIN,I.,DUPRE,D., 2004, “Y a-t-il un sacrifice à être éthique ? Une
étude de performance des fonds socialement responsables américains”, Banque et Marchés, 69, 20-27.
CHATTERJI,A.K.,LEVINE,D.I., 2006, “Breaking Down the Wall of Codes: Evaluating
Non-Financial Performance Measurement”, California Management Review, 48(2), 29-51.
CHUNG, K.H., PRUITT, S.W. 1994, “A Simple Approximation of Tobin's q”, Financial
DAHLSRUD, A., 2008, “How corporate social responsibility is defined: an analysis of 37
definitions”, Corporate Social Responsibility and Environmental Management, 15, 1-13. DAM, L., 2008, Corporate Social Responsibility and Financial Markets, PhD thesis,
University of Groningen.
DERWALL, J., GUENSTER, N., BAUER, R., KOEDIJK, K., 2005, “The eco-efficiency premium
puzzle”, Financial Analysts Journal, 61, 51-63.
DONALDSON,T.,PRESTON,L.E., 1995, “The stakeholder theory of the corporation: Concepts,
evidence, and implications”, Academy of Management Review, 20, 65–91.
DOWELL, G. A., HART, S. AND YEUNG, B., 2000, “Do corporate global environmental
standards create or destroy market value?”, Management Science, 46(8), 1059-74.
DROBETZ,W., SCHILLHOFER, A. AND ZIMMERMANN, H., 2004, “Corporate governance and
expected stock returns: evidence from Germany”, European Financial Management, 10, 267-93.
DUPRE, D., GIRERD-POTIN, I., JIMENEZ-GARCES, S., LOUVET, P., 2006, “Les investisseurs
paient pour l’éthique. Conviction ou prudence ?”, Banque et Marchés, 84, 45-59.
FREEMAN,R.E., 1984, Strategic management: A stakeholder approach, Marshfield, Pitman.
FRIEDMAN, M., 1962, Capitalism and Freedom, University of Chicago Press, Chicago.
GALEMA,R.,PLANTINGA,A.,SCHOLTENS,B., 2008, “The stocks at stake: Return and risk in
socially responsible investment”, Journal of Banking and Finance, 32(12), 2646-2654
GODFREY, P.C., MERRILL, C.B., AND HANSEN, J.M., 2009, “The relationship between
corporate social responsibility and shareholder value: An empirical test of the risk management hypothesis”, Strategic Management Journal, 30, 425-445.
GONCHAROV, I., WERNER, J. R., & ZIMMERMANN, J., 2006, “Does Compliance with the
German Corporate Governance Code Have an Impact on Stock Valuation? An empirical analysis”, Corporate Governance: An International Review, 14(5), 432-445.
GUENSTER, N., BAUER, R., DERWALL, J., KOEDIJK, K., 2010, “The Economic Value of
Corporate Eco-Efficiency", European Financial Management, 26pp.
HAMILTON,S.,JO,H., STATMAN,M., 1993, “Doing well while doing good? The investment
performance of socially responsible mutual funds”, Financial Analysis Journal, November-December, 62-65.
HEAL,G.M., 2005, “Corporate social responsibility? An economic and financial framework”,
Geneva Papers on Risk and Insurance: Issues and Practice, 30, 387–409.
HORVÁTHOVÁ,E., 2010, “Does environmental performance affect financial performance? A
meta-analysis”, Ecological Economics, 70, 52-59.
KING, A. AND LENOX, M., 2002, “Exploring the locus of profitable pollution reduction”,
Management Science, 48(2), 289-99.
KONAR,S. AND COHEN,M. A., 2001, “Does the market value environmental performance?”,
Review of Economics and Statistics, 83(2), 281–89.
LEVITT, T., 1958, “The Dangers of Social Responsibility”, Harvard Business Review, 36(5),
41-50.
VAN MARREWIJK, M., 2003, “Concepts and Definitions of CSR and Corporate Sustainability:
MARGOLIS,J. D.,WALSH, J.P., 2001, People and profits? The search for a link between a
company’s social and financial performance, Mahwah, Erlbaum.
MCWILLIAMS, A., SIEGEL, D., 2000, “Corporate social responsibility and financial
performance: correlation or misspecification?”, Strategic Management Journal, 21, 603-609. MCWILLIAMS, A., SIEGEL, D., 2001, “Corporate social responsibility: a theory of the firm
perspective”, Academy of Management Review, 26 (1), 117-127.
ORLITZKY, M., SCHMIDT, F. L., RYNES, S. L, 2003, “Corporate social and financial
performance: A meta-analysis”, Organization Studies, 24(3), 403-441.
PALMER, K., OATES, W.E., PORTEY, P.R., 1995, “Tightening environmental standards: the
benefit-cost or the no-cost paradigm?”, Journal of Economic Perspectives, 9 (4), 119-132. RENNEBOOG,L.D.R.,HORST,J.R. TER,ZHANG,C., 2007. “The Price of Ethics: Evidence from
Socially Responsible Mutual Funds”, Discussion Paper 2007-012, Tilburg University, Tilburg Law and Economic Center.
SHLEIFER, A., 2004, “Does competition destroy ethical behavior?”, American Economic
Association Papers and Proceedings, 94 (2), 414-418.
SINKIN,C.,WRIGHT C.J.,BURNETT R. D., 2008, “Eco-efficiency and firm value”, Journal of
Accounting and Public Policy, 27 (2),167-176
TOBIN, J., 1969, “A general equilibrium approach to monetary theory”, Journal of Money
Credit and Banking, 1 (1), 15-29.
WALLEY, N., Whitehead, B., 1994, “It's not easy being green”, Harvard Business Review,
46-52.
WEBER, M., 2008, “The business case for corporate social responsibility: A company-level
Tables and figures
Figure 1: The four pillars of IVA
Strategic Governance Stakeholder Capital
Strategy Partnerships with stakeholders Agility/adaptation Relationships with host communities Traditional governance concerns Management of supply chains Intellectual capital Emerging market strategies
Product safety Operations at risk of human rights abuses
Human Capital Environment
Workplace practices, including recruitment &
retention Risk management systems, including board & management oversight Labor relations Disclosure/verification
Health & safety Efficient use of resources Effective waste management & reduction
Climate risk assessment New product development
Table 1: Empirical review synthesis
Article Sample Proxy for
valuation Proxy for CSR Main control variables Main results Dowell et al.
(2000) 89 US firms from the S&P 500 from 1994 to 1997
Tobin’s q Dummies for level of environmental standards (Investor Responsibility Research Center’s, IRRC)
R&D intensity, advertising intensity, leverage, multinationality, firm size
More stringent environmental standards are positively related with firm value
Konar and
Cohen (2001) 321 firms of the S&P 500, 1989 Tobin’s q Toxic chemicals emitted per dollar revenue of the firm, number of environmental lawsuits pending against the firm (Investor Responsibility Research Center, 1993)
R&D expenditures, market share, industry concentration, firm growth rates and advertising expenditures
Intangible asset value is negatively linked with poor environmental performance
King and Lenox (2002)
614 US firms, 1991-1996
Tobin’s q Total toxicity weighted emissions, measure of waste treatment (Toxic Release Inventory, TRI)
Size, growth, capital intensity, leverage, R&D intensity, rational wages, regulatory stringency, permits
Firm value is negatively related to the level of toxic emission
Beiner et al.
(2006) 109 Swiss firms, 2002 Tobin’s q Corporate governance index based on a survey Beta, age, industry, CEO characteristics, size, ROA, age, SMI inclusion, growth, ownership variable, standard deviation of stock returns, intangible assets
Firm value is positively related to high corporate governance level
Bird et al. (2007) KLD Research data on companies of the S&P 500, from 1991 to 2003 Market-to-book value, Price-to-earnings
KLD CSR ratings Size, momentum, leverage, industry
Valuation multiples are positively related to diversity, employee and product strengths, and negatively to employee concerns
Galema et al.
(2008) KLD universe (mainly US firms), 1992-2006 period
Log
(Book-to-market) KLD CSR ratings R&D intensity, R&D missing, dummy for stocks belonging to the Russell 3000, firm age, ROE, dummy for time
Diversity and environment prove to be positively related to market valuation, whereas governance is negatively related.
Guenster et al.
(2010) Innovest Strategic Value Investor Database, US stock market 1997-2004 period
Tobin’s q Eco-efficiency rating, Innovest Strategic
Value Investor Database Sales growth, firm age, size, ROA, R&D, R&D*sales growth, Nasdaq dummy
A positive relationship between market value and eco-efficiency
Table 2: Summary statistics for MSCI ESG Data ratings
Mean Median Max. Min. Std. Dev. Skewness Kurtosis IVA Rating 3.781 4.000 7.000 1.000 1.718 0.181 2.199 Strategic governance 5.404 5.400 10.000 0.000 1.860 –0.055 2.600 Human capital 5.495 5.500 10.000 0.000 1.670 –0.125 2.914 Environment 4.890 4.999 9.810 0.000 1.685 –0.105 2.613 Stakeholder capital 5.234 5.200 10.000 0.000 1.842 –0.039 2.695
Period: 2005-2009. Observations: 10,285 (2,838 firms). For the IVA rating, we convert letter scores into numerical scores with a linear scaling method: AAA = 7 (best score), AA = 6, A = 5, BBB = 4 (industry median score), BB = 3, B = 2, CCC = 1 (worst score).
There are not significant differences in the overall IVA rating between years. The p-value for the corresponding Anova test is 0.7172.
Table 3: Number of firms by country
Country Number of firms United States of America 834
Japan 365 Great-Britain 348 Australia 249 Canada 145 France 88 Germany 64 Hong Kong 59 Italy 56 Spain 49 Switzerland 48 Sweden 46 China 36 Brazil 33 Netherlands 32 South Korea 28 Finland 27 India 26 Norway 24 Singapore 24 Denmark 20
Austria, Belgium, Greece, Ireland, Malaysia, Mexico, New Zealand, Portugal, Russia, South Africa, Taiwan
Less than 20
Bermuda, Chile, Czech Republic, Egypt, Hungary, Indonesia, Israel, Luxembourg, Morocco, Pakistan, Peru, Philippines, Poland, Romania, Thailand, Turkey, Venezuela
Table 4: Summary statistics for financial data
Variable Mean Median Std. Dev. Obs.
Q 1.680 1.322 1.126 9,514
P/B 3.154 1.988 7.973 8,990
RoE 0.159 0.133 0.576 8,991
Size 8.679 8.676 1.377 9,639 R&D 0.035 0.018 0.047 4,033
Period: 2005-2009. Where: Q, Tobin’s q; P/B, price-to-book; RoE, Return on Equity; Size, logarithm of market capitalization (billion USD); R&D, Research and development expenses scaled by total assets.
Table 5: Correlation matrix Sample size: 8,923 Period: 2005-2009 Q P/B IVA Strategic governance Human capital Environment Stakeholder
capital RoE Size
Q 1 P/B 0.3341*** 1 IVA 0.0008 –0.0157 1 Strategic governance 0.0099 0.0087 0.7643*** 1 Human capital 0.0494*** 0.0191* 0.6757*** 0.6335*** 1 Environment –0.0357*** –0.0265** 0.6791*** 0.6553*** 0.5211*** 1 Stakeholder capital 0.0127 –0.0034 0.7067*** 0.6872*** 0.6160*** 0.5776*** 1 RoE 0.1881*** 0.5168*** 0.0257** 0.0430*** 0.0474*** 0.0107 0.0393*** 1 Size 0.1650*** 0.0491*** 0.2173*** 0.1605*** 0.1481*** 0.2163*** 0.2149*** 0.0787*** 1
Period: 2005-2009. Where: Q, Tobin’s q; P/B, price-to-book; IVA Rating: numerical variable from 1 (CCC) to 7 (AAA); Strategic governance, Human capital, Environment and Stakeholder capital, the four pillars’ subscores; RoE, Return on Equity; Size, logarithm of market capitalization (billion USD).
Table 6: Observations by industry, year and region Observations Percentage Energy 555 5.4 Basic Materials 953 9.3 Industrial 1,955 19.0 Consumer, Non-Cyclical 729 7.1 Healthcare 633 6.2 Consumer, Cyclical 1,709 16.6 Telecommunications 346 3.4 Utilities 513 5.0 Financial 2,214 21.5 Technology 678 6.6 TOTAL 10,285 100.0 Year 2005 1,266 12.3 Year 2006 2,012 19.6 Year 2007 2,188 21.3 Year 2008 2,422 23.5 Year 2009 2,397 23.3 TOTAL 10,285 100.0 Asia 2,058 20.0 Europe 3,424 33.3 North America 3,847 37.4 Rest of the World 956 9.3
TOTAL 10,285 100.0
Table 7: Regressions with IVA rating
Q Log (Q) Trimmed Q P/B Log (P/B) Trimmed P/B Intercept 0.89*** –0.07** 0.87*** 1.77*** –0.55*** 0.61*** (9.95) (–2.06) (10.73) (2.80) (–9.37) (2.59) IVA Rating –0.03*** –0.02*** –0.03*** –0.18*** –0.03*** –0.09*** (–4.97) (–7.47) (–5.13) (–3.91) (–8.25) (–5.21) RoE 0.27*** 0.11*** 0.24*** 6.99*** 0.36*** 2.02*** (15.02) (16.68) (15.20) (55.65) (30.88) (28.56) Size 0.13*** 0.07*** 0.13*** 0.04 0.15*** 0.25*** (15.25) (22.11) (15.71) (0.64) (26.60) (10.66) Basic Materials 0.08 0.02 0.07 0.28 0.07* 0.25* (1.50) (1.17) (1.35) (0.71) (1.81) (1.73) Industrial 0.06 0.03 0.04 0.75** 0.21*** 0.60*** (1.13) (1.53) (0.82) (2.16) (6.47) (4.65) Consumer, Non-Cyclical 0.28*** 0.12*** 0.27*** 1.69*** 0.34*** 1.48*** (4.84) (5.54) (5.27) (4.17) (8.99) (9.87) Healthcare 0.68*** 0.30*** 0.66*** 2.37*** 0.44*** 1.31*** (11.44) (12.91) (12.21) (5.61) (11.25) (8.39) Consumer, Cyclical 0.19*** 0.05*** 0.14*** 1.10*** 0.17*** 0.79*** (3.77) (2.66) (3.04) (3.10) (5.02) (5.99) Telecommunications –0.11 –0.05* –0.10 0.87* 0.12*** 0.64*** (–1.53) (–1.81) (–1.62) (1.73) (2.60) (3.43) Utilities –0.36*** –0.18*** –0.36*** –0.03 –0.04 –0.19 (–5.78) (–7.68) (–6.49) (–0.07) (–0.88) (–1.15) Financial –0.47*** –0.31*** –0.49*** –0.15 –0.27*** –0.44*** (–9.80) (–16.44) (–11.09) (–0.44) (–8.56) (–3.44) Technology 0.80*** 0.32*** 0.76*** 2.33*** 0.45*** 1.58*** (13.63) (14.21) (14.19) (5.61) (11.67) (10.25) Year 2005 0.15*** 0.09*** 0.16*** 0.47* 0.28*** 0.46*** (4.11) (6.83) (5.00) (1.89) (11.73) (4.90) Year 2006 0.22*** 0.13*** 0.22*** 0.57*** 0.32*** 0.61*** (7.21) (10.98) (8.06) (2.64) (15.69) (7.58) Year 2007 0.16*** 0.09*** 0.17*** 0.56*** 0.21*** 0.53*** (5.27) (7.40) (6.06) (2.59) (10.65) (6.61) Year 2008 –0.23*** –0.13*** –0.20*** –0.73*** –0.24*** –0.46*** (–7.64) (–11.77) (–7.58) (–3.47) (–12.21) (–5.91) Asia –0.61*** –0.27*** –0.52*** –0.78*** –0.41*** –1.29*** (–14.97) (–17.11) (–14.18) (–2.70) (–15.32) (–12.01) Europe –0.40*** –0.15*** –0.33*** –0.13 –0.13*** –0.56*** (–10.43) (–10.13) (–9.62) (–0.47) (–4.99) (–5.57) North America –0.36*** –0.13*** –0.28*** –0.19 –0.12*** –0.54*** (–9.32) (–8.46) (–7.93) (–0.69) (–4.82) (–5.30) Sample size 8938 8938 8893 8972 8972 8883 R-squared 0.212 0.328 0.233 0.282 0.358 0.206 Adjusted R² 0.211 0.326 0.232 0.280 0.357 0.205
Period: 2005-2009. Where: Q, Tobin’s q; P/B, Price-to-Book; IVA Rating: numerical variable from 1 (CCC) to 7 (AAA); RoE, Return on Equity; Size, logarithm of market capitalization (billion USD); Basic Materials to Technology, dummy variables for the industry sets; Year 2005 to 2008, dummy variables for the corresponding years; Asia, Europe, and North America, dummy variables for the regions.
Table 8: Regressions with subscores
Q Log (Q) Trimmed Q P/B Log (P/B) Trimmed P/B Intercept 0.93*** –0.06 0.91*** 1.93*** –0.53*** 0.65*** (10.13) (–1.63) (10.90) (2.96) (–8.80) (2.66) Strategic governance –0.02** 0.00 –0.02** 0.01 0.01* 0.03 (–2.29) (–1.19) (–2.12) (0.19) (1.76) (1.38) Human capital 0.04*** 0.01*** 0.03*** 0.05 0.01** 0.04* (4.49) (4.32) (4.20) (0.85) (2.45) (1.96) Environment –0.07*** –0.03*** –0.06*** –0.16*** –0.06*** –0.17*** (–7.52) (–8.88) (–7.55) (–2.58) (–10.81) (–7.41) Stakeholder capital –0.01 0.00 0.00 –0.11* –0.01 –0.02 (–0.71) (–1.19) (–0.57) (–1.89) (–0.92) (–1.04) RoE 0.26*** 0.11*** 0.24*** 6.99*** 0.36*** 2.00*** (14.95) (16.60) (15.14) (55.63) (30.84) (28.42) Size 0.14*** 0.08*** 0.14*** 0.06 0.16*** 0.27*** (16.53) (23.06) (16.92) (0.95) (27.50) (11.44) Basic Materials 0.10* 0.03 0.08* 0.32 0.08** 0.30** (1.88) (1.58) (1.72) (0.83) (2.31) (2.09) Industrial 0.07 0.04* 0.05 0.80** 0.23*** 0.65*** (1.40) (1.88) (1.09) (2.30) (7.00) (5.05) Consumer, Non-Cyclical 0.28*** 0.12*** 0.28*** 1.71*** 0.34*** 1.49*** (4.96) (5.63) (5.38) (4.22) (9.10) (9.97) Healthcare 0.71*** 0.31*** 0.69*** 2.42*** 0.47*** 1.39*** (11.98) (13.50) (12.75) (5.71) (11.99) (8.88) Consumer, Cyclical 0.18*** 0.05** 0.13*** 1.12*** 0.16*** 0.79*** (3.66) (2.55) (2.92) (3.14) (4.94) (5.97) Telecommunications –0.15** –0.07** –0.14** 0.78 0.08* 0.53*** (–2.08) (–2.47) (–2.18) (1.56) (1.71) (2.84) Utilities –0.33*** –0.17*** –0.34*** 0.07 –0.01 –0.11 (–5.33) (–7.16) (–6.05) (0.15) (–0.24) (–0.68) Financial –0.50*** –0.32*** –0.51*** –0.19 –0.29*** –0.48*** (–10.41) (–17.03) (–11.69) (–0.54) (–9.04) (–3.75) Technology 0.81*** 0.32*** 0.76*** 2.42*** 0.46*** 1.59*** (13.66) (14.19) (14.21) (5.77) (11.68) (10.27) Year 2005 0.13*** 0.09*** 0.14*** 0.45* 0.26*** 0.41*** (3.58) (6.23) (4.46) (1.80) (10.95) (4.36) Year 2006 0.20*** 0.12*** 0.21*** 0.54** 0.30*** 0.56*** (6.53) (10.25) (7.39) (2.49) (14.83) (6.96) Year 2007 0.14*** 0.08*** 0.15*** 0.53** 0.20*** 0.48*** (4.72) (6.81) (5.52) (2.45) (9.91) (6.06) Year 2008 –0.23*** –0.14*** –0.21*** –0.73*** –0.25*** –0.48*** (–7.80) (–12.01) (–7.75) (–3.46) (–12.55) (–6.12) Asia –0.58*** –0.25*** –0.50*** –0.68** –0.37*** –1.19*** (–14.19) (–15.98) (–13.41) (–2.35) (–13.85) (–11.00) Europe –0.39*** –0.15*** –0.33*** –0.13 –0.12*** –0.55*** (–10.27) (–10.08) (–9.47) (–0.50) (–4.90) (–5.46) North America –0.38*** –0.13*** –0.30*** –0.19 –0.13*** –0.55*** (–9.83) (–8.73) (–8.41) (–0.70) (–4.93) (–5.41) Sample size 8938 8938 8893 8972 8972 8883 R-squared 0.2207 0.3343 0.2411 0.2821 0.3644 0.2106 Adjusted R² 0.2188 0.3326 0.2392 0.2804 0.3628 0.2086
Period: 2005-2009. Where: Q, Tobin’s q; P/B, Price-to-Book; Strategic governance, Human capital, Environment and Stakeholder capital, the four pillars’ subscores; RoE, Return on Equity; Size, logarithm of market capitalization (billion USD); Basic Materials to Technology, dummy variables for the industry sets; Year 2005 to 2008, dummy variables for the corresponding years; Asia, Europe, and North America, dummy variables for the regions.
Table 9: Robustness checks for regressions with IVA rating
Log (Q) Log (Q) Log (P/B) Log (P/B) Intercept –0.18*** –0.18*** –0.37*** –0.36*** (–3.31) (–3.41) (–4.15) (–4.06) IVA Rating –0.02*** –0.02*** –0.04*** –0.03*** (–4.97) (–4.70) (–5.80) (–5.60) RoE 0.08*** 0.09*** 0.27*** 0.28*** (9.16) (9.30) (17.84) (17.98) Size 0.09*** 0.09*** 0.15*** 0.15*** (17.82) (17.84) (17.00) (16.95) Basic Materials 0.03 0.03 0.06 0.05 (1.29) (1.10) (1.40) (1.17) Industrial 0.03 0.04 0.19*** 0.19*** (1.31) (1.42) (4.48) (4.46) Consumer, Non-Cyclical 0.19*** 0.19*** 0.43*** 0.42*** (6.32) (6.35) (8.41) (8.37) Healthcare 0.25*** 0.26*** 0.32*** 0.33*** (8.40) (8.66) (6.46) (6.56) Consumer, Cyclical –0.03 –0.03 0.03 0.03 (–1.05) (–0.91) (0.61) (0.63) Telecommunications –0.10** –0.10** 0.01 0.01 (–2.13) (–2.15) (0.14) (0.07) Utilities –0.10*** –0.10*** 0.11* 0.10* (–2.72) (–2.77) (1.74) (1.67) Financial –0.25*** –0.25*** –0.07 –0.08 (–4.96) (–4.97) (–0.88) (–0.93) Technology 0.18*** 0.19*** 0.23*** 0.24*** (6.13) (6.48) (4.76) (4.9) Year 2005 0.13*** 0.13*** 0.27*** 0.27*** (6.08) (6.19) (7.5) (7.62) Year 2006 0.14*** 0.14*** 0.26*** 0.27*** (7.75) (7.79) (8.88) (8.98) Year 2007 0.11*** 0.11*** 0.21*** 0.21*** (6.15) (6.15) (7.2) (7.25) Year 2008 –0.17*** –0.17*** –0.27*** –0.27*** (–9.89) (–9.89) (–9.59) (–9.52) Asia –0.41*** –0.40*** –0.62*** –0.62*** (–15.17) (–14.93) (–13.88) (–13.86) Europe –0.25*** –0.25*** –0.27*** –0.27*** (–9.30) (–9.12) (–5.96) (–6.01) North America –0.23*** –0.23*** –0.21*** –0.22*** (–8.44) (–8.31) (–4.61) (–4.71) R&D 2.38*** 2.20*** 2.85*** 2.69*** (15.00) (13.10) (10.81) (9.61)
R&D * Sales growth 0.17*** 0.08
(3.19) (0.91)
Sample size 3832 3824 3833 3825
R-squared 0.3941 0.3945 0.3886 0.3888 Adjusted R² 0.3909 0.3912 0.3854 0.3855
Period: 2005-2009. Where: Q, Tobin’s q; P/B, Price-to-Book; IVA Rating: numerical variable from 1 (CCC) to 7 (AAA); RoE, Return on Equity; Size, logarithm of market capitalization (billion USD); Basic Materials to Technology, dummy variables for the industry sets; Year 2005 to 2008, dummy variables for the corresponding years; Asia, Europe, and North America, dummy variables for the regions, R&D, research and development expenses divided by the total assets; Sales growth, two-year revenue growth.
Table 10: Robustness checks for regressions with subscores
Log (Q) Log (Q) Log (P/B) Log (P/B) Intercept –0.13** –0.14*** –0.29*** –0.28*** (–2.50) (–2.63) (–3.18) (–3.10) Strategic governance 0.00 0.00 0.02** 0.02*** (0.42) (0.54) (2.51) (2.67) Human capital 0.01** 0.01** –0.01 –0.01 (2.14) (2.30) (–1.33) (–1.26) Environment –0.06*** –0.06*** –0.09*** –0.09*** (–10.73) (–10.67) (–9.92) (–9.93) Stakeholder capital 0.00 0.00 0.00 0.00 (–0.13) (–0.16) (0.53) (0.53) RoE 0.09*** 0.09*** 0.28*** 0.28*** (9.37) (9.47) (18.15) (18.27) Size 0.10*** 0.10*** 0.16*** 0.16*** (20.00) (19.99) (18.58) (18.51) Basic Materials 0.05* 0.04 0.08* 0.07 (1.83) (1.63) (1.86) (1.62) Industrial 0.05* 0.05** 0.21*** 0.21*** (1.92) (2.01) (5.08) (5.04) Consumer, Non-Cyclical 0.19*** 0.19*** 0.43*** 0.43*** (6.48) (6.50) (8.55) (8.50) Healthcare 0.26*** 0.26*** 0.33*** 0.33*** (8.69) (8.89) (6.68) (6.72) Consumer, Cyclical –0.02 –0.02 0.05 0.05 (–0.76) (–0.66) (1.06) (1.03) Telecommunications –0.14*** –0.14*** –0.07 –0.08 (–3.16) (–3.17) (–0.97) (–1.03) Utilities –0.08** –0.08** 0.15** 0.15** (–2.14) (–2.20) (2.47) (2.40) Financial –0.28*** –0.28*** –0.10 –0.10 (–5.53) (–5.54) (–1.16) (–1.21) Technology 0.19*** 0.20*** 0.25*** 0.26*** (6.50) (6.73) (5.15) (5.18) Year 2005 0.12*** 0.13*** 0.26*** 0.26*** (5.85) (5.93) (7.33) (7.41) Year 2006 0.13*** 0.13*** 0.25*** 0.25*** (7.32) (7.34) (8.59) (8.67) Year 2007 0.10*** 0.10*** 0.20*** 0.20*** (5.82) (5.82) (6.94) (6.98) Year 2008 –0.17*** –0.17*** –0.27*** –0.27*** (–9.99) (–10.00) (–9.68) (–9.62) Asia –0.36*** –0.35*** –0.55*** –0.55*** (–13.33) (–13.17) (–12.19) (–12.24) Europe –0.22*** –0.22*** –0.23*** –0.23*** (–8.34) (–8.24) (–5.08) (–5.21) North America –0.23*** –0.23*** –0.2*** –0.21*** (–8.71) (–8.63) (–4.58) (–4.73) R&D 2.54*** 2.39*** 3.12*** 3.01*** (16.2) (14.39) (11.91) (10.82)
R&D * Sales growth 0.15*** 0.04
(2.80) (0.50)
Sample size 3832 3824 3833 3825
R-squared 0.4153 0.4154 0.4042 0.4044 Adjusted R² 0.4117 0.4117 0.4006 0.4006
Period: 2005-2009. Where: Q, Tobin’s q; P/B, Price-to-Book; Strategic governance, Human capital, Environment and Stakeholder capital, the four pillars’ subscores; RoE, Return on Equity; Size, logarithm of market capitalization (billion USD); Basic Materials to Technology, dummy variables for the industry sets; Year 2005 to 2008, dummy variables for the corresponding years; Asia, Europe, and North America, dummy variables for the regions, R&D, research and development expenses divided by total assets; Sales growth, two-year revenue growth.