Lire
7
References
A. R. Lopez "LAAS/GBAS Ground Reference Antenna with Enhanced Mitigation of Ground
Multipath"; ION ITM. - San Diego, CA; 2008.
J. E. ANGUS "RAIM with Multiple Faults. Navigation". Navigation the Journal of the ION, 2006. -
Vol. 53.
B. Arbesser-Ratsburg “The Galileo Single Frequency Ionospheric Corection Algorithm”. Third
European Space Weather Week. - Nov. 2006.
ARINC Engineering Services “Navstar GPS Space Segment/Navigation User Interfaces”, IS-GPS-200
Revision D. 2004.
F. Beck, O. Glaser and B. Vauvy "Standards – Draft Standards for Retained Galileo GBAS
Configurations".
J. W. Betz and K. R. Kolodziejski "EXTENDED THEORY OF EARLY-LATE CODE TRACKING
FOR A BANDLIMITED GPS RECEIVER" NAVIGATION, Journal of The Institute of Navigation, Vol. 47, No. 3, Fall 2000. - 2000. - pp. 211-226.
J. Blanch, T. Walter, P. Enge, Y. Lee, B. Pervan, M. Rippl and A. Spletter "Advanced RAIM user
Algorithm Description: Integrity Support Message Processing, Fault Detection, Exclusion, and Protection Level Calculation". Proceedings of the 25th International Technical Meeting of The Satellite Division of the Institute of Navigation (ION GNSS 2012). - Nashville, TN; 2012. - pp. 2828-2849.
M. Brenner and F. Liu "Ranging Source Fault Detection Performance for Cat III GBAS". ION GNSS. -
Oregon Convtion Center; Portland, OR, 2010.
R. G. Brown and G. Y. Chin "GPS RAIM: Calculation of Threshold and Protection Radius Using Chi
Square Methods - a Geometric Approach". ION GPS - 1997
H. Cabler and B. DeCleene "LPV: New Improved WASS Instrulment Approach". Proceeding of ION
GPS 2002, International Technical Meeting of the Satellite Division of the Institute of Naviagtion. - Portland, Oregon, U.S., 2002. - pp. 1012-1021.
R. Cassel and S. Smith "Development of Required Navigation Performance (RNP) Requirement for
Airport Surface Movement Guidance and Control". Digital Avionics Conference. 1995.
M. S. Circiu, M. Felux and S. Pullen " Galileo E1, E5a Performance for Frequency,
Autolanding" ION GPS. - Albuquerque, 1992. - pp. 1165-1171.
DO-246D RTCA Inc. “GNSS based precision approach LAAS Signal-in-Space ICD”. 2008.
DoD, Department of Defence USA Global Positioning System Standard Positioning Serivce
Performance Standard; 4th edition. 2008.
EASA CS AWO 1, “Joint Aviation Requirements – All Weather Operations”, Subpart 1, “Automatic
Landing Systems”. 2003.
Egis avia "EUROCONTROL’S FUNDED STUDY,STUDY ON THE IMPACT OF SOLAR
ACTIVITIES ON AVIATION APPLICATIONS BASED ON GNSS OVER ECAC", D2.2 final work plan. 2010.
P. Enge, E. R. Phelts, D. Akos and A. J.Van Dierendonck "SQM Validation" RTCA SC159-WG 2/4
Meeting, 2000
Escher A. C. and Milner C. "GNSS for Civil Aviation – part 3 SBAS"; Dispenses for courses. ENAC
- Toulouse
A. C. Escher and C. Milner "GNSS for Civil Aviation – part 2 ABAS, RAIM"; Dispenses for the
course. ENAC, Toulouse
EUROCAE http://www.eurocae.net - 2010.
EUROCAE WG-62 “Interim Minimum Operational Performance Specification for Airborne Galileo
Satellite Receiving Equipment”, version 0.26, 2007.
EU-U.S Cooperation on Satellite Navigation Working Group C, ARAIM Technical Subgroup. 2012. EU-U.S Cooperation on Satellite Navigation Working Group C, ARAIM Technical Subgroup,
Milestone 3 Report. - 2016.
FAA Advisory Circular 120-28D, “Criteria for Approval of Category III Weather Minima for Takeoff,
Landing and Rollout". 1999.
M. Felux, T. Dautermann and H. Becker "GBAS Approach Guidance Performance - A Comparison
to ILS," Proceedings of the 2013 International Technical Meeting of The Institute of Navigation. San Diego, California, 2013. pp. 409-414.
GJU- Galileo Joint Undertaking “European GNSS (Galileo) Open Service, Signal In Space Interface
GPS SPS “Global Positioning System Standard Positioning Service Performance Standard”,Department
of Defense. 2008.
J. C. Grabowski "Personal Privacy Jammers: Locating Jersey PPDs Jamming GBAS Safety-of-Life
Signal". GPS WORLD. 2012.
P. Groves and M. Petovello"Multipath Vs. NLOS Signals" GNSS Solutions. 2013.
R. Hatch "The synergism of GPS code and carrier measurements". International Geodetic Symposium
on Satellite Doppler Positioning. Las Crucs, 1982.
L. Heng "Safe Satellite Naviagation With Multiple Constellations: Global monitoring of GPS and
GLONASS Signal-in-Space Anomalies". - Stanford L. J. University : Ph.D. Thesis, 2012.
K. Hiroyuki"Dual-Frequency Smoothing for CAT III LAAS: Performance Assessment Considering
Ionosphere Anomalies". Proceedings of the 20th International Technical Meeting of the Satellite Division of The Institute of Navigation (ION GNSS). - Forth Worth, TX, 2007. - pp. 424-437.
D. Holaschutz, R. H. Bishop, B. R. Harris and B.Tolman "Inter-frequency Bias Estimation for the
GPS Monitor Station Network,". Proceedings of the 21st International Technical Meeting of the Satellite Division of The Institute of Navigation (ION GNSS 2008). Savannah, GA, Sep. 2008. - pp. pp. 2405-2415..
P. Y. Hwang, G. McGraw and J. R. Bader "Enhanced Differential GPS Carrier-Smoothed Code
Processing Using Dual-Frequency Measurements". NAVIGATION the Journal of the Institute of NAvigation. - 1999. - pp. 127-137.
ICAO "International Standards and Recommended Practices, Annex 6 to Convention on International
Civil aviation, Operation of aircraft". Eight Edition, 2001.
ICAO "Manual on Required Navigation Perfomance (RNP)". DOC 9613, Second Edition, 1999. ICAO "Performance-based Navigation (PBN) Manual". Third Edition . - 2008.
ICAO "International Standards and Recommended Practices, Annex 10 to Convention on International
Civil aviation". Volume I, Radio Navigation Aids, Sixth Edition. 2006.
ICAO NSP "Airborne DSIGMA Monitor Performance Validation". Montreal, Canada, 2016.
ICAO NSP "Airborne DSIGMA Range Monitor Performace Validation Update". Seattle, United States,
2016.
GBAS provision. Montreal, Canada, 2015.
ICAO NSP WGW/Flimsy29 “Development Baseline SARPs Proposal”, presented by Tim Murphy,
Montreal, May 2010.
ICAO NSP WGW/WP 16 "Observed Nominale Atmospheric Behavior Using Honeywell's GAST-D
Ionosphere Gradient Monitor". Montreal, Canada, 2014.
ICAO PANS ATM
Y.Jiang, C. Milner and C. Macabiau “Code-Carrier Divergence Monitoring for GAST-F GBAS”.
European Navigation Conference 2015. Bordeaux, France, 2015.
O. Julien "Advanced Concepts of GNSS-IENAC 3rd year". ENAC, Toulouse, 2011/2012. H. Kannemans"Cycle slip detection for static and moving receivers". NLR-TR-2003-019, 2003. E. D. Kaplan and C. Jr. Hegarty "Understanding GPS: principles and applications", (Second
Edition). Boston, London; Artech House, Inc., 2006.
S. Khanafseh, F. Yang, B. Pervan, S. Pullen and J. Warburton "Carrier Phase Ionospheric Gradient
Ground Monitor for GBAS with Experimental Validation". ION GNSS; Portland; OR, 2010.
P. Ladoux "Task T008, System Verification. GBAS Toulouse Airport Testing Activities". SESAR
15.3.7 Meeting, Barcelona; 2016.
J. Lee, J. Seo Shin, P. Young, S. Pullen and P.Enge "Ionospheric Threat Mitigation by Geometry
Screening in Ground-Based Augmentation Systems". Journal of Aircraft: 2011. - pp. 1422-1433.
A. Leick “GPS Satellite Surveying”. Wiley-Interscience, 2nd edition, 1995.
J. Liu, M. Lu, Z.Feng and J. Wang "GPS RAIM: Statistics Based Improvement on the Calculation of
the Threshold and Horizontal Protection Radius". 2005.
M. Liu, M. A. Fortin and R. Jr.Landry “A Recursive Quasi-Optimal Fast Satellite Selection Method
for GNSS Receivers”. ION GPS GNSS; 2009. - pp. 3022-3032.
M. Luo, S. Pullen, S. Datta-Barua, G. Zhang, T. Walter and P. Enge"Ionosphere Spatial Gradient
Threat for LAAS:Mitigation and Tolerable Threat Space". ION NTM; 2004
C. Macabiau “Analysis of the Feasibility of Using GPS Carrier Phase Ambiguity Resolution
A. Martineau "Performance of Receiver Autonomous Integrity Monitoring (RAIM) for Vertically
Guided Approach", PhD Thesis. Institute Nationale Politecnique, Toulouse, 2008
G. A McGraw, T.Murphy, M. Brenner, S. Pullen and A.J.Van Dierendonck "Development of the
LAAS Accuracy Models". Proceedings of the 13th International Technical Meeting of the Satellite Division of The Institute of Navigation; ION GPS. Salt Laken UT, 2000. - pp. 1212-1223.
C. Milner "GBAS Evolutions". International Technical Symposium on Navigation and Timing
(ITSNT). ENAC, Toulouse, France, 18th November 2014.
C. Milner, A. Guilbert and C. Macabiau "Evolution of Corrections Processing for MC/MF Ground
Based Augmentation System (GBAS)". ION ITM. Dana Point, CA, United States, 2015.
A. M. Mitelman "SQM for GPS augmentation systems". 2004.
L. Montloin “Review of State of the Art of A/C navigation”. ENAC, Toulouse, France, 2011.
L. Montloin "GNSS Integrity Monitoring in the Presence of Singular Events", Ph. D. Thesis. ENAC,
Toulouse, France, July 2014.
T. Murphy and J. Booth "GBAS SARPs Review and Validation of Airborne Multipath Requirements"
GNSSP WG B Toulouse 10/99 WP43.
T. Murphy, M. Harris and S. Beauchamp "Implications of 30-Second Smoothing for GBAS
Approach Service Type D". Proceedings of the 2010 International Technical Meeting of The Institute of Navigation,. San Diego, CA, 2010. - pp. 376-385.
P. Neri "Use of GNSS signals and their augmentations for Civil Aviation navigation during Approaches
with Vertical Guidance and Precision Approaches” Ph.D. Thesis. Ecole Nationale de l’Aviation Civile, Toulouse-, 2011.
M. S. Nolan "Fundamentals of Air Traffic Control". Wadsworth Publishing Company, 2nd, 1994. B. Pervan, I. Sayim and S. Khanafseh "Synthesis of Empirical and Theoretical Approaches Toward
the Establishment of GBAS sigma_pr_gnd". The Journal of Navigation. 2005. - pp. 297-313.
S. Pullen and P. Enge "An Overview of GBAS Integrity Monitoring with a Focus on Ionosheric Spatial
Anomalies". Indian Journal of Radio & Space Physics, VOL. 36. August 2007.
M. Rees "EUROCONTROL Policy for GNSS in Europe". ENRI International Workshop on
ATM/CNS. 2009
"Methodology for Determining Pseudorange Noise and Multipath Models for a Multi-Constellation,
Multi-frequency GBAS System". Proceedings of the 2015 International Technical Meeting of The Institute of Navigation. Dana Point, California, 2015. - pp. 383-392.
RTCA Inc. DO245-A Minimum Aviation System Performance Standards for Local Area Augmentation
System [Book]. - 2004 : [s.n.].
RTCA Inc.; DO253-C Minimum operational performance standards for GPS local area augmentation
system airborne equipment [Book]. - 2008.
RTCA, Inc. “Minimum Operational Performance Standards for Global Positioning System/Wide Area
Augmentation System Airborne Equipment”, DO229-D,RTCA SC-159 [Book]. - 2006.
W. Schuster and W. Ochieng "Harmonisation of Category-III Precision Approach Navigation System
Performance Requirements". THE JOURNAL OF NAVIGATION. 2010.
J. Seo, J. Lee, S. Pullen, P. Enge, S. Close. "Targeted Parameter Inflation Within Ground-Based
Augmentation System to Minimize Anomalous Ionospheric Impact". Journal of Aircraft; Vol. 49, No 2; March-April 2012
SESAR 15.3.7; WP3 “VDB Assumption and Requirements” 2015.
SESAR JU 15.3.6.D03 "High Level Performance Allocation and Split of Responsibilities between Air
and Ground". 2011.
SESAR www.sesarju.eu. 2009.
A. Shively Curtis "GBAS GAST-D (CAT IIIB) Aircraft Monitor Performance Requirements for Single
Referene Receiver Faults". Proceedings of the 2009 International Technical Meeting of The Institute of Navigation. Anaheim, CA, 2009. - pp. 903-916.
V. Simili Dwarakanath and B. Pervan "Code-Carrier Divergence Monitoring for the GPS Local Area
Augmentation System". Proceedings of IEEE/ION PLANS 2006. San Diego, CA, 2006. - pp. 483-493.
M. Stakkeland, L. Andalsvik Yngvild and S. Jacobsen Knut "Estimating Satellite Excessive
Acceleration in the Presence of Phase Scintillations". Proceedings of the 27th International Technical Meeting of The Satellite Division of the Institute of Navigation ION GNSS+ 2014. Tampa, Florida, 2014. - pp. 3532-3541..
Thales "GBAS CAT II/III L1 Approach", CAT II-III L1 as a step to multiconstellation
K. Van Dyke, K. Kovach, J. Kraemer, J. Lavrakas, J. P. Fernow, J. Reese, N. Attallah and B. Baevitz "GPS Integrity Failure Modes and Effects Analysis". Proceedings of the National Technical
Meeting of The Institute of Navigation. Anaheim, CA, 2003. pp. 689-703.
Z. Wang, C. Macabiau, J. Zhang and A. C. Escher "Prediction and analysis of GBAS integrity
monitoring availability at LinZhi airport", Springer Verlag. 2014. - pp. 27-40.
M. Zhang, J. Zhang and Y. Qin “Satellite Selection for Multi-constellation”. Position, Location and
A.
Civil Aviation Authorities and Requirements
A.1
Civil Aviation Authorities
The navigation equipment has to meet a number of requirement, to be authorized for use aboard aircraft, so as to ensure their capability to perform their function. The aim of this section is to briefly present and describe the main organisations which issue these requirements in the World.
A.1.1 International Civil Aviation Organization (ICAO)
ICAO is the agency of the United Nations created in 1944 to promote the safe and orderly development of international civil aviation throughout the world, which codifies the principles and techniques of international air navigation and fosters the planning and development of international air transport to ensure safe and orderly growth and the environmental protection. The ICAO Council adopts standards and recommended practices (SARPs) concerning air navigation, prevention of unlawful interference, and facilitation of border-crossing procedures for international civil aviation. In addition, the ICAO defines the protocols for air accident investigation followed by transport safety authorities in countries signatory to the Convention on International Civil Aviation, commonly known as the Chicago Convention (ICAO, 2008).
In particular, The International Civil Aviation Organization (ICAO) is responsible for establishing the standards for radio navigation aids, including the ones concerning GNSS. They are mainly defined in Annex 10 to the Convention on International Civil Aviation.
A.1.2 Radio Technical Commission for Aeronautics (RTCA, Inc.)
Founded as the Radio Technical Commission for Aeronautics in 1935, RTCA, Inc. is a private, not-for-profit corporation that develops consensus-based recommendations regarding communications, navigation, surveillance, and air traffic management (CNS/ATM) system issues. RTCA works in response to requests from the Federal Aviation Administration (FAA) to develop comprehensive, industry-vetted and endorsed recommendations for the government on issues ranging from technical performance standards to operational concepts for air transportation.
In particular, the working group SC-159 of RTCA focuses on GNSS systems. His task is to develop minimum standards that form the basis for FAA approval of equipment using GPS as primary means of civil aircraft navigation.
Different RTCA publications cover an important role in satellite navigation and will be cited in this work:
DO-229D – Minimum Operational Performance Standards for Global Positioning System/Wide Area Augmentation System Airborne Equipment.
DO-245A – Minimum Aviation System Performance Standards for Local Area Augmentation System
DO-246D – GNSS Based Precision Approach Local Area Augmentation System (LAAS) Signal-in-Space Control Document (ICD)
DO-253C – Minimum Operational Performance Standards for GPS Local Area Augmentation System Airborne Equipment
A.1.3
European Organization for Civil Aviation Equipment (EUROCAE)
The European Organization for Civil Aviation Equipment (EUROCAE) is a non-profit making organization which was formed to provide a European forum for resolving technical problems with electronic equipment for air transport. EUROCAE deals exclusively with aviation standardization (Airborne and Ground Systems and Equipment) and related documents as required for use in the regulation of aviation equipment and systems (EUROCAE, 2010).
EUROCAE is composed of manufacturers, service providers, national and international aviation authorities as well as users (airlines, airports). EUROCAE can be considered as the equivalent of RTCA for Europe.
To develop EUROCAE documents, it organizes Working Groups (WG). In particular, the WG-62 is responsible for the preparation of aviation use of Galileo and the development of initial Minimum Operation Performance Specifications (MOPS) for the first generation of Galileo airborne receivers.
A.1.4
Federal Aviation Authority (FAA) and European Aviation Safety Agency (EASA)
The official authorities which publish mandatory requirements to be respected by aircraft manufacturers and airliners to fly an aircraft are the FAA and EASA. The FAA is an agency of the United States Department of Transportation. The EASA can be considered as the equivalent structure for the European Commission. Their main goal is to ensure the safety of the civil aviation air traffic. Many of their publications are based on or refer to the standardization publications emitted by the previous organisations.
It can be mentioned here publications which are directly related to this study and which are the airworthiness criteria for landing operations. These can be found in FAA Advisory Circular AC 120-28D (FAA, 1999) and EASA CS AWO (EASA, 2003).
A.2
Phases of Flight
PHASES OF FLIGHT
as well as the alterations in airspace properties, the technologies and performance requirements vary greatly between operations within each phase.
Next figure shows a scheme of a classical commercial aircraft operation starting from the taxing operation until the landing; for each operation is included the accident percentage.
Figure 107 – Typical phases of flight (Cassel, et al., 1995)
As it is possible to see from Figure 107 typical flight is divided into different phases:
Taxing; this operation involves all the movements from the gate to the departure runway.
Take-off; this is the process of applying take-off power to the engines followed by reaching
sufficient speed to generate lift before climb 35 ft. above the runway elevation. This operation accounts for the 14.3% of fatal accidents.
Initial Climb; this phase follows the take-off, generally for a commercial flight the pilot switch
to an auto-pilot system. Initial claim accounts for 11.8% of accidents.
Climb; this phase is characterized by the entrance in the high-density air traffic zone and may
require a series of complex manoeuvres. It’s potentially more dangerous than the en-route phase due to the closeness to the ground.
Cruise; after the aircraft has climbed to cruising altitude, it performs en-route operations via
waypoints. Waypoints may be defined either by the position of NavAids over ground, longitude and latitude fixes over water or when using GPS or combined GPS/INS by custom waypoints entered in the integrated GPS receiver.
Descent; occurs between the en-route flight at cruise altitude and terminal arrival at the Initial
Approach Fix (IAF) required for initiating an approach. An increase from the en-route phase to 7.5% of accidents is noted due to increased traffic and critical aircraft functions.
Initial Approach; phase after the IAF point where the pilot starts the navigation towards the
FAF (Final Approach Fix), a position aligned with the runway from where a safe controlled descent towards the runway can be achieved. The accident rate for this operation accounts for the 12.5 %.
Final Approach; it begins at the FAF and continues beyond the Minimum Decision Height
(MDH) until the pilot performs the landing manoeuvre. The MDH is the height above the runway at which the pilot must abort if the required visual reference to the runway is not obtained. It is usual that the better the landing aids, the lower the MDH. Final approach is the most dangerous flight phase of flight (26.6% of accidents) due to high traffic densities, obstacles and frequency and complexity of mechanical operations.
Landing; this is the final part of a flight, after this phase other taxiing operations are performed
to reach the arrival gate. Alignment of the aircraft to the runway is determined just prior to the touchdown during the de-crab manoeuvre. In high winds, the aircraft will approach at a ‘crabbed’ angle. These processes may be performed by the pilot visually or by the autopilot coupled to the navigation and landing aids. The landing phase is completed at the end of the main runway before the aircraft returns to the taxi area. Landing accounts for 13.9% of fatal accidents.
Due to particular conditions like high-density traffic, extreme weather condition or poor visibility a pilot or an air traffic control can perform a Missed approach procedure. This procedure usually consists of a climb and then a holding procedure formed of two straight segments and two 180 degree turns. Terminal navigation aids are usually used for navigation such as the ILS or terminal VOR (Nolan, 1994).
A.2.1
Approach
From the analysis of the flight phases is possible to note how the two approach phases account for over 39% of the accident rate in a commercial flight; whit no doubt we can say that this phase is the most important and the most critical during the flight. To better analyze the approaches phase we need to describe this operation in deep.
The categories of approach are defined according to the level of confidence that can be placed by the pilot into the system he is using to help him land the plane safely. Approaches are divided in two main segments: the aircraft first follows the indication provided by the landing system, and then the pilot takes over in the final part and controls the aircraft using visual outside information. As the reliability of the aircraft, the crew and the landing system increases, the height of the aircraft above the ground at the end of the interval of use of the information provided by the system can be decreased (Macabiau, 1997). The next figure shows a focus of the last part of a commercial flight, in particular the approach phase is
PHASES OF FLIGHT
which allow conducting navigation operations for civil aviation during the corresponding phase of flight are shown at the bottom of the figure.
Figure 108 – Phases of flight and GNSS augmentation (Montloin, 2011)
The ICAO defines, in Annex 6, three main approaches and landing categories (ICAO, 2001) and they are classified as follows:
Non-Precision Approaches and landing operations (NPA): an instrument approach and
landing which utilizes lateral guidance but does not utilize vertical guidance.
Approaches and landing operations with vertical guidance (APV): an instrument approach
and landing which utilizes lateral and vertical but does not meet the requirements established for precision approach and landing operation.
Precision approaches and landing operation (PA): an instrument approach and landing using
precision lateral and vertical guidance with minima as determined by the category of operation. Three different operational parameters which are the Decision Height (DH), the Distance of Visibility and the Runway Visual Range (RVR) can be used to describe better the previous category for approach and landing. These parameters are defined as follows (Cabler, et al., 2002):
Decision Height (DH) is the minimal height above the runway threshold at which as missed approach procedure must be executed if the minimal visual reference required in order continuing the approach has not been established.
Distance of Visibility is the greatest distance, determined by atmospheric conditions and expressed in units of length, at which it is possible with unaided eye to see and identify, in daylight a prominent dark object, and at night a remarkable light source.
ABAS ABAS (not standardized)
SBAS
GBAS developmentUnder
En route oceanic En route domestic NPA Terminal PA APV CAT I APV1 APV2 APV baro VNAV
CAT II CAT III
Surface Departure Missed approach ABAS (missed approach)
Runway Visual Range (RVR) is the maximum distance in the landing direction at which the pilot on the centre line can see the runway surface markings, runway lights, as measured at different points along the runway and in particular in the touchdown area.
In the next table the requirements, as function of the previous parameters, are listed. Table 31 – Decision height and visual requirements (ICAO, 2001)
Category
Minimum Descent Altitude (MDA)Minimum Descent Height (MDH) Decision Altitude (DA)
Decision Height (DH) Visual Requirement NPA MDA ≥ 350 ft. Depending on the airport equipment APV DA ≥ 250 ft. LPV 200 DH ≥ 60 m (200 ft.) Precision Approaches CAT-I DH ≥ 60 m (200 ft.) Visibility ≥ 800 m RVR ≥ 550 m CAT-II 30 m (100 ft.) ≥ DH ≤ 60 m (200 ft.) RVR ≥ 300 m CAT-III A 0 m ≥ DH ≤ 30 m (100 ft.) RVR ≥ 175 m B 0 m ≥ DH ≤ 15 m (50 ft.) 50 m ≤ RVR ≥ 175 m C DH = 0 m RVR = 0 m
A.3
Performance Based Navigation (PBN)
The Performance Based Navigation (PBN) concept specifies aircraft RNAV (Area Navigation) system performance requirements defined in terms of the accuracy, integrity, availability, continuity and functionality, which are needed for the proposed operations in the context of a particular airspace concept. The PBN concept represents a shift from sensor-based to performance-based navigation. Performance requirements are identified in navigation specifications, which also identify the choice of navigation sensors that may be used to meet the performance requirements. These navigation specifications are defined at a sufficient level of detail to facilitate global harmonization by providing specific implementation guidance for States and operators (ICAO, 2008).
PERFORMANCE BASED NAVIGATION (PBN)
The PNB criteria offers a certain number of advantages over the sensor-based developing of the airspace and obstacle clearance criteria:
Reduces the need to maintain sensor-specific routes and procedures, and their associated costs. Avoids the need for developing sensor-specific operations with each new evolution of
navigation systems, which would be cost-prohibitive.
Allows for more efficient use of airspace (route placement, fuel efficiency and noise abatement) Clarifies how RNAV systems are used.
Facilitates the operational approval process for operators by providing a limited set of navigation specifications intended for global use.
The RNB concept relies on RNAV system and Required Navigation Performance (RNP) procedures, the ICAO definitions for these two key terms and other key terms are listed below (ICAO, 2001):
Area Navigation (RNAV): A method of navigation which permits aircraft operation on any desired flight path within the coverage of station-referenced navigation aids or with the limits of the capability of self-contained aids, or a combination of these.
Area Navigation Equipment: Any combination of equipment used to provide RNAV guidance. Required Navigation Performance (RNP) Systems: An area navigation system which supports
on-board performance monitoring and alerting.
Required Navigation Performance (RNP): A statement of the navigation performance necessary for operation within a defined airspace.
The RNP settled by ICAO in (ICAO, 2006) can by defined by the Total System Error (TSE); the next figure illustrates how the TSE is composed.
Figure 109 – Total system error components (Martineau, 2008) The terms presented in Figure 109 are:
Desired Path is the path that the flight crew and the air traffic control can expect by the aircraft for a given route or leg.
Defined Path is the output of the definition function.
PDE (Path Definition Error) is the difference the desired path (the path that the crew and air traffic control can expect the aircraft to fly) and the path defined by the Flight Management System (FMS).
PSE (Path Steering Error) or FTE (Flight Technical Error) is the difference between the estimated position of the aircraft and the path defined by the FMS (Flight Management System). This error is due to the way the aircraft is controlled, and it is also called XTK (Cross Track Error).
NSE (Navigation System Error) is the difference between the estimated position and the true position of the aircraft.
A.4
Performance Navigation Criteria
Navigation system performance requirements are defined in the Manual on Required Navigation Performance (ICAO, 1999) for a single aircraft and for the total system which includes the signal-in-space, the airborne equipment and the ability of the aircraft to fly the desired trajectory. These total
PERFORMANCE NAVIGATION CRITERIA
system requirements were used as a starting point to derive GNSS signal-in-space performance requirements which criteria definitions are given in this section (ICAO, 2006).
A.4.1 Accuracy
“GNSS position error is the difference between the estimated position and the actual position. For an estimated position at a specific location, the probability should be at least 95 per cent that the position error is within the accuracy requirement.” (ICAO, 2006).
The accuracy is the measure of the quality of the positioning element of the navigation function; it describes a relationship between the real position and the estimated position displayed to the pilot. In order to characterize the accuracy on the estimated quantity, ICAO has defined a 95% confidence level. It means that for any estimated position at a specific location, the probability that the position error is within the former requirement should be at least 95%.
A.4.2 Availability
“The availability of GNSS is characterized by the proportion of time the system is to be used for navigation during which reliable navigation information is presented to the crew, autopilot or other system managing the flight of the aircraft.” (ICAO, 2006).
The availability of a navigation system is the ability of the system to provide the required function and performance at the initiation of the intended operation.
A.4.3 Integrity
“Integrity is a measure of the trust that can be placed in the correctness of the information supplied to the total system. Integrity includes the ability of a system to provide timely and valid warnings to the user (alerts) when the system must not be used for the intended operation.” (ICAO, 2006)
Integrity requirements are defined thanks to three parameters: The integrity risk
The time to alert The alert limit
The Integrity risk is the probability of providing a signal that is out of tolerance without warning the user in a given period of time.
Time-to-Alert is the maximum allowable elapsed time from the onset of a positioning failure until the
equipment annunciates the alert.
Alert limits, for each phase of flight, ensures that the position error is acceptable, alert limits are defined
The Horizontal Alert Limit (HAL) is the radius of a circle in the horizontal plane (the local plane tangent to the WGS-84 ellipsoid), with its centre being at the true position, that describes the region that is required to contain the indicated horizontal position with the required probability for a particular navigation mode.
The Vertical Alert Limit (VAL) is half the length of a segment on the vertical axis (perpendicular to the horizontal plane of WGS-84 ellipsoid), with its centre being at the true position, that describes the region that is required to contain the indicated vertical position with the required probability for a particular navigation mode.
The probability of non-integrity detection quantifies the integrity risk. It represents the probability that an error exceeds the alert limit without the user being informed within the time to alert. The values assigned to these three parameters depend on the specific application and intended operation. They are determined by the International Civil Aviation Organization.
A.4.4 Continuity
“Continuity of Service of a system is the capability of the system to perform its function without unscheduled interruptions during the intended operation.” (ICAO, 2006).
Continuity relates to the capability of the navigation system to provide a navigation output with the specified accuracy and integrity throughout the intended operation, assuming that it was available at the start of the operation. The occurrence of navigation system alerts, either due to rare fault-free performance or to failures, constitute continuity failures. For en-route, since the durations of these operations are variable, the continuity requirement is specified as a probability on a per-hour basis. For approach and landing operations, the continuity requirement is stated as a probability for a short exposure time. More specifically, continuity is the probability that the specified system performance will be maintained for the duration of a phase operation, presuming that the system was available at the beginning of that phase operation and was predicted to operate throughout the operation.
A.5
Annex 10 Signal in Space Requirements
According to (ICAO, 2006) the combination of GNSS elements and a fault-free GNSS user receiver shall meet the signal-in-space (SiS) requirements.
ANNEX 10SIGNAL IN SPACE REQUIREMENTS
Table 32 – SiS performance requirements (ICAO, 2006)
Typical Operation Accuracy Horizontal 95% (Note 1 and 3) Accuracy Vertical 95% (Note 1 and 3) Integrity
(Note 2) Time-to-Alert (Note 3)
Continuity
(Note 4) Availability (Note 5)
En-Route 3.7 km N/A 101 −−7/h 5 min
1 − 10−4/h to 1 − 10−8/h 0.99 to 0.99999
En-Route Terminal 0.74 km N/A 101 −−7/h 15 s
1 − 10−4/h to 1 − 10−8/h 0.99 to 0.99999 Initial Approach, Intermediate Approach, Non-Precision Approach, Departure 220 m N/A 101 −−7/h 10 s 1 − 10−4/h to 1 − 10−8/h 0.99 to 0.99999 Approach Operations with Vertical Guidance (APV-I) 16 m 20 m 101 − 2 ∙−7/app 10 s 101 − 8 ∙−6/15 s 0.99 to 0.99999 Approach Operations with Vertical Guidance (APV-II) 16 m 8 m 101 − 2 ∙−7/app 6 s 101 − 8 ∙−6/15 s 0.99 to 0.99999 Category I Precision Approach 16 m 4 m ~ 6 m 101 − 2 ∙−7/app 6 s 1 − 8 ∙ 10−6/15 s 0.99 to 0.99999
Note for Table 32 as defined by (ICAO, 2006)
1. The 95th percentile values for GNSS position errors are those required for the intended operation at the lowest height above
threshold (HAT), if applicable.
2. The definition of the integrity requirement includes an alert limit against which the requirement can be assessed. For Category I precision approach, a vertical alert limit (VAL) greater than 10 m for a specific system design may only be used if a system-specific safety analysis has been completed. Further guidance on the alert limits is provided in (ICAO, 2006) Attachment D. These alert limits are:
Table 33 – Alert limit associated to the typical operations (ICAO, 2006)
Typical Operation Horizontal Alert Limit Vertical Alert Limit En-Route (Oceanic/Continental
Low Density) 7.4 Km (4 NM) N/A
En-Route (Continental) 3.7 Km (2 NM) N/A
En-Route, Terminal 1.85 Km (1 NM) N/A
NPA 556 m (0.3 NM) N/A
APV-I 40 m (130 ft.) 50 m (164 ft.)
APV-II 40 m (130 ft.) 20 m (66 ft.)
CAT-I Precision Approach 40 m (130 ft.) 35 to 10 m (115 to 33 ft.)
3. The accuracy and time-to-alert requirements include the nominal performance of a fault-free receiver.
4. Ranges of values are given for the continuity requirement for en-route, terminal, initial approach, NPA and departure operations, as this requirement is dependent upon several factors including the intended operation, traffic density, and complexity of airspace and availability of alternative navigation aids. The lower value given is the minimum requirements for areas with low traffic density and airspace complexity. The higher value given is appropriate for areas with high traffic density and airspace complexity. Continuity requirements for APV and Category I operations apply to the average risk (over time) of loss of service, normalized to a 15-second exposure time.
5. A range of values is given for the availability requirements as these requirements are dependent upon the operational need which is based upon several factors including the frequency of operations, weather environments, the size and duration of the outages, availability of alternate navigation aids, radar coverage, traffic density and reversionary operation procedures. The lower values given are the minimum availabilities for which a system is considered to be practical but are not adequate to replace non-GNSS navigation aids. For en-route navigation, the higher values given are adequate for GNSS to be the only navigation aid provided in an area. For approach and departure, the higher values given are based upon the availability requirements at airports with a large amount of traffic assuming that operations to or from multiple runways are affected but reversionary operational procedures ensure the safety of the operation.
6. A range of values is specified for Category I precision approach. The 4.0 m (13 feet) requirement is based upon ILS specifications and represents a conservative derivation from these specifications.
7. GNSS performance requirements for Category II and III precision approach operations are under review and will be included at a later date.
8. The terms APV-I and APV-II refer to two levels of GNSS approach and landing operations with vertical guidance (APV) and these terms are not necessarily intended to be used operationally
The concept of a fault-free user receiver is applied only as a means of defining the performance of combinations of different GNSS elements. The fault-free receiver is assumed to be a receiver with nominal accuracy and time-to-alert performance. Such a receiver is assumed to have no failures that affect the integrity, availability and continuity performance.
8.1
CAT II/III Requirements
CATII/IIIREQUIREMENTS
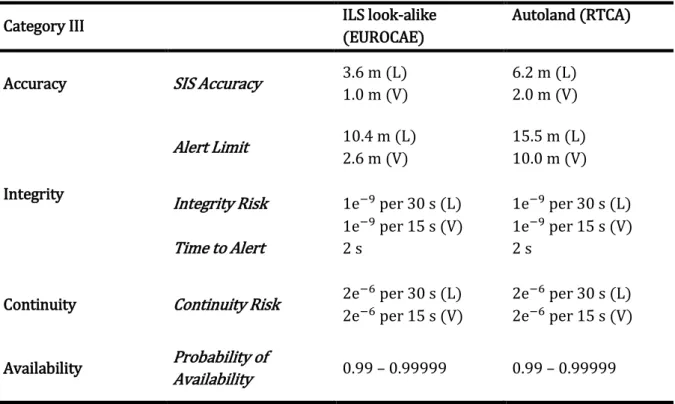
agencies – the EUROCAE – EU and the RTCA – USA- for several years. Two separate methods were used in the derivation of these requirements, the first one is named “ILS Look-Alike Method” is based on the concept of matching the performance of the ILS at the Navigation System Error (NSE) level through linearization of current specifications at a given height. The second method is called “Autoland Method” is based on the need to protect the safety of a landing operation using the current specification for the probability to land in a given landing box (Schuster, et al., 2010).
The first method named “ILS Look-Alike Method” is based on the concept of matching the performance of the ILS at the Navigation System Error (NSE) level through linearization of current specifications at a given height. The figure below explains this method
Figure 110 – “ILS look-alike method”
The second one called “Autoland Method” is based on the need to protect the safety of a landing operation using the current specification for the probability to land in a given landing box. The following figure describes this method.
Figure 111 – Autoland method The use of this two method has given results quite different.
Table 34 – SiS performance requirements for various phases of aircraft operation
Category III ILS look-alike
(EUROCAE)
Autoland (RTCA)
Accuracy SIS Accuracy 3.6 m (L) 1.0 m (V) 6.2 m (L) 2.0 m (V)
Integrity Alert Limit 10.4 m (L) 2.6 m (V) 15.5 m (L) 10.0 m (V) Integrity Risk Time to Alert 1e−9 per 30 s (L) 1e−9 per 15 s (V) 2 s 1e−9 per 30 s (L) 1e−9 per 15 s (V) 2 s
Continuity Continuity Risk 2e−6 per 30 s (L)
2e−6 per 15 s (V)
2e−6 per 30 s (L) 2e−6 per 15 s (V)
Availability Probability of
B.
GBAS Messages
To send the corrections, and others parameters, from the ground station to the aircraft, a series of messages is used. Table 35 lists the content of each message (DO-246D, 2008).
Table 35 – LAAS VHF Data Broadcast (VDB) messages and broadcast rate (DO-246D, 2008)
Message Type Message Name Minimum Broadcast Rate Maximum Broadcast Rate
1 Differential Correction for 100 s Smoothed Pseudorange
For Each Measurement Type: All Measurement Blocks, once per Frame
(Note 1)
For Each Measurement Type: All Measurement Blocks, once per Frame
(Note 1) 2 GBAS Related Data Once per 20 Consecutive Frames Once per Frame
3 Null Message N/A N/A
4
Final Approach Segment (FAS) Construction Data
All FAS Blocks Once per 20 Consecutive Frames
(Note 2)
All FAS Blocks Once per Frames (Note 2) Terminal Area Path
(TAP) Construction Data (notes 2 and 3) notes 2 and 3) 5 Availability (Optional) Ranging Source All Impacted Source once per 20 Consecutive
Frames
All Impacted Source once per 5 Consecutive Frames
6 Reserved for Carriers Corrections - -
7 Reserved for Military - -
8 Reserved for Test - -
11 Differential corrections 30 s Smoothed Pseudoranges
For Each Measurement Type: All Measurement Blocks, once per Frame
(Note 5)
For Each Measurement Type: All Measurement Blocks, once per Frame
(Note 5) 101 Correction (as defined in GRAS Pseudorange
(ICAO, 2006)) - -
Note 1: each type 1 message or linked type 1 message pair broadcast in a given frame includes a set of 100 second smoothed corrections with the common modified z-count for its measurement type.
Note 2: if no FAS or TAP are currently being supported, than is not necessary to transmit type 4 message.
Note 3: the minimum and maximum broadcast rate for TAP data will be the standardized commensurate with the procedure supported as in the operational concept is matured.
Note 4: message type 3 was previously reserved to support an airport pseudolite (APL) or Ground Based Ranging Source (GBRS). APLs are not included in LAAS ICD (DO-246D, 2008).
Note 5: each type 11 message (or a linked set to type 11 message) include a set of a 30 s smoothed corrections with the common modified z-count for its measurement type.
According to the active service each message can be optional or required, in the next table the requirement are listed (DO-246D, 2008).
Table 36 – GBAS message type required for each service level
Message type GAST A GAST B GAST C GAST D
MT1 Optional (note1) Required Required Required
MT2 Required Required Required Required
MT2-ADB1 Optional Optional Optional Required
MT2-ADB2 Optional Optional Optional Optional
MT2-ADB3 Optional Optional Optional Required
MT2-ADB4 Optional Optional Optional Required
MT3 Optional Optional Optional Required
MT4 Optional Required Required Required
MT5 Optional Optional Optional Optional
MT11 Not applicable Not Applicable Not Applicable Required MT101 Optional (note1) Not Allowed Not Allowed Not Allowed Note 1; for GAST A either message type 1 or message type 101 are broadcast not both.
In the next part some of the most important messages will be shown in detail. All the details about the other messages are described in (DO-246D, 2008).
B.1
Type 1 Message – Pseudorange Correction
Message type 1 provides the differential corrections data for individual GNSS ranging sources applicable to pseudorange that are carrier smoothed with a time constant of 100 s. The message contains three sections: message information (time of validity, additional message flag, number of measurement and message flag), low frequency correction information (ephemeris decorrelation parameters, ranging source ephemeris CRC and ranging source availability duration information) and the ranging source data measurements blocks.
TYPE 1MESSAGE –PSEUDORANGE CORRECTION
Table 37 – Message type 1 format
Data Content Bit Used Range of Values Resolution
Modified z-count 14 0-1199.9 sec 0.1 sec
Additional Message Flag 2 0-3 1
Number of Measurement 5 0-18 1 Measurement Type 3 0-7 1 Ephemeris Decorrelation Parameters (note 2,5) 8 0-1.275 × 10 −3 𝑚/𝑚 5 × 10⁻⁶ 𝑚/𝑚 Ephemeris CRC (note 2,5) 8 (Most significant byte) (note 6) - - 8 (least significant byte) (note 7) Source Availability Duration
(note 4,5) 8 0-2450 sec 10 sec
For N Measurement Blocks:
Ranging Source ID 8 1-255 1
Issue of Data (IOD) 8 0-255 1
Pseudorange Corrections(PRC) 16 ±327.67 𝑚 0.01 m
Range Rate Correction (RRC) 16 ±32.767 𝑚/𝑠 0.001 m/s
𝜎𝑝𝑟 𝑔𝑛𝑑 8 0-5.08 m 0.02 m 𝐵1 (note 1) 8 ±6.35 𝑚 0.05 m 𝐵2 (note 1) 8 ±6.35 𝑚 0.05 m 𝐵3 (note 1) 8 ±6.35 𝑚 0.05 m 𝐵4 (note 1) 8 ±6.35 𝑚 0.05 m Notes
1. 1000 0000 indicates the measurement is not available 2. For SBAS satellite the parameter is set to zero 3. 1111 1111 indicates the source is invalid
4. 1111 1111 indicates that value is not completed and should not be used 5. Parameter is associated with the first transmitted measurement block
6. Ephemeris CRC most significant byte – this byte contain the remainder coefficients, 𝑟9to 𝑟16 of the 16 bit ephemeris
CRC
7. Ephemeris CRC least significant byte – this byte contains the remainder coefficients, 𝑟1to 𝑟8 of the 16 bit ephemeris
CRC.
B.2
Type 2 Message – GBAS Related Data
It identifies the exact location for which the differential corrections provided by the ground augmentation system are referenced. The message also contains configuration data and data to compute a tropospheric correction.
Additional data blocks may be appended to the end of this type of message. In the following section the Additional data block 3 could be useful to defined GAST-D pseudorange measurement error models. It contains missed detection “K” values for ephemeris error and ionospheric parameters for GPS and GLONASS.
In (DO-246D, 2008) the message type 2 format is defined thanks to this following table: Table 38 – Message Type 2 format
Data Content Bit Used Range of Values Resolution
Ground Station Reference
Receivers 2 2-4 -
Ground Stations Accuracy
Designator 2 - -
Spare 1 - -
Ground Station
Continuity/integrity Designator 3 - -
Local Magnetic Variation 11 ±180° 0.25°
Spare 5 - - 𝜎𝑖𝑜𝑛𝑜 𝑣𝑒𝑟𝑡 𝑔𝑟𝑎𝑑𝑖𝑒𝑛𝑡 8 0 − 25.5 × 10⁻⁶ 𝑚/𝑚 0.1 × 10⁻⁶ 𝑚/𝑚 Refractivity Index 8 16-781 3 Scale Height 8 0-25500 m 100 m Refractivity Uncertainty 8 0-255 1 Latitude 32 ±90° 0.0005 arcsec Longitude 32 ±180° 0.0005 arcsec
Reference Point Height 24 ±83886.07 𝑚 0.01 m
Additional Data block 1 (if provided)
Reference Station Data Selector 8 0-48 1
Maximum use Distance 𝐷𝑚𝑎𝑥 8 2 − 510 𝐾𝑚 2 km
𝐾𝑚𝑑 𝑒 𝑃𝑂𝑆,𝐺𝑃𝑆 8 0-12.75 0.05
TYPE 11MESSAGE –PSEUDORANGE CORRECTIONS FOR 30SECONDS SMOOTHED PSEUDORANGE
𝐾𝑚𝑑 𝑒 𝑃𝑂𝑆,𝐺𝐿𝑂𝑁𝐴𝑆𝑆 8 0-12.75 0.05
𝐾𝑚𝑑 𝑒 𝐶,𝐺𝐿𝑂𝑁𝐴𝑆𝑆 8 0-12.75 0.05
Additional data block(s) (if provided may be included only
if Additional block 1 is also provided
Repeat for Additional Data Blocks
Additional Data Block Length 8 2-198 1 byte
Additional data Block Number 8 2-255 1
Data Content Variable
And for the Additional data block 3:
Table 39 – Additional data block 3
Data Content Bits Used Range of Values Resolution
Additional Data Block Length 8 6 1 byte
Additional Data Block Number 8 3 1
𝐾𝑚𝑑 𝑒 𝐷,𝐺𝑃𝑆 8 0-12.75 0.05
𝐾𝑚𝑑 𝑒 𝐷,𝐺𝐿𝑂𝑁𝐴𝑆𝑆 8 0-12.75 0.05
𝜎𝑣𝑒𝑟𝑡 𝑖𝑜𝑛𝑜 𝑔𝑟𝑎𝑑𝑖𝑒𝑛𝑡,𝐷 8 0 − 25.5 × 10⁻⁶ 𝑚/𝑚 0.1 × 10⁻⁶ 𝑚/𝑚
Spare 8 - -
B.3
Type 11 Message – Pseudorange Corrections for 30 Seconds Smoothed
Pseudorange
It provides the differential correction data for individual GNSS ranging sources applicable to pseudorange that are carrier smoothed with a time constant of 30 seconds. The message also includes parameters that describe the distribution of errors in the 30 second smoothed corrections as well as parameters that describe the error in the corresponding 100 seconds smoothed corrections (in type 1 message) as applicable for GAST-D.
Table 40 – Message Type 11 format
Data Content Bits Used Range of Values Resolution
Modified Z-count 14 0-1199.9 sec 0.1 sec
Additional Message Flag 2 0-3 1
Number of Measurement 5 0-18 1
Measurement Type 3 0-7 1
Ephemeris Decorrelation
Parameters (note 1 and 3) 8 0 − 1.275 × 10⁻³ 𝑚/𝑚 5 × 10⁻⁶ 𝑚/𝑚
For N Measurement
Ranging source ID 8 1-255 1
Pseudorange Correction
(𝑃𝑅𝐶𝜏 30) 16 ±327.67 𝑚 0.01 m
Range Rate Correction (𝑅𝑅𝐶𝜏 30 16 ±32.767 𝑚 0.001 m/s
𝜎𝑝𝑟 𝑔𝑛𝑑 100 (note 2) 8 0-5.08 m 0.02 m
𝜎𝑝𝑟 𝑔𝑛𝑑 30 (note 2) 8 0-5.08 m 0.02 m
Notes
1. For SBAS satellites the parameter is set to all 0’s. 2. 1111 1111 indicate the source is invalid
C.
MC/MF GBAS Ground Multipath and Noise Model
In this appendix the results obtained from some of other days of data collection done at Toulouse Blagnac airport. One day analysis will be shown also for Pattonville data collection of the 50 meters and 100 meters case.
C.1
Pattonville 50 Meters Case
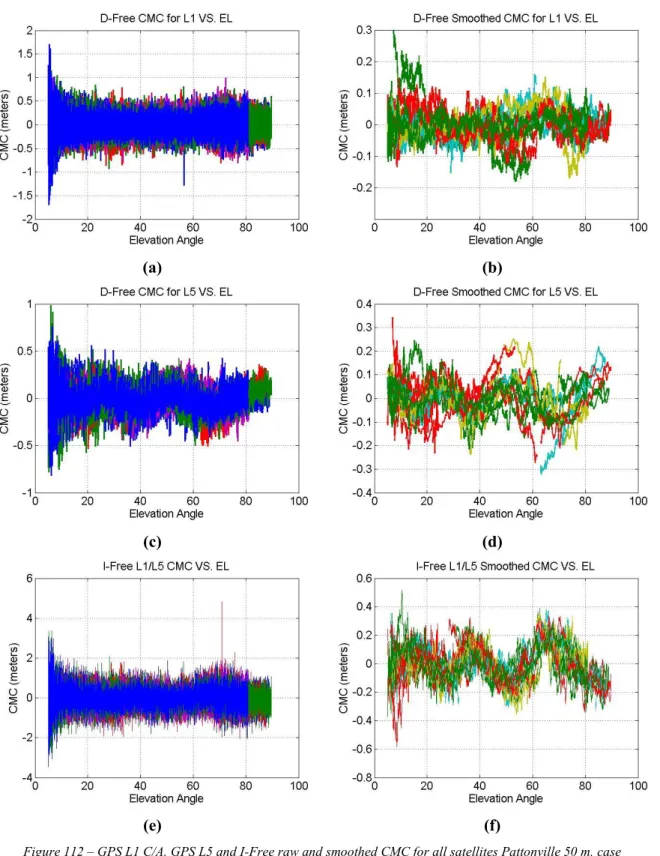
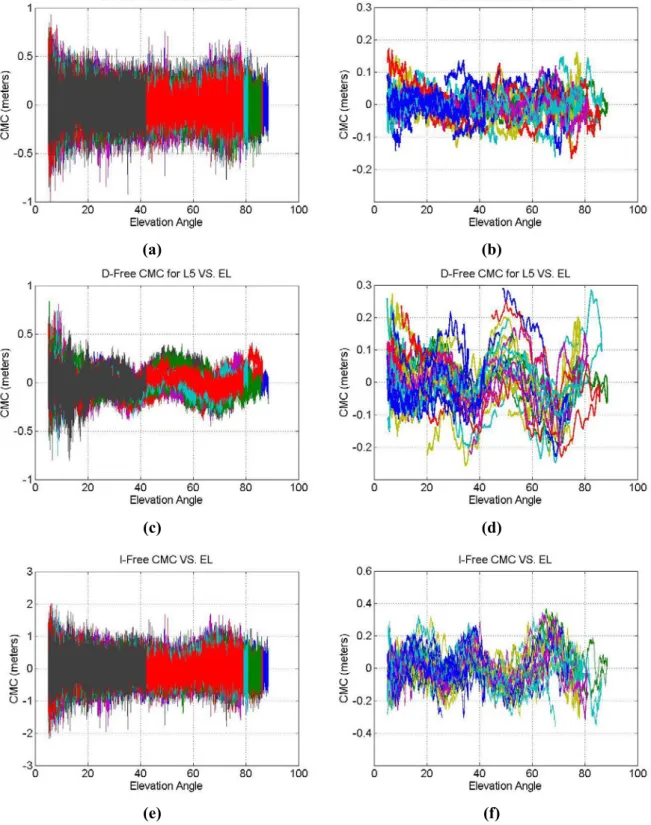
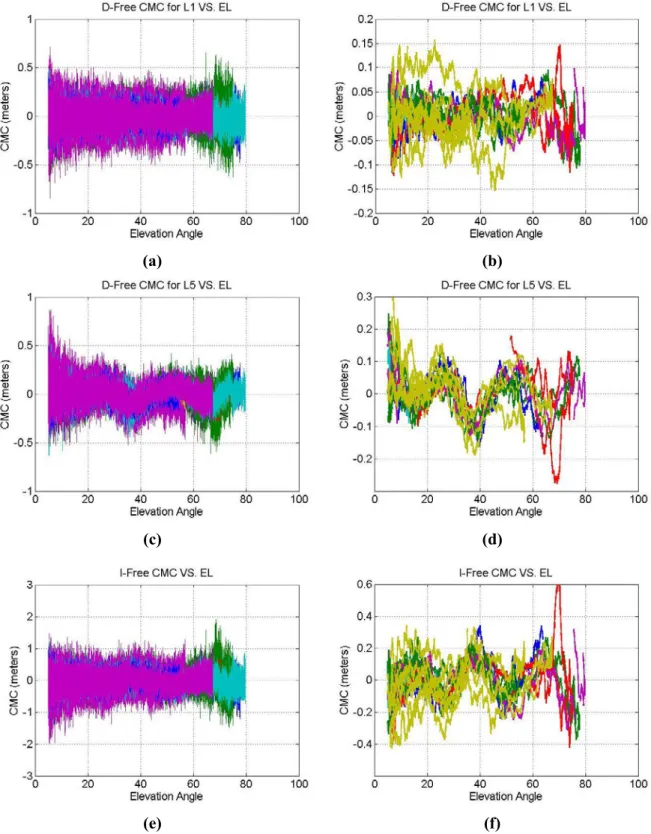
Figure 112 shows the raw and smoothed CMC for GPS L1, L5 and I-free combination for data collected at Pattonville with a building 50 meters far.
(a) (b)
(c) (d)
(e) (f)
Figure 112 – GPS L1 C/A, GPS L5 and I-Free raw and smoothed CMC for all satellites Pattonville 50 m. case The CMCs for this scenario are similar to the one obtained in 3.3.2 for Toulouse Blagnac. It is possible to note in (d and f) the same oscillations affecting the CMC derived from Toulouse data, this results confirms the hypothesis of an antenna calibration issue.
PATTONVILLE 100METERS CASE
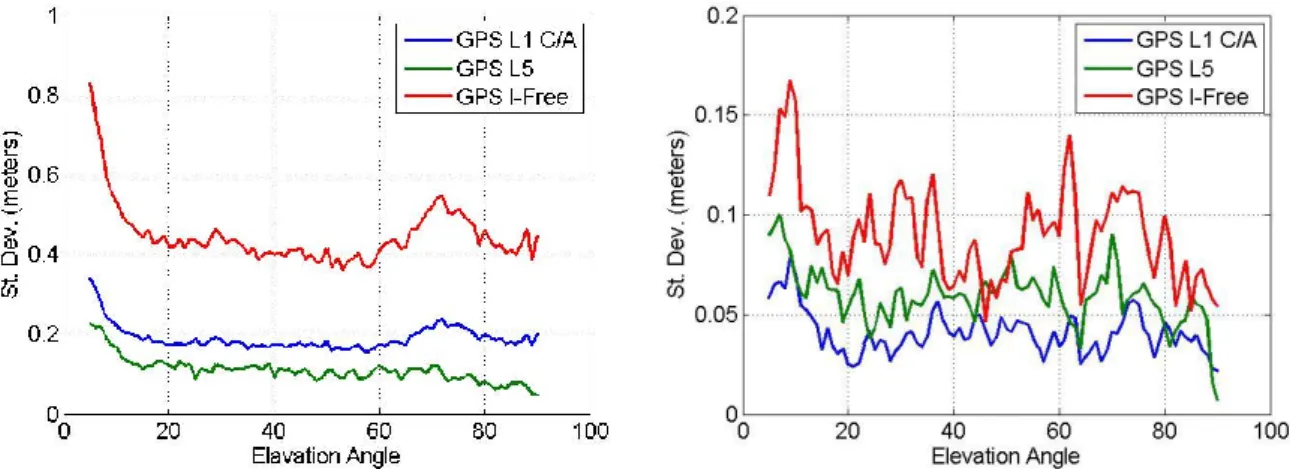
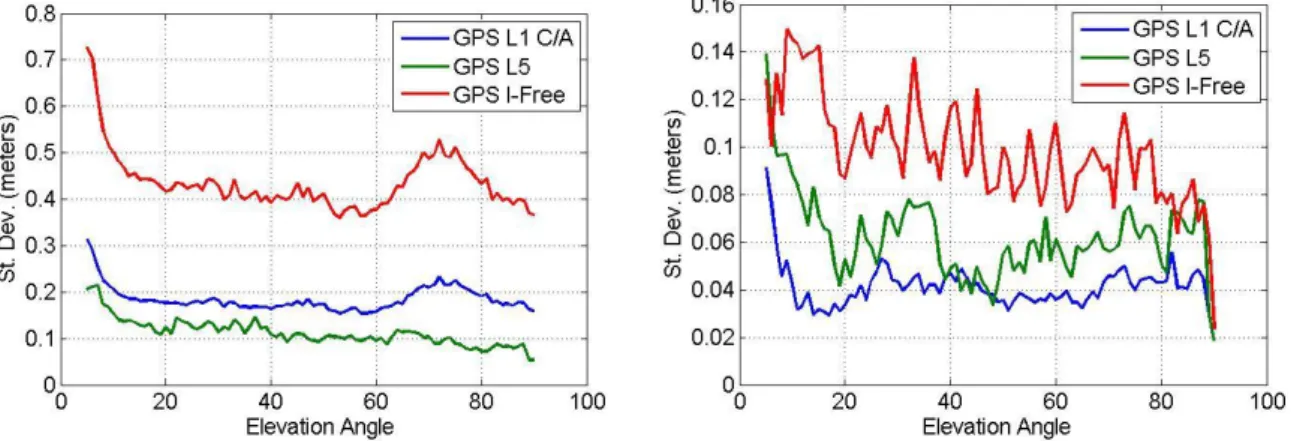
The standard deviation of the raw and smoothed CMCs for all signals and for I-free combination across all days are shown in Figure 113. The elevation angle binning has been done selecting all the CMCs in the interval ± 0.5°.
Figure 113 – Raw (left) and 100 s. smoothed (right) CMC standard deviation for GPS L1, L5 and I-Free combinations Pattonville 50 m. case
The values of the standard deviation for this analysis provides results similar to the ones obtained in 3.3.2.
C.2
Pattonville 100 Meters Case
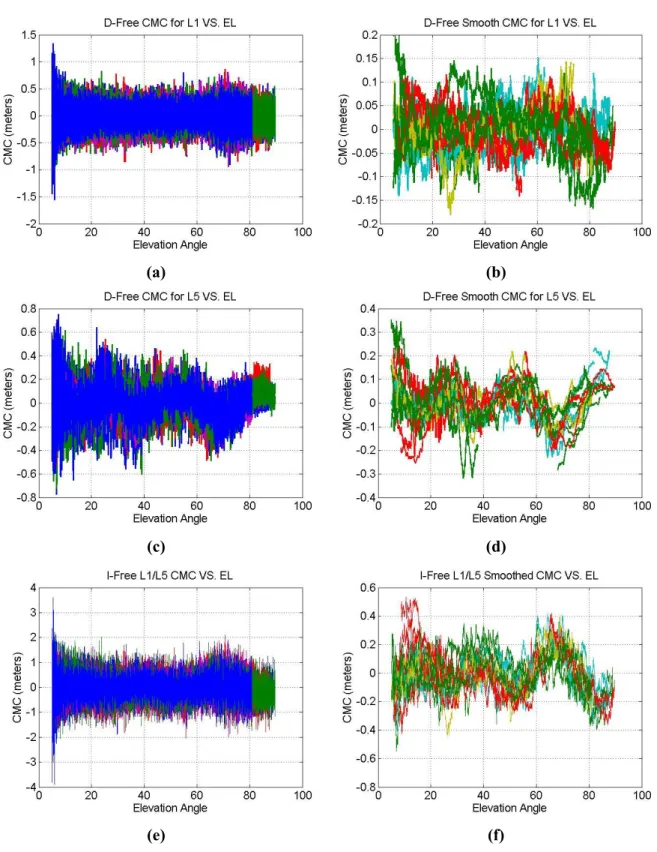
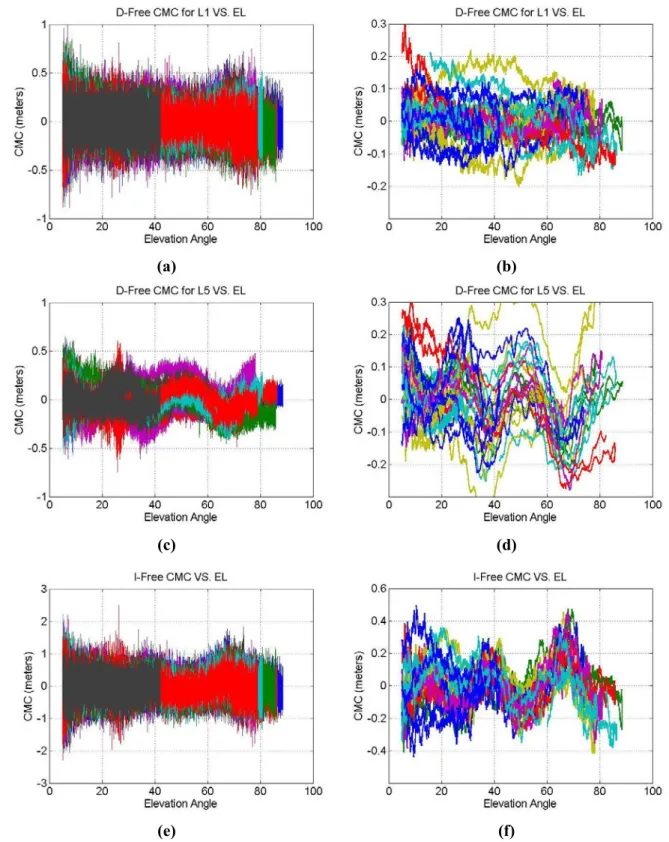
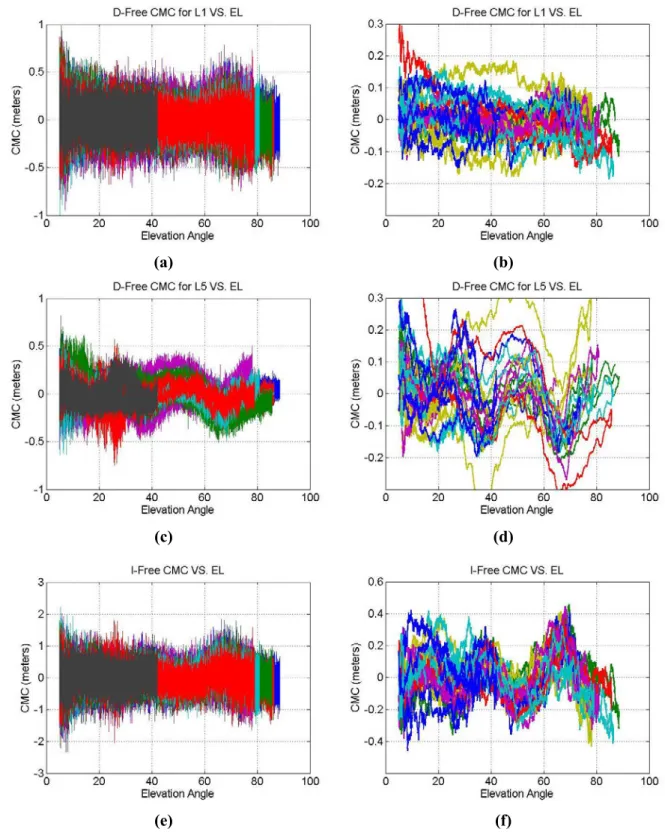
As for the previous section, the next three plots show the raw CMCs, L1 and L5 D-Free and I-Free, for one day out of the three analysed.
(a) (b)
(c) (d)
(e) (f)
Figure 114 – GPS L1 C/A, GPS L5 and I-Free for raw and smoothed CMCs for all satellites Pattonville 100 m. case Results in Figure 114, for all the cases, are similar to one obtained for the previous case, building 50 meters far, showing the multipath rejection properties of the used antenna. Also for this scenario the
TOULOUSE BLAGNAC AIRPORT
oscillations impacting GPS L5 (d) and I-free (f) are visible and they are similar to the ones seen in the other cases.
The last analysis regards the standard deviation of the raw and smoothed CMCs analyzed before. Figure 115 shows the obtained values.
Figure 115 – Raw (left) and 100 s. Smoothed (right) CMCs Standard Deviation for GPS L1, L5 and I-Free Combinations Pattonville 100 m. case
Results are similar to the ones obtained for the 50 meters case.
C.3
Toulouse Blagnac Airport
In 3.3 results from the analysis of data collected the 02/04/2016 are shown. In this section results for other three days will be shown. Results for the RR 2 will be shown as well. The scope is to check if the results are similar to the ones obtained. The three days analyzed are:
1. 03/04/2016 2. 06/04/2016 3. 09/04/2016
C.3.1 03/04/2016
(a) (b)
(c) (d)
(e) (f)
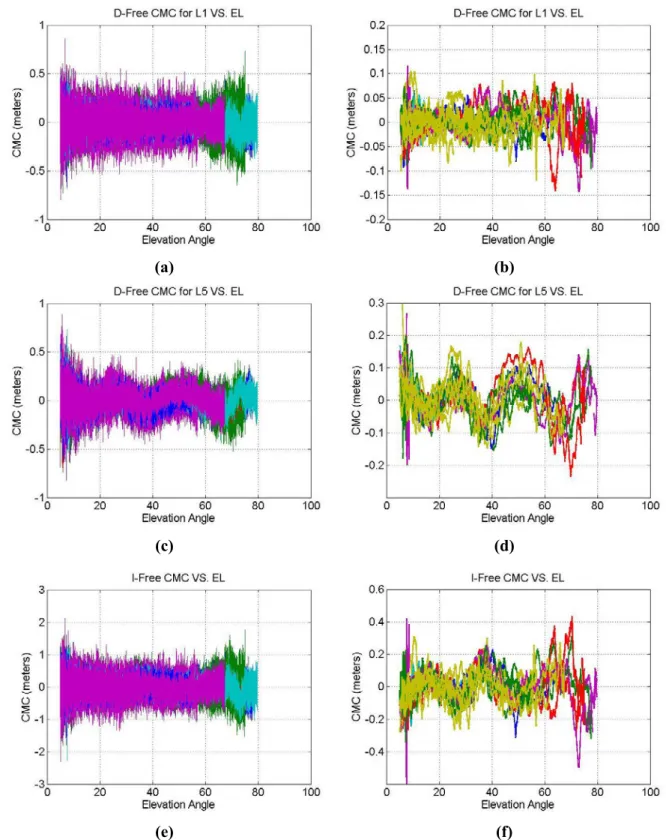
Figure 116 – GPS L1 C/A, GPS L5 and I-Free raw and 100 seconds smoothed CMCs for all satellites Toulouse Blagnac RR1 03/04/2016
TOULOUSE BLAGNAC AIRPORT
(a) (b)
(c) (d)
(e) (f)
Figure 117 – GPS L1 C/A, GPS L5 and I-Free raw and 100 seconds smoothed CMCs for all satellites Toulouse Blagnac RR2 03/04/2016
Figure 116 and Figure 117 show results similat to the ones obtained in Figure 26, it is possible to see that the CMCs from RR2 are affected by a bigger level of noise and multipath than the one on L1. The same analysis has been done for Galileo CMCs and it will be shown in Figure 118.
(a) (b)
(c) (d)
(e) (f)
Figure 118 – Galileo E1, Galileo E5a and I-Free raw and 100 seconds smoothed CMCs for all satellites Toulouse Blagnac RR1 03/04/2016
TOULOUSE BLAGNAC AIRPORT
(a) (b)
(c) (d)
(e) (f)
Figure 119 – Galileo E1, Galileo E5a and I-Free raw and 100 seconds smoothed CMCs for all satellites Toulouse Blagnac RR2 03/04/2016
As for the GPS case, Figure 118 and Figure 119 provide results similar to the one obtained in 3.3.2. Also for Galileo constellation the RR2 has CMCs noisier than the RR1. Possible cause of differences between the two RRs, already keeping into account that the two antennas are not positioned at the same place, is
the height with respect to the soil. The two antennas have a difference of about one meter, all other parameters related to the Low Noise Amplifier (LNA) or to the receiver are similar.
C.3.2 06/04/2016
TOULOUSE BLAGNAC AIRPORT
(a) (b)
(c) (d)
(e) (f)
Figure 120 – GPS L1 C/A, GPS L5 and I-Free raw and 100 seconds smoothed CMCs for all satellites Toulouse Blagnac RR1 06/04/2016
(a) (b)
(c) (d)
(e) (f)
Figure 121 – GPS L1 C/A, GPS L5 and I-Free raw and 100 seconds smoothed CMCs for all satellites Toulouse Blagnac RR2 06/04/2016
Results obtained in Figure 120 and Figure 121 are consistent with the ones obtained in the other analyzed days. Oscillations affecting L5 and I-free measurement are visible also for this day. Data form RR2 seem to be noisier than RR1 ones.
TOULOUSE BLAGNAC AIRPORT
The results for Galileo constellation are given in Figure 122
(a) (b)
(c) (d)
(e) (f)
Figure 122 – Galileo E, Galileo E5a and I-Free raw and 100 seconds smoothed CMCs for all satellites Toulouse Blagnac RR1 06/04/2016
(a) (b)
(c) (d)
(e) (f)
Figure 123 – Galileo E1, Galileo E5a and I-Free raw and 100 seconds smoothed CMCs for all satellites Toulouse Blagnac RR2 06/04/2016
Results for Galileo constellation, Figure 122 and Figure 123, reflects the results obtained for GPS case. Oscillations on E5 and I-free combination are visible also for this case.
TOULOUSE BLAGNAC AIRPORT
C.3.3 09/04/2016
Results for the last analyzed day are given, for RR1, in Figure 124
(a) (b)
(c) (d)
(e) (f)
Figure 124 – GPS L1 C/A, GPS L5 and I-Free raw and 100 seconds smoothed CMCs for all satellites Toulouse Blagnac RR1 09/04/2016
(a) (b)
(c) (d)
(e) (f)
Figure 125 – GPS L1 C/A, GPS L5 and I-Free raw and 100 seconds smoothed CMCs for all satellites Toulouse Blagnac RR2 09/04/2016
Results for GPS signals for 09/04/2016, given in Figure 124 and Figure 125, are similar to the ones obtained in the other days.
TOULOUSE BLAGNAC AIRPORT
(a) (b)
(c) (d)
(e) (f)
Figure 126 – Galileo E1, Galileo E5a and I-Free raw and 100 seconds smoothed CMCs for all satellites Toulouse Blagnac RR1 09/04/2016
(a) (b)
(c) (d)
(e) (f)
Figure 127 – Galileo E1, Galileo E5a and I-Free raw and 100 seconds smoothed CMCs for all satellites Toulouse Blagnac RR1 09/04/2016
Figure 126 and Figure 127 show the result for Galileo signals for the last analyzed day. The result are coherent with the ones obtained on previous days.
MLACALIBRATION ON L5
C.4
MLA Calibration on L5
In section 0 the comparison between RMS and standard deviation has been done to find possible residual biases on the CMCs. In this section the same analysis will be done on all other days in order to see if the same oscillations are present.
(a) (b)
(c) (d)
(e) (f)
Figure 128 shows that oscillations similar to the one observed for Toulouse Blagnac data collection are visible also on data from Pattonville. This result exclude the possibility of a bias related to the surrounding environment.
In Figure 129 and Figure 130 the CMCs obtained applying the calibration coefficient, computed in 0, are shown.
SMOOTHING EFFICIENCY
Figure 130 – Calibrated raw and 100 s smoothed CMCs for GPS L5 and I-Free for Pattonville 100 m. case As for Toulouse CMCs (Figure 26 and Figure 27) the application of the calibration values on the CMCs obtained at Pattonville removes the oscillations seen before.
C.5
Smoothing Efficiency
C.5.1
Pattonville Results
Results about smoothing efficiency have been shown on section 3.3.4 for Toulouse data. In this section the results for Pattonville will be shown.
Figure 131 – Real Vs. theoretical smoothing gain for GPS L1 C/A, GPS L5 and GPS I-Free for Pattonville 50 m (left side) and 100 m (right side)
Analyzing Figure 131 it is possible to see that results are consistent with the ones obtained from the analysis of Toulouse data.
SMOOTHING EFFICIENCY
(a) (b)
(c) (d)
(a) (b)
(c) (d)
Figure 133 – Autocorrelation function for GPS L1 C/A and L5 for satellite PRN 9 (a, b) and 25 (c, d) on Pattonville 100 m Results from Figure 132 and Figure 133 confirm what assesses in 3.3.4. The time correlation for L1 measurements is comprised between 3 and 5 seconds, on the contrary it is not possible to define unique value for GPS L5.
C.5.2 Toulouse Blagnac 03/04/2016 Results
SMOOTHING EFFICIENCY
Figure 134 – Real Vs. theoretical smoothing gain for GPS (left side) and Galileo (right side) signals for Toulouse Blagnac 03/04/2016 on RR1
Figure 135 – Real Vs. theoretical smoothing gain for GPS (left side) and Galileo (right side) signals for Toulouse Blagnac 03/04/2016 on RR2
Results from Figure 134 and Figure 135 are consistent with the ones obtained in 3.3.2
C.5.3
Toulouse Blagnac 06/04/2016 Results
SMOOTHING EFFICIENCY
Figure 136 – Real Vs. theoretical smoothing gain for GPS (left side) and Galileo (right side) signals for Toulouse Blagnac 06/04/2016 on RR1
Figure 137 – Real Vs. theoretical smoothing gain for GPS (left side) and Galileo (right side) signals for Toulouse Blagnac 06/04/2016 on RR2
Also for this day results are similar to the ones analyzed so far.
C.5.4
Toulouse Blagnac 09/04/2016 Results
SMOOTHING EFFICIENCY
Figure 138 – Real Vs. theoretical smoothing gain for GPS (left side) and Galileo (right side) signals for Toulouse Blagnac 09/04/2016 on RR1
Figure 139 – Real Vs. theoretical smoothing gain for GPS (left side) and Galileo (right side) signals for Toulouse Blagnac 09/04/2016 on RR2
As for the previous days, also in this case results are similar to the ones obtained in the previous cases.
C.6
Optimal Smoothing Constant
OPTIMAL SMOOTHING CONSTANT
Figure 140 – Standard Deviation Comparison for Different Smoothing Constants for GPS L1, GPS L5 and I-free on Pattonville 50 m (left side) and Pattonville 100 m (right side)
Results shown in Figure 140 are similar to the one obtained for Toulouse analysis. Also in this case for GPS L1 the choice of 100 seconds as smoothing constant can represent the optimal choice, considering the time needed before reaching the steady state. For GPS L5 and I-free combination the use of a bigger smoothing constant seems more logic in order to further reduce the noise and multipath contribution. As fir Toulouse case 300 seconds seems to be the optimal choice.
C.7
Assessment of I-Free RMS
Results obtained analysing Pattonville data will be shown here.
Figure 141 – Real and theoretical I-free CMCs RMS comparison for satellite PRN 1 (left) and PRN 8 (right) Pattonville 50m
Figure 142 – Real and theoretical I-free CMCs RMS comparison for satellite PRN 1 (left) and PRN 8 (right) Pattonville 100m
Figure 143 – RMS difference percentage distribution for GPS I-free for Pattonville 50 m (left side) and 100 m (right side), each color represents a satellite
AVERAGED NOISE AND MULTIPATH
Because the inter-frequencies correlation values, especially in negative values, the RMS of the I-free combination can be bigger than the one computed according the model proposed in literature. This results confirm the need to inflate the I-free model to bind the standard deviation.
C.8
Averaged Noise and Multipath
In this section the results of averaging the CMCs of two antennas are shown for the other days analyzed from Toulouse Blagnac.
(a) (b)
(c) (d)
Figure 144 – Standard deviation comparison between empirical and theoretical value for GPS CMCs (a, c) and Galileo CMCs (b, d) 03/04/2016
(a) (b)
(c) (d)
Figure 145 – Standard deviation comparison between empirical and theoretical value for GPS CMCs (a, c) and Galileo CMCs (b, d) 06/04/2016
AVERAGED NOISE AND MULTIPATH
(a) (b)
(c) (d)
Figure 146 – Standard deviation comparison between empirical and theoretical value for GPS CMCs (a, c) and Galileo CMCs (b, d) 09/04/2016