HAL Id: hal-01779828
https://hal.archives-ouvertes.fr/hal-01779828
Submitted on 27 Apr 2018
HAL is a multi-disciplinary open access
archive for the deposit and dissemination of
sci-entific research documents, whether they are
pub-lished or not. The documents may come from
teaching and research institutions in France or
abroad, or from public or private research centers.
L’archive ouverte pluridisciplinaire HAL, est
destinée au dépôt et à la diffusion de documents
scientifiques de niveau recherche, publiés ou non,
émanant des établissements d’enseignement et de
recherche français ou étrangers, des laboratoires
publics ou privés.
Analyses
Nk M’Sirdi, A Naamane, A Boukara, M Benabdellatif
To cite this version:
Nk M’Sirdi, A Naamane, A Boukara, M Benabdellatif. Electrical Loads of a Smart House and
Consumption Analyses. International Conference on Electronic Engineering and Renewable Energy
(ICEERE’2018), Apr 2018, Oujda, Morocco. �hal-01779828�
Electrical Loads of a Smart House and
Consumption Analyses
N. K. M’Sirdi, A. Naamane, A. Boukara⋆, and M. Benabdellatif
Aix Marseille Univ, Universite de Toulon, CNRS, LIS, Marseille, France SASV group of LIS UMR CNRS 7020, 13397, Marseille France, e-mail:
nacer.msirdi@univ-amu.fr
Abstract. This paper considers the modeling energy consumption of a
house with as objective the dimensioning and optimization of renewable energy sources and the energy saving. For the heating needs a house with 4 rooms is modeled and simulated in Matlab/simulink to predict the needed power. The thermal characteristic and model parameters are deduced for the architectural studies and design using architects softwares. We assume that 4 to 5 people live in this house of 100𝑚2. Despite the
question seems classical, for going toward zero energy buildings, it has never been considered scientifically to define a complete set of models and simulations. In this work, we measured the consumption of each one of the house loads to be able to have a corresponding models.
Keywords: House Energy, Renewable Energy Sources, Buildings and Energy.
1 Introduction
The sustainable buildings and energy savings are of paramount importance nowadays. This is strongly coupled with our lifestyle and our daily habits and behavior. The building sector is the leading energy consumer sector, ahead of transport and industry. It also accounts for 25% of the country’s carbon dioxide emissions. The building can be equipped with renewable energy sources, for this reason it is considered a huge potential source of energy savings, hence the existence of many research works on this topic [1], (http: / /www2.ademe.fr).
A house or apartment contains several pieces of electrical equipment that differ in the power consumed, the type of use by users and the rate of penetration into the dwelling. The energy demand is the result of the electricity consumption of the different uses depending on the electrical equipment chosen. To properly manage these electrical equipment in a building, either to reduce energy and maximize the comfort of the user, it is necessary to know the period of consumption and the power consumption of each equipment [2].
Equipment such as heating, ventilation and air conditioning are directly dependent on the design, insulation and structure of the house. The consumption
of domestic hot water depends on the occupants, their number and their con-sumption habits, but also, possibly, certain household appliances. Other energy consumption includes all electrical equipment used by the occupants: appliances, multimedia, lighting and of course active system supports such as heat pumps and circulators (VMC, floor heating pumps and heating circuits like radiators for example).
To analyze the energy needs, a modeling of the different electrical equipments has been developed. This modeling takes into account the nominal dynamic of each component without taking into account the noise of measurements, the disturbances and the nuisances that it can generate.
Consuming less, without polluting and paying less, despite the proliferation of home appliances, home automation, audiovisual and high-tech in homes, are motivated by economic and ecological concerns. New technologies are developing and becoming more democratic, and their increase does not necessarily push up the electricity bill. They are less and less greedy in energy. Households are increasingly equipped with one or more TVs, computers, a box ADSL, printers, household robots, vacuum cleaners, to mention only the classic household appliances [3, 4].
A serious study of the needs and the proposal of solutions and tools must go through a fine and complete analysis. The need for prediction models or models becomes unavoidable. Smart buildings promised to revolutionize the way we live. Applications ranging from climate control to fire management can have significant impact on the quality and cost of these services. However, smart buildings and any technology with direct effect on human safety [5, 6].
Virtual testing by means of computer simulation can significantly reduce the cost of testing and, as a result, accelerate the development of novel applica-tions. Unfortunately, building physically-accurate simulation codes can be labor intensive [7,8]. Several questions arise:
- What types of houses will be most common tomorrow? - What domotic and domestic equipment do they need? - What will the electricity consumption be?
- What will be the demand for water and hot sanitary water? - What equipment will be needed and how to size it?
- What controls and optimizations can we have and already prepare for future equipment?
Once such a list is established, the questions that arise will be the power demanded and the energy consumption of each equipment, according to its use, the environment and the weather. All this will obviously be related to the number of occupants of the house, their functions and their habits. This means that prototyping is not an easy task and has links with the environment, society and the weather.
The ideal test house is an object as much researched by both manufacturers and architects, as well as a great interest for equipment manufacturers and home automation suppliers. But it would also for the needs of civil engineering and
Electrical Loads of a Smart House and Consumption Analyses 3
society as well as the equipment suppliers and the sizing of installations, electrical, thermal, solar, sanitary, etc ...
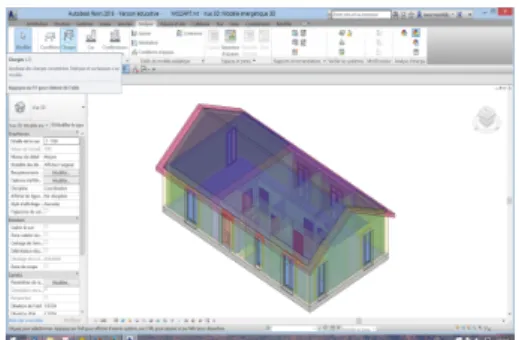
The least expensive, optimal and easiest to use is the digital mockup. The figure 1 below shows the house chosen to develop our numerical model.
Fig. 1. The the House Studied
In this work, we embarked on the study of a first case that seems very common today and which has already been partially addressed, a house of 100m2 occupied by 4 or 5 inhabitants
in a modern city [9]. The simulation is double or triple because it considers; - the domestic charges, - the thermal
envelope and its temperature regula-tion - and finally the sources of energy of which it can be equipped.
Dynamic simulation is proposed as a tool for analyzing the thermal
behav-ior of the house after the study of its design from the architectural point of view and the study of its thermal envelope. This first architectural design study, will provide the relevant parameters for the characterization of the thermal envelope and will verify, still remains in the rules and standards imposed today on the building that must be respected in any housing project [5].
The subsequent thermal modeling and the use of climate data will help describe the thermal behavior of the house, analyze sources of leakage, adjust and control the heating system and avoid overheating. This study will aim to validate the choice of technical solutions for the home (such as insulation choices, structure and organization, thermal inertias and insulation thicknesses to use). In designing the best adapted solutions will be chosen or preferred according to their efficiency and contribution [8].
The life of the building and its occupants according to their environment and the weather causes several energy consumptions. We will study the various loads and the demand for power to make a modeling that would give a simulation as close as possible to the real case. Our study will be based on a bibliographic study that will be completed and / or adjusted by real-time measurements made in a house in Marseille. The last step in perspective will be to resume the modeling of sources carried out in the thesis [MounaThese] to best meet all its loads by a hybrid renewable energy system (HyRES: Hybrid Renewable Energy Sources) [5, 6].
Simulation becomes an important step to facilitate the labelisation of the project by highlighting the exact performances of the processes implemented in the design. This report is made up of three parts: one for consumption studies of domestic appliances, the second for the building and its thermal envelope and the last for the simulation of a house, its loads and its heating. The following study will concern the proposal of a numerical model for thermal and solar energy sources and the heating system of a building.
2 Electric Consumption of Domestic Appliances
2.1 IntroductionSeveral works have proposed examples of individual houses. The ’Mozart House’ studied in a collaboration involving the CSTB attracted our attention because it seems today close to the current standard in most regions of France and Europe [10]. In general, it is considered that 4 to 5 people live in this house and have all the current equipment of today (laptops, TV, Hifi, electric bike, etc ...). The studies presented seem to us incomplete because they have considered only one or two kinds of applications, such as heating or the study of some household tasks [6, 11].
Some specific uses of energy In his report Zorzi [10] studies the regulation of
a combined solar system for the building. It presents a bibliographic study of commercial SSCs to identify widespread configurations. The Matlab / Simulink software and the SIMBAD library are used to evaluate the regulation. Julien Bruneau et al offer a virtual model for the rapid physical behavior test of a house. They consider analytical models for the environment and a discrete event system [12,13]. They present simulations for heating, ventilation and air conditioning (HVAC: Heating, Ventilation and Air-Conditioning), with the aim of optimizing the energy for the air conditioning of a building [?, 14].
The work of M. Annabi et al proposes the estimation of the energetic per-formances of the envelope of a building to analyze the perper-formances in terms of economy and comfort. The TRNSYS simulation tools with IISIBAT are used for the study of thermal problems [?]. Mouna Abarkan, in her thesis at the LSIS [6], studied modeling the thermal behavior of a building equipped with renewable energy sources of household appliances, 3 types of heating and a multi sourced energy management systems with multiple users [15, 16].
The electrical consumption of home appliances, if we believe the number of studies available on the internet, is of interest to many sellers of various electrical equipment, home equipment suppliers and home or energy suppliers [4,8,17]. Their studies are concentrated on high-tech appliances, audiovisual, home automation and home appliances. The annual consumption used in their criteria, such as the number of hours of daily use, which varies according to each person’s interests, reinforces their sales arguments (cost price). In this sense, they interest us because the use varies according to the users (their customers) and technologies [18]. For a music lover, for example, a Hi-Fi system will work maybe 4 hours instead of just 2 for the computer or TV, which will work a little less.
One can even find simulators who estimate the consumption of a house to propose a supply of energy or another and to convince the customers for the purchase of a solution of heating or various arrangements. The consumption of some domestic appliances is studied, especially to know what cost it represents on the annual electricity bill. Some factors, such as the technologies (which are constantly increasing) used or new standards imposed, are likely to vary the power consumption of the devices. The available data are generally to be reevaluated or
Electrical Loads of a Smart House and Consumption Analyses 5
adjusted according to new technologies, costs (not affordable or general public) and the need (fashion effects).
The composition of a family is a variant to consider, especially for the use of household appliances such as computers, laptops or even the washing machine and dishwasher, which require more washing cycles in a large family. The use of a simple kettle, multiplies the peaks or increases their intensity depending on the composition of the family. It is worthwhile to note that such analysis is quite different from the existing results got for standards and commercial uses.
Which variables are to be taken into account? How to consider in a scientific context, these studies and how to draw a credible balance sheet? These are the questions we asked ourselves and we try to give answer.
Classifications of household appliances A classification according to the
main technical characteristics of the equipment park is reported below [2–4]. An estimate taking into account the average alternation of use and standby and average consumption is presented in [2,17,19]. It considers 280 cycles of use per year for a dishwasher and 220 cycles for a washing machine. For audio-visual and high-tech devices, the study used an estimate of average usage times, "mixing official data and experience". For a large number of devices (used for leisure), consumption may decrease or increase depending on the habits and passions of the consumer.
Consumption of appliances in operation The table below makes it possible to check the cost generated by electrical appliances when they are in operation. The electricity bill can be reduced by limiting the duration of use of these devices (especially the most energy-hungry). These data date from 2009 or before and must therefore be reconsidered [?]. It is also necessary to consider for most of these devices their standby consumption (standby status). This last consumption can be eliminated by turning off the device concerned [3,4].
2.2 Measured Consumption of Domestic Appliances
Some devices are used less than 5 to 6 hours a day and alternate operating phases with consumption that can go from 100 to 300W with standby phases consuming less than 1 W. Others are used punctually and consume a lot during a short instant as kettles coffee makers. Some appliances consume a lot of electricity in operation but are only used for a few minutes a day or a week (hair dryer, kettles, electric gates). The devices, equipped with regulators or servo controls, operate stably with an irregular consumption. They are sensitive to the environment, the weather and their uses. This is the case of heaters or water heaters, a freezer, a refrigerator. In general, they consume more to reach a temperature or a set point in order to absorb a disturbance (opening of the door, increase of the load, ...). They are less greedy for stabilizer or regulate the temperature or maintain the variable of interest at its setpoint.
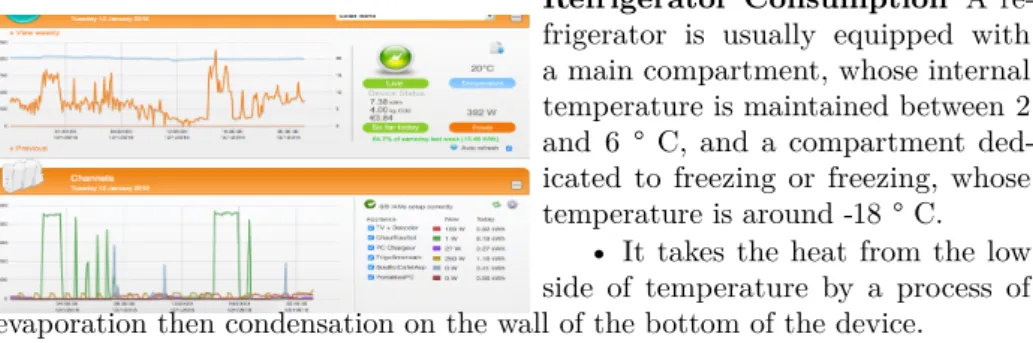
Fig. 2. Data Acquisition
To validate the profiles of the different house-hold loads, we have equipped our house with a power measurement system at the general meter, coupled with wall outlets for measuring the con-sumption of the various appliances. This is the All Green system equipped by Current Cost (see Fig 2.2 www.my.currentcost.com).
Below, as an example we show the curve pro-vided for the instantaneous total power consump-tion for one day (20/12/2015). It presents an estimate of the temperature and the variation of power at the level of the meter. The peaks are when the home TV is on the road at the same time as the other devices. Around 4h and 16h a large peak represents the consumption of electric water heater (Fig2.2). Details on all these measurements can be found in the project report, which led us to a good numerical model for all the house loads.
Refrigerator Consumption A
re-frigerator is usually equipped with a main compartment, whose internal temperature is maintained between 2 and 6 ° C, and a compartment ded-icated to freezing or freezing, whose temperature is around -18 ° C.
• It takes the heat from the low side of temperature by a process of evaporation then condensation on the wall of the bottom of the device.
• It rejects the condensation to the outside by a grid device placed on the back of the unit.
The power consumption of an American refrigerator has two or three daily peaks separated from 6 to 8h corresponding to the uses (around 7am and 13h and 19h) and two peaks for defrosting the evaporators (by heating resistors in 20 minutes each day), necessary to maintain their performance. These resistors absorb nearly 80% of the daily energy required for a 360-liter Class A refrigerator. The power of the device is 20 or 30 W at the compressor stop.
The internal temperature of the refrigerator is regulated in "On/Off", that is to say it is either at a standstill (P <10W) or at its nominal power (Pn=150W for our case) for a production of cold, (refrigeration) [?, 11].
Model of a freezer Nowadays, freezers play an important role in our homes
because they ensure better food preservation. Despite their relatively low power consumption, they are big consumers of energy because they work permanently.
They freeze food and keep it for a long time at -18 ° C. The same operating principle is the same as that of a refrigerator. The model and simulation of a freezer with Pmax = 100W is considered.
Electrical Loads of a Smart House and Consumption Analyses 7
Model of a washing machine A washing machine is today one of the essential
household appliances in a home. Its frequency of use varies on average from 3 to 10 times a week, depending on the composition of the home. The laundry is washed in a drum using detergent and hot water, in a succession of washing, rinsing and spinning cycles. Operation goes through at least three stages, with water heating [?]. The heating of the water reaches at temperatures of 30 or 40 to 90 ° C depending on the type of laundry to be washed (washing program).The washing machine is used on average 7 to 10 times a week in 4 to 6 days of the week, most of the time at off-peak times to reduce the bill except sometimes a short program (15 minutes off-peak hours). A washing cycle at 30 ° C, takes 1 hour and 20 minutes. The washing machine model needs a power rinsing up to 80W to wash, the spin power is 150W and the washing heating power is 2400W. The main simulation steps of the washing machine: - the water heating takes about 10 minutes, - the washing and rinsing are low consumption last about 40 minutes, - the spin is characterized by a power of 150W for a period of about 10 minutes. The power of the heating phase is approximately 2400W depending on the pre-set temperature (30, 60 or 90 ° C).
Consumption of an ADSL BOX and Wifi Printer The consumption of
the Box (in purple Max 14 W and min 11W) at the same time as that of the network printer known via WIFI (HP6700 printer). The day before the printer consumes 1 to 2 Watts and for an impression it goes to 6W then 12W or 8W (25 pages printed).
Consumption of an electric kettle Kettle and coffee maker are machines
used occasionally during the day (often at sunrise and before sunset). They have peaks, usually high, consumption.
Consumption of the living room TV set . The consumption of the Box is
almost constant at 11 Watts more than once 1 or 2W extra. The use of the TV is intermittent and consumes more than 110W is in standby it is at 12W; why it is turned off as often as possible. Other TV sets sometimes consume more but usually less when they are smaller. We will see that the TV set of the kitchen, much smaller, consumes less than 40W it is connected to the same sensor socket as the washing machine and is less often turned on. Its standby consumes less than 2W because it is newer.
The power consumption of a PC The power consumption of a PC is given
by the table below according to the reference [19]. It should be noted that there are fewer and fewer PCs of this kind (rather old). It should be noted that there are fewer and fewer PCs of this kind (rather old) in homes for laptops that consume less and are increasingly powerful. The figure below shows the battery charge consumption of an ASUS notebook PC (quite powerful multicore) and a Macbook Air laptop. The charge cycle takes powers up to 65 W. When the battery is medium-sized, it uses about thirty Watts.
The Power Consumption of a Washer Robot A robot cleaner uses water
vapor; for this the water is heated to boiling. For a while it consumes about 40 to 50W to preheat the water then we can start the process of cleaning surfaces (carpets, carpets, etc.). It consumes then about 1400W of power for sending
steam and suction.
The Power Consumption of a Clothes Dryer The tumble dryer consumes
a lot of power at the start because the laundry is wet and the heating of the air is blown to the maximum. This power decreases gradually as the laundry dries; temperature regulation requires less power. The drying lasts about 40 minutes.
Model of a Stove There are two types of cookers: - gas cooker or electric
cooker. Here we consider cooking appliances that use electricity. The temperature of a range can vary between 50 ° C and 300 ° C. The energy consumed depends on the time of use of the cooker [5, 11]. We have two peaks in its operation, the first peak present between 12h to 13h, its power is 457W and a second peak in the evening between 19h and 20h.
2.2.12 Model of a Dishwasher This device is used almost every day, making
it one of the most energy-consuming devices. There are currently devices with multiple programs that can operate in "low temperature" and "medium capacity" modes, which can save energy. A dishwasher is modeled in the same way as a washing machine.
Its operation goes through four stages:
1. prewash: the water is sprayed on the dishes thanks to the spray arms 2. the main wash: the water is heated according to the chosen program and sprayed by the rotating spray arms. The higher the temperature, the more powerful the washing,
3. rinsing: after the main wash, the dishes are rinsed several times. 4. drying.
A dishwasher model uses with 80W wash power and 1600W wash power. We have three phases (without prewash), the first phase presents the main wash phase which is done with hot water, which corresponds to the first peak power (about 1600W), then we have a low power (about 60W) which corresponds to the washing phase (where only the pump runs) and one or two rinses in cold water and finally we have the last phase which is the hot water rinse phase and a short drying phase that correspond at the second peak (about 1600W).
Lighting model of a house The lighting of buildings depends on the user;
the power is on average 120W. We have two peaks, the first peak present in the morning, it is at most (120W) from 5h to 7h30 and the second peak in the evening and it is at its maximum between 18h to 21h.
Electrical Loads of a Smart House and Consumption Analyses 9
2.3 Simulations of the different electrical loads of a house
Simulation of the different electrical loads such as washing machine, refrigerators, freezers, dishwashers, stoves, heating, television and lighting for a day, with a maximum power of 1600 W, can be done as shown in [5]. Without heating for a day, with a maximum power of 900 W, we note that when simulating the loads, without heating, we have a maximum power of 900W, if the heating is activated in the simulation the maximum power goes to 1800W. Heating consumes more energy than the other equipments. With the proposed models we are then able to predict the smart house consumption.
3 The House and its thermal behavior
We chose a house model that seems most common in modern cities (using tools and news equipment) inhabited by a common family composition; 4 to 5 people. The equipment chosen are all within the reach of the middle-class inhabitant or slightly above. The ’Mozart House’ which has been an example for several works is proposed. It is a detached house, full foot. It is composed of 3 rooms, a kitchen, a bathroom and a stay. It is occupied by 4 people and has all the usual multimedia equipment, such as TV, a hi-fi system, electrical appliances with various batteries electric bike, laptops, computers etc .... Not to mention household appliances such as a washing machine, a dishwasher, freezer and refrigerator, we consider several types of tools consuming electricity and sometimes hot water. We must therefore estimate all household loads and evaluate the use of Hot Water Supply (DHW).
3.1 Modeling the thermal behavior of a building
The choice is to define the most suitable method for the application considered. Our goal is to explain the thermal behavior and to evaluate the need for energy. The thermal behavior and energy consumption of the building must be evaluated and monitored in real time. The objective is therefore the real-time dynamic simulation of the energy behavior of a building. We can use Matlab Simscape or Modelica for the electro-thermal behaviour simulation of the 4-rooms house [13] [6,20]. Each room has different components: a ceiling, a floor, a door, four walls. They can be with and without insulation, such as a door or window with double glazing, a floor or underfloor heating, an auxiliary heater and a thermostat.
4 Conclusion
The energy consumption of a house is studied in detail with as objective the di-mensioning of a Hybrid Renewable Energy production System. The optimization and the energy saving, can then be considered. We estimate the loads consump-tions. The heating energy needs, assuming that 4 to 5 people live in this house has been also studied.
References
1. ADEME. Agence de l’environnement et de la maîtrise de l’énergie. [Online]. Available: http://www.ademe.fr/connaitre/presentation-lademe 1
2. “Accueil maison 34 la consommation électrique des appareils domestiques,” Publié le 19/02/12 à 13h50 | Mis à jour le 23/02/12 à 11h27, 2012. [Online]. Available: http://www.lesnumeriques.com/electromenager/consommation-electrique-appareils-domestiques-a1538.html 1, 2.1
3. E. Ecogestes, “A guide to energy-efficient heating and cooling by energy star.” 1, 2.1, 2.1
4. E. Star, “A guide to energy-efficient heating and cooling by energy star.” 1, 2.1, 2.1, 2.1
5. M. Abarkan, F. Errahimi, N. M’Sirdi, and A. Naamane, “Analysis of energy consumption for a building using wind and solar energy sources,” Energy Procedia, vol. 42, pp. 567–576, 2013. 1, 1, 2.2, 2.3
6. M. Abarkan, N. M’Sirdi, and F. Errahimi, “Analysis and simulation of the energy behavior of a building equipped with res in simscape,” Energy Procedia, vol. 62, pp. 522–531, 2014. 1, 1, 2.1, 2.1, 3.1
7. A. des fabricants, “Les déperditions d’un chauffage électrique: Rendements et pertes thermiques.” 1
8. O. SIDLER, “Notes techniques et réflexions consommations de veille des princi-paux appareils domestiques,” Enertech, Ingénierie énergétique 26160 FELINES S/RIMANDOULE TEL / FAX : (33) 04.75.90.18.54, report, Fevrier. 1, 1, 2.1 9. A. V. Schijndel and M. Martin, “Advanced simulation of building system and
control with simulink,” in 8th International IBPSA Conference, vol. August 11- 14„ Eindhoven, Netherlands„ 2003. 1
10. Z. J, J. Menet, and C. Muresan, “Evaluation par simulation de régulateurs appliqués aux systèmes solaires combinés.” Département Développement Durable CSTB, Marne-la-Vallée, Rapport, 2015. 2.1, 2.1
11. R. M. Badreddine, “Gestion énergétique optimisée pour un bâtiment intelligent multi-sources multi-charges: différents principes de validations,” Ph.D. dissertation, Université de Grenoble, Grenoble, October 2012. 2.1, 2.2, 2.2
12. J. Bruneau, C. Consel, M. O’Malley, W. Taha, and W. M. Hannourah, “Virtual testing for smart buildings,” in IE 2012, vol. 8th International Conference on Intelligent Environments, 2012. 2.1
13. Y. Raffene, “Optimisation du controle thermique dans une habitation multi source,” thèse de doctorat, L’Ecole gènerale de Lyon, Lyon,. 2.1, 3.1
14. J. I. Levenhagen, HVAC control system design diagrams. McGraw-Hill Professional, 1999. 2.1
15. M. Amer, A. Namaane, and N. M’Sirdi, “Optimization of hybrid renewable energy systems (hres) using pso for cost reduction,” Energy Procedia, vol. 42, pp. 318–327, 2013. 2.1
16. D. Ha, “Un système avancé de gestion d’énergie dans le bâtiment pour coordonner production et consommation,” Ph.D. dissertation, Institut National Polytechnique de Grenoble, Grenoble, Septembre, 2007. 2.1
17. E. Douces, “Tableau de consommation des appareils électroménagers.” 2.1, 2.1 18. H. asbl vzw, “Appareils électroménagers et éclairage.” 2.1
19. V. Magnin, “Consommation électrique d’un pc.” 2.1, 2.2
20. S. Lu, D. HA, E.Zamai, S. Bacha, and A. Manificat, “Simulation de performance d’un système multi-sources d’énergie en utilisant le plancher chauffant pour chauffer un bâtiment,” in conference IBPSA, vol. IBPSA, Lyon, France, 2008. 3.1